Download to read offline


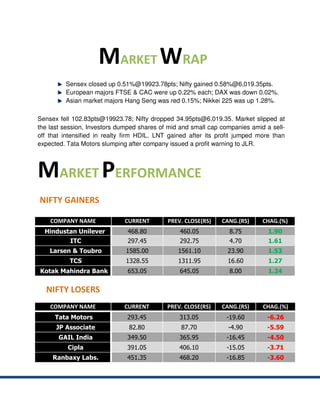
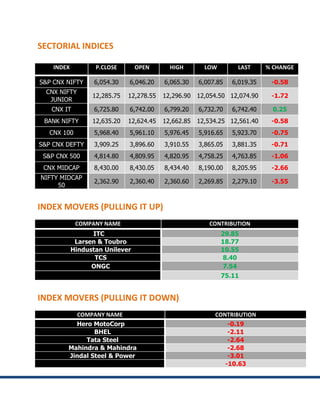

- The Sensex closed up 0.51% while the Nifty gained 0.58% in Indian equity markets. In Europe, the FTSE and CAC closed up 0.22% each while the DAX closed down 0.02%. In Asia, the Hang Seng closed down 0.15% while the Nikkei 225 closed up 1.28%. - Hindustan Unilever, ITC, Larsen & Toubro, and TCS were the top gainers in the Nifty while Tata Motors, JP Associates, GAIL India, Cipla, and Ranbaxy Labs were the top losers. - Most sectoral indices closed lower with the CNX Midcap index


