Download to read offline


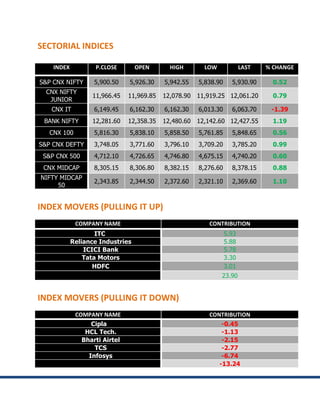

- The Sensex closed up 0.49% and the Nifty gained 0.52% as the markets recovered from early losses. - Key European markets were also up between 0.24-1.07%, while the NASDAQ fell 0.77% and the Dow Jones rose 0.64%. - Major gainers in the Nifty included Jaiprakash Associates, DLF, Axis Bank, Reliance Infra and Tata Motors, rising between 2-4%.


