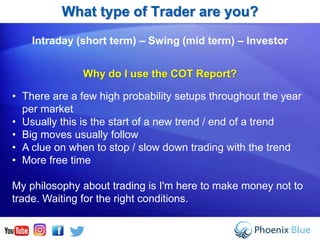
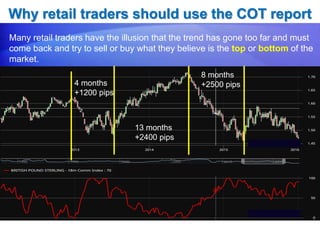
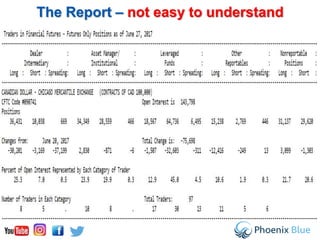
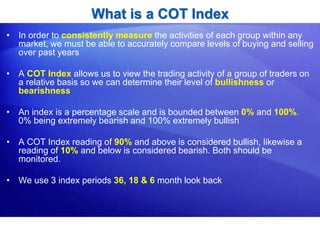
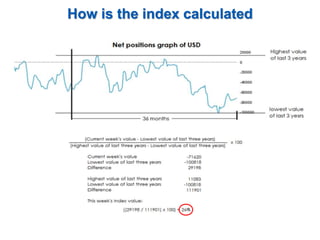
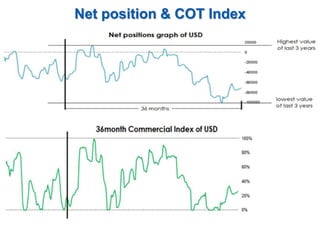
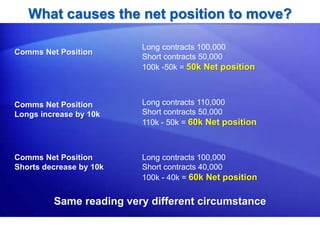
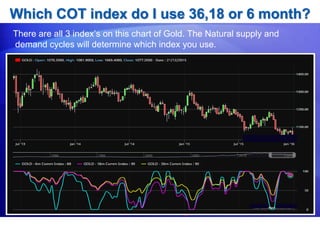
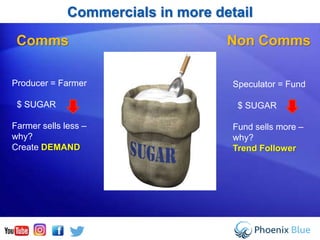
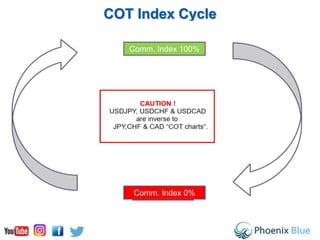
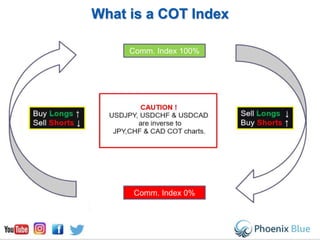
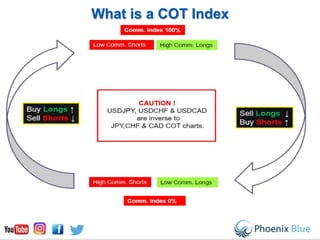
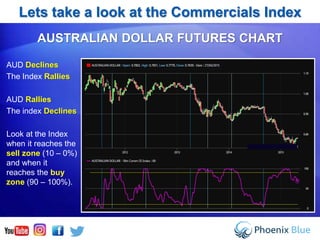
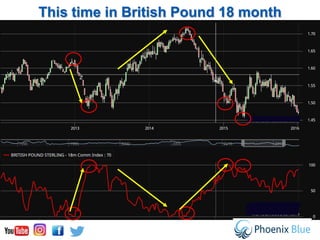
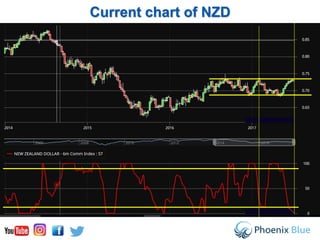
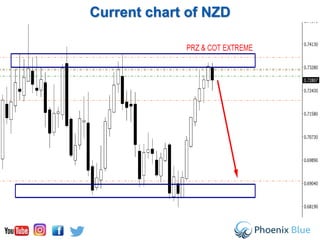
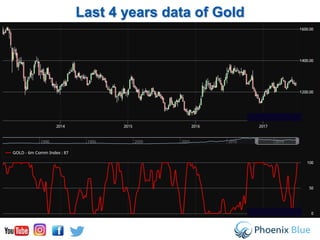
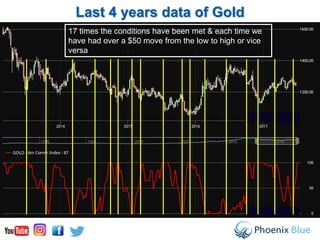
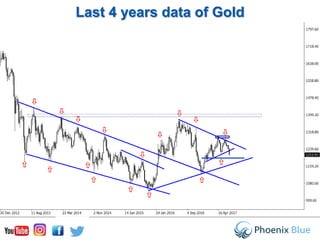
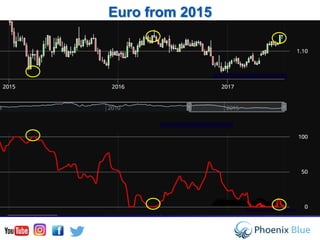
Presented by Mark Owen
Co-Founder of Phoenix Blue
An Introduction to the COT
Report
How it can be used to help
determine the end of a trend
and start of a new trend.
SHOWFX - BRATISLAVA
Intraday (short term) – Swing (mid term) – Investor
Why do I use the COT Report?
• There are a few high probability setups throughout the year
per market
• Usually this is the start of a new trend / end of a trend
• Big moves usually follow
• A clue on when to stop / slow down trading with the trend
• More free time
My philosophy about trading is I'm here to make money not to
trade. Waiting for the right conditions.
What type of Trader are you?
Why retail traders should use the COT report
Many retail traders have the illusion that the trend has gone too far and must
come back and try to sell or buy what they believe is the top or bottom of the
market.
13 months
+2400 pips
8 months
+2500 pips4 months
+1200 pips
The COT Report
Commitments of Traders
Also known as the
COT Report
What is the the COT Report
• The Commitments of traders (COT) report, provided by the
Commodity Futures Trading Commission (CFTC), is the only
true record of buying and selling activity.
• The report details every long (buy) and short (sell) position held in a
market
• The report categorises each trader as being either a Commercial,
Non-Commercial or Non-Reportable trader.
• Using this data enables us to make better informed trading decisions
by ensuring we are always trading inline with a markets supply or
demand.
The Three Groups of Traders
Commercial Trader
• Commercial (essentially a user or producer)- Describes an entity
involved in the production, processing, or merchandising of a
commodity, using futures contracts primarily for hedging. Trend
starters and enders
Non Commercial Trader
• Non-commercial (Large Speculators) - Traders, such as individual
traders, hedge funds and large institutions, who use futures market
for speculative purposes. Trend followers
Non Reportable Trader
• Non-reportable (Small speculators) – Non-reportable traders are
categorised as such because the size of the positions they hold are below
the reporting levels for that market as set by the CFTC. The long and short
positions shown as "Non-reportable Positions" is derived by subtracting the
total long and short "Reportable Positions" (commercial plus non-
commercial) from the total open interest. These traders are a mixture of
commercial or non-commercial traders but will also contain amateur traders
which is why this group rarely gives us any insight into future market
direction.
A good general rule of thumb is to do the opposite of what these traders do.
• Knowing what each group is doing will ensure you enter the market
at the right time and in the right direction
Which group should you follow?
• Today we will primarily focus our attention on the COMMERCIALS –
are they trend followers or Trend starters / enders ?
• The numbers from the COT Report we put into an Index, to make
the readings more visual and easy to see extreme conditions within
a given market place
• The next slide shows what the COT Report looks like
• The COT Report is not easy to read so we create an index
explained later
The Report – not easy to understand
What is a COT Index
• In order to consistently measure the activities of each group within any
market, we must be able to accurately compare levels of buying and selling
over past years
• A COT Index allows us to view the trading activity of a group of traders on
a relative basis so we can determine their level of bullishness or
bearishness
• An index is a percentage scale and is bounded between 0% and 100%.
0% being extremely bearish and 100% extremely bullish
• A COT Index reading of 90% and above is considered bullish, likewise a
reading of 10% and below is considered bearish. Both should be
monitored.
• We use 3 index periods 36, 18 & 6 month look back
How is the index calculated
• The index is calculated by subtracting all long contracts from shorts giving
a net position
Net position & COT Index
What causes the net position to move?
Long contracts 100,000
Short contracts 50,000
100k -50k = 50k Net position
Long contracts 110,000
Short contracts 50,000
110k - 50k = 60k Net position
Long contracts 100,000
Short contracts 40,000
100k - 40k = 60k Net position
Comms Net Position
Comms Net Position
Shorts decrease by 10k
Comms Net Position
Longs increase by 10k
Same reading very different circumstance
Which COT index do I use 36,18 or 6 month?
There are all 3 index’s on this chart of Gold. The Natural supply and
demand cycles will determine which index you use.
How the Commercials conduct
their business in the market
Commercials in more detail
Producer = Farmer
$ SUGAR
Farmer sells less –
why?
Create DEMAND
Comms Non Comms
Speculator = Fund
$ SUGAR
Fund sells more –
why?
Trend Follower
Commercials in more detail
Producer = Farmer
$ SUGAR
Farmer sells more
– why?
Makes more
money – gets a
point when the
market is over
supplied!!
Comms Non Comms
Speculator = Fund
$ SUGAR
Fund buys more –
why?
Trend Follower
COT Index Cycle
Comm. Index 100%
Comm. Index 0%
What is a COT Index
• The index is calculated by subtracting all long contracts from shorts giving
a net position Comm. Index 100%
Comm. Index 0%
What is a COT Index
• The index is calculated by subtracting all long contracts from shorts giving
a net position Comm. Index 100%
Comm. Index 0%
Lets take a look at the Commercials Index
AUD Declines
The Index Rallies
AUD Rallies
The index Declines
Look at the Index
when it reaches the
sell zone (10 – 0%)
and when it
reaches the buy
zone (90 – 100%).
AUSTRALIAN DOLLAR FUTURES CHART
This time in British Pound 18 month
Time to look at a few current live
setups
Current chart of NZD
Last 4 years data of Gold
17 times the conditions have been met & each time we
have had over a $50 move from the low to high or vice
versa
Last 4 years data of Gold
Euro from 2015
Euro from 2015
The COT Report
This style of trading can blend into anyone's lifestyle:
• Full time employment
• Family man
• House wife
• Student
Time cannot be an excuse when your data is delivered once a
week. If the conditions aren’t right you don’t explore the technicals.
Thank you for listening
4 Hr
mark@phoenixblue.co.uk

Mark owen

  • 1.
    Presented by MarkOwen Co-Founder of Phoenix Blue An Introduction to the COT Report How it can be used to help determine the end of a trend and start of a new trend. SHOWFX - BRATISLAVA
  • 2.
    Intraday (short term)– Swing (mid term) – Investor Why do I use the COT Report? • There are a few high probability setups throughout the year per market • Usually this is the start of a new trend / end of a trend • Big moves usually follow • A clue on when to stop / slow down trading with the trend • More free time My philosophy about trading is I'm here to make money not to trade. Waiting for the right conditions. What type of Trader are you?
  • 3.
    Why retail tradersshould use the COT report Many retail traders have the illusion that the trend has gone too far and must come back and try to sell or buy what they believe is the top or bottom of the market. 13 months +2400 pips 8 months +2500 pips4 months +1200 pips
  • 4.
    The COT Report Commitmentsof Traders Also known as the COT Report
  • 5.
    What is thethe COT Report • The Commitments of traders (COT) report, provided by the Commodity Futures Trading Commission (CFTC), is the only true record of buying and selling activity. • The report details every long (buy) and short (sell) position held in a market • The report categorises each trader as being either a Commercial, Non-Commercial or Non-Reportable trader. • Using this data enables us to make better informed trading decisions by ensuring we are always trading inline with a markets supply or demand.
  • 6.
    The Three Groupsof Traders
  • 7.
    Commercial Trader • Commercial(essentially a user or producer)- Describes an entity involved in the production, processing, or merchandising of a commodity, using futures contracts primarily for hedging. Trend starters and enders
  • 8.
    Non Commercial Trader •Non-commercial (Large Speculators) - Traders, such as individual traders, hedge funds and large institutions, who use futures market for speculative purposes. Trend followers
  • 9.
    Non Reportable Trader •Non-reportable (Small speculators) – Non-reportable traders are categorised as such because the size of the positions they hold are below the reporting levels for that market as set by the CFTC. The long and short positions shown as "Non-reportable Positions" is derived by subtracting the total long and short "Reportable Positions" (commercial plus non- commercial) from the total open interest. These traders are a mixture of commercial or non-commercial traders but will also contain amateur traders which is why this group rarely gives us any insight into future market direction. A good general rule of thumb is to do the opposite of what these traders do. • Knowing what each group is doing will ensure you enter the market at the right time and in the right direction
  • 10.
    Which group shouldyou follow? • Today we will primarily focus our attention on the COMMERCIALS – are they trend followers or Trend starters / enders ? • The numbers from the COT Report we put into an Index, to make the readings more visual and easy to see extreme conditions within a given market place • The next slide shows what the COT Report looks like • The COT Report is not easy to read so we create an index explained later
  • 11.
    The Report –not easy to understand
  • 12.
    What is aCOT Index • In order to consistently measure the activities of each group within any market, we must be able to accurately compare levels of buying and selling over past years • A COT Index allows us to view the trading activity of a group of traders on a relative basis so we can determine their level of bullishness or bearishness • An index is a percentage scale and is bounded between 0% and 100%. 0% being extremely bearish and 100% extremely bullish • A COT Index reading of 90% and above is considered bullish, likewise a reading of 10% and below is considered bearish. Both should be monitored. • We use 3 index periods 36, 18 & 6 month look back
  • 13.
    How is theindex calculated • The index is calculated by subtracting all long contracts from shorts giving a net position
  • 14.
    Net position &COT Index
  • 15.
    What causes thenet position to move? Long contracts 100,000 Short contracts 50,000 100k -50k = 50k Net position Long contracts 110,000 Short contracts 50,000 110k - 50k = 60k Net position Long contracts 100,000 Short contracts 40,000 100k - 40k = 60k Net position Comms Net Position Comms Net Position Shorts decrease by 10k Comms Net Position Longs increase by 10k Same reading very different circumstance
  • 16.
    Which COT indexdo I use 36,18 or 6 month? There are all 3 index’s on this chart of Gold. The Natural supply and demand cycles will determine which index you use.
  • 17.
    How the Commercialsconduct their business in the market
  • 18.
    Commercials in moredetail Producer = Farmer $ SUGAR Farmer sells less – why? Create DEMAND Comms Non Comms Speculator = Fund $ SUGAR Fund sells more – why? Trend Follower
  • 19.
    Commercials in moredetail Producer = Farmer $ SUGAR Farmer sells more – why? Makes more money – gets a point when the market is over supplied!! Comms Non Comms Speculator = Fund $ SUGAR Fund buys more – why? Trend Follower
  • 20.
    COT Index Cycle Comm.Index 100% Comm. Index 0%
  • 21.
    What is aCOT Index • The index is calculated by subtracting all long contracts from shorts giving a net position Comm. Index 100% Comm. Index 0%
  • 22.
    What is aCOT Index • The index is calculated by subtracting all long contracts from shorts giving a net position Comm. Index 100% Comm. Index 0%
  • 23.
    Lets take alook at the Commercials Index AUD Declines The Index Rallies AUD Rallies The index Declines Look at the Index when it reaches the sell zone (10 – 0%) and when it reaches the buy zone (90 – 100%). AUSTRALIAN DOLLAR FUTURES CHART
  • 24.
    This time inBritish Pound 18 month
  • 25.
    Time to lookat a few current live setups
  • 26.
  • 27.
  • 28.
    Last 4 yearsdata of Gold
  • 29.
    Last 4 yearsdata of Gold 17 times the conditions have been met & each time we have had over a $50 move from the low to high or vice versa
  • 30.
    Last 4 yearsdata of Gold
  • 31.
  • 32.
  • 33.
    The COT Report Thisstyle of trading can blend into anyone's lifestyle: • Full time employment • Family man • House wife • Student Time cannot be an excuse when your data is delivered once a week. If the conditions aren’t right you don’t explore the technicals.
  • 34.
    Thank you forlistening 4 Hr mark@phoenixblue.co.uk