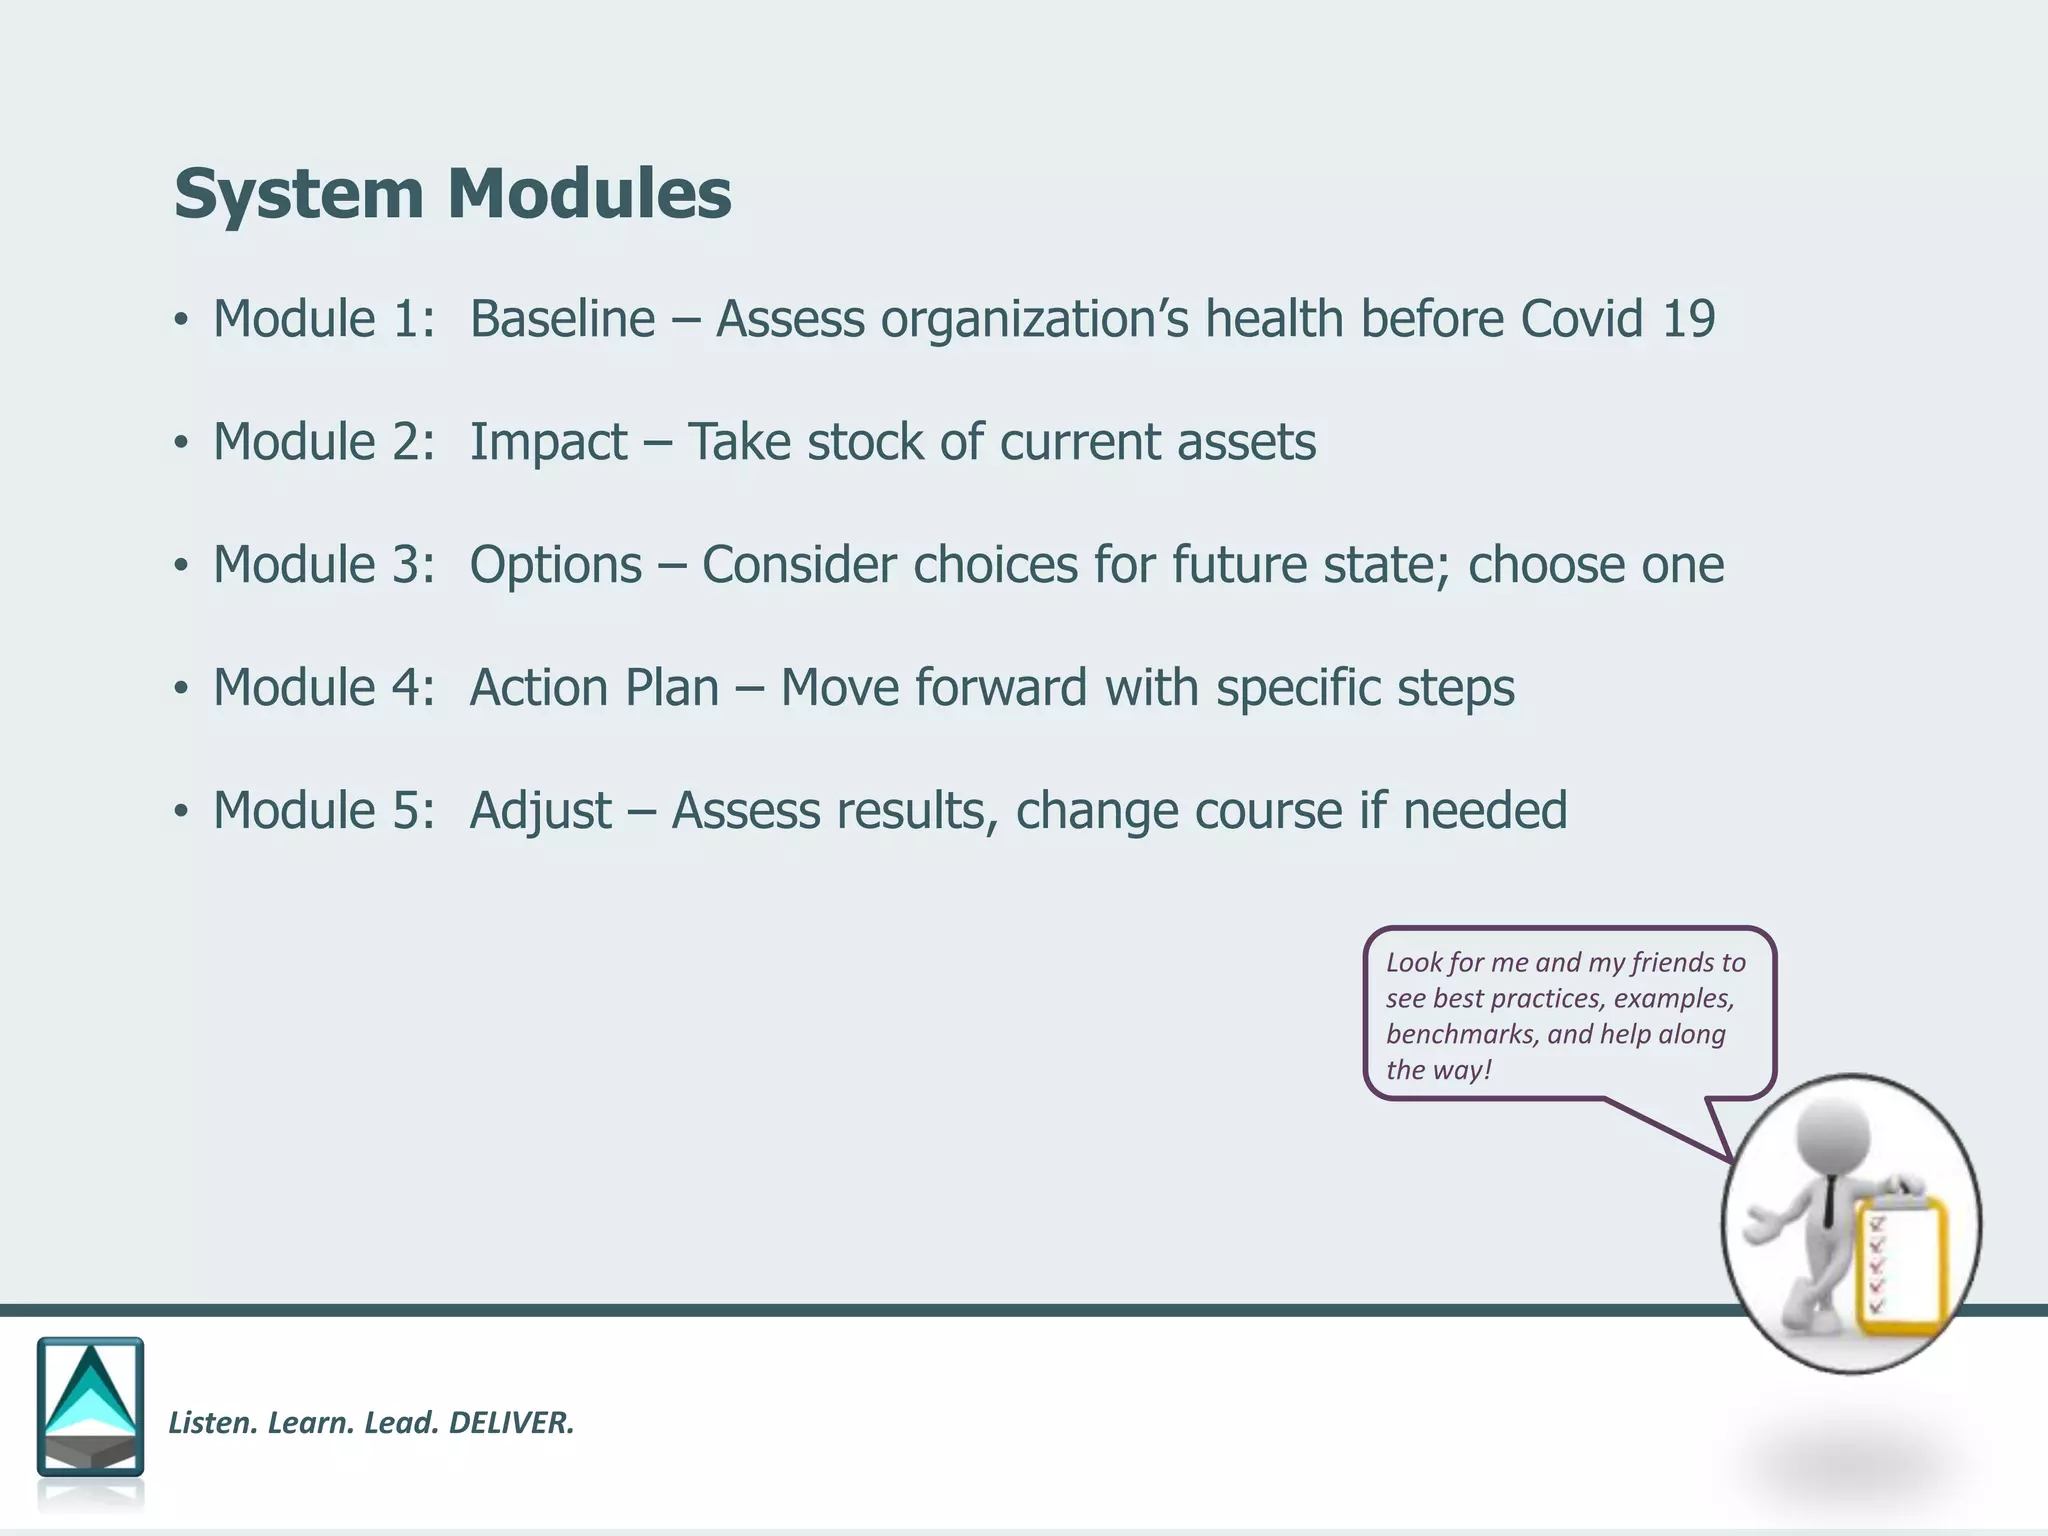
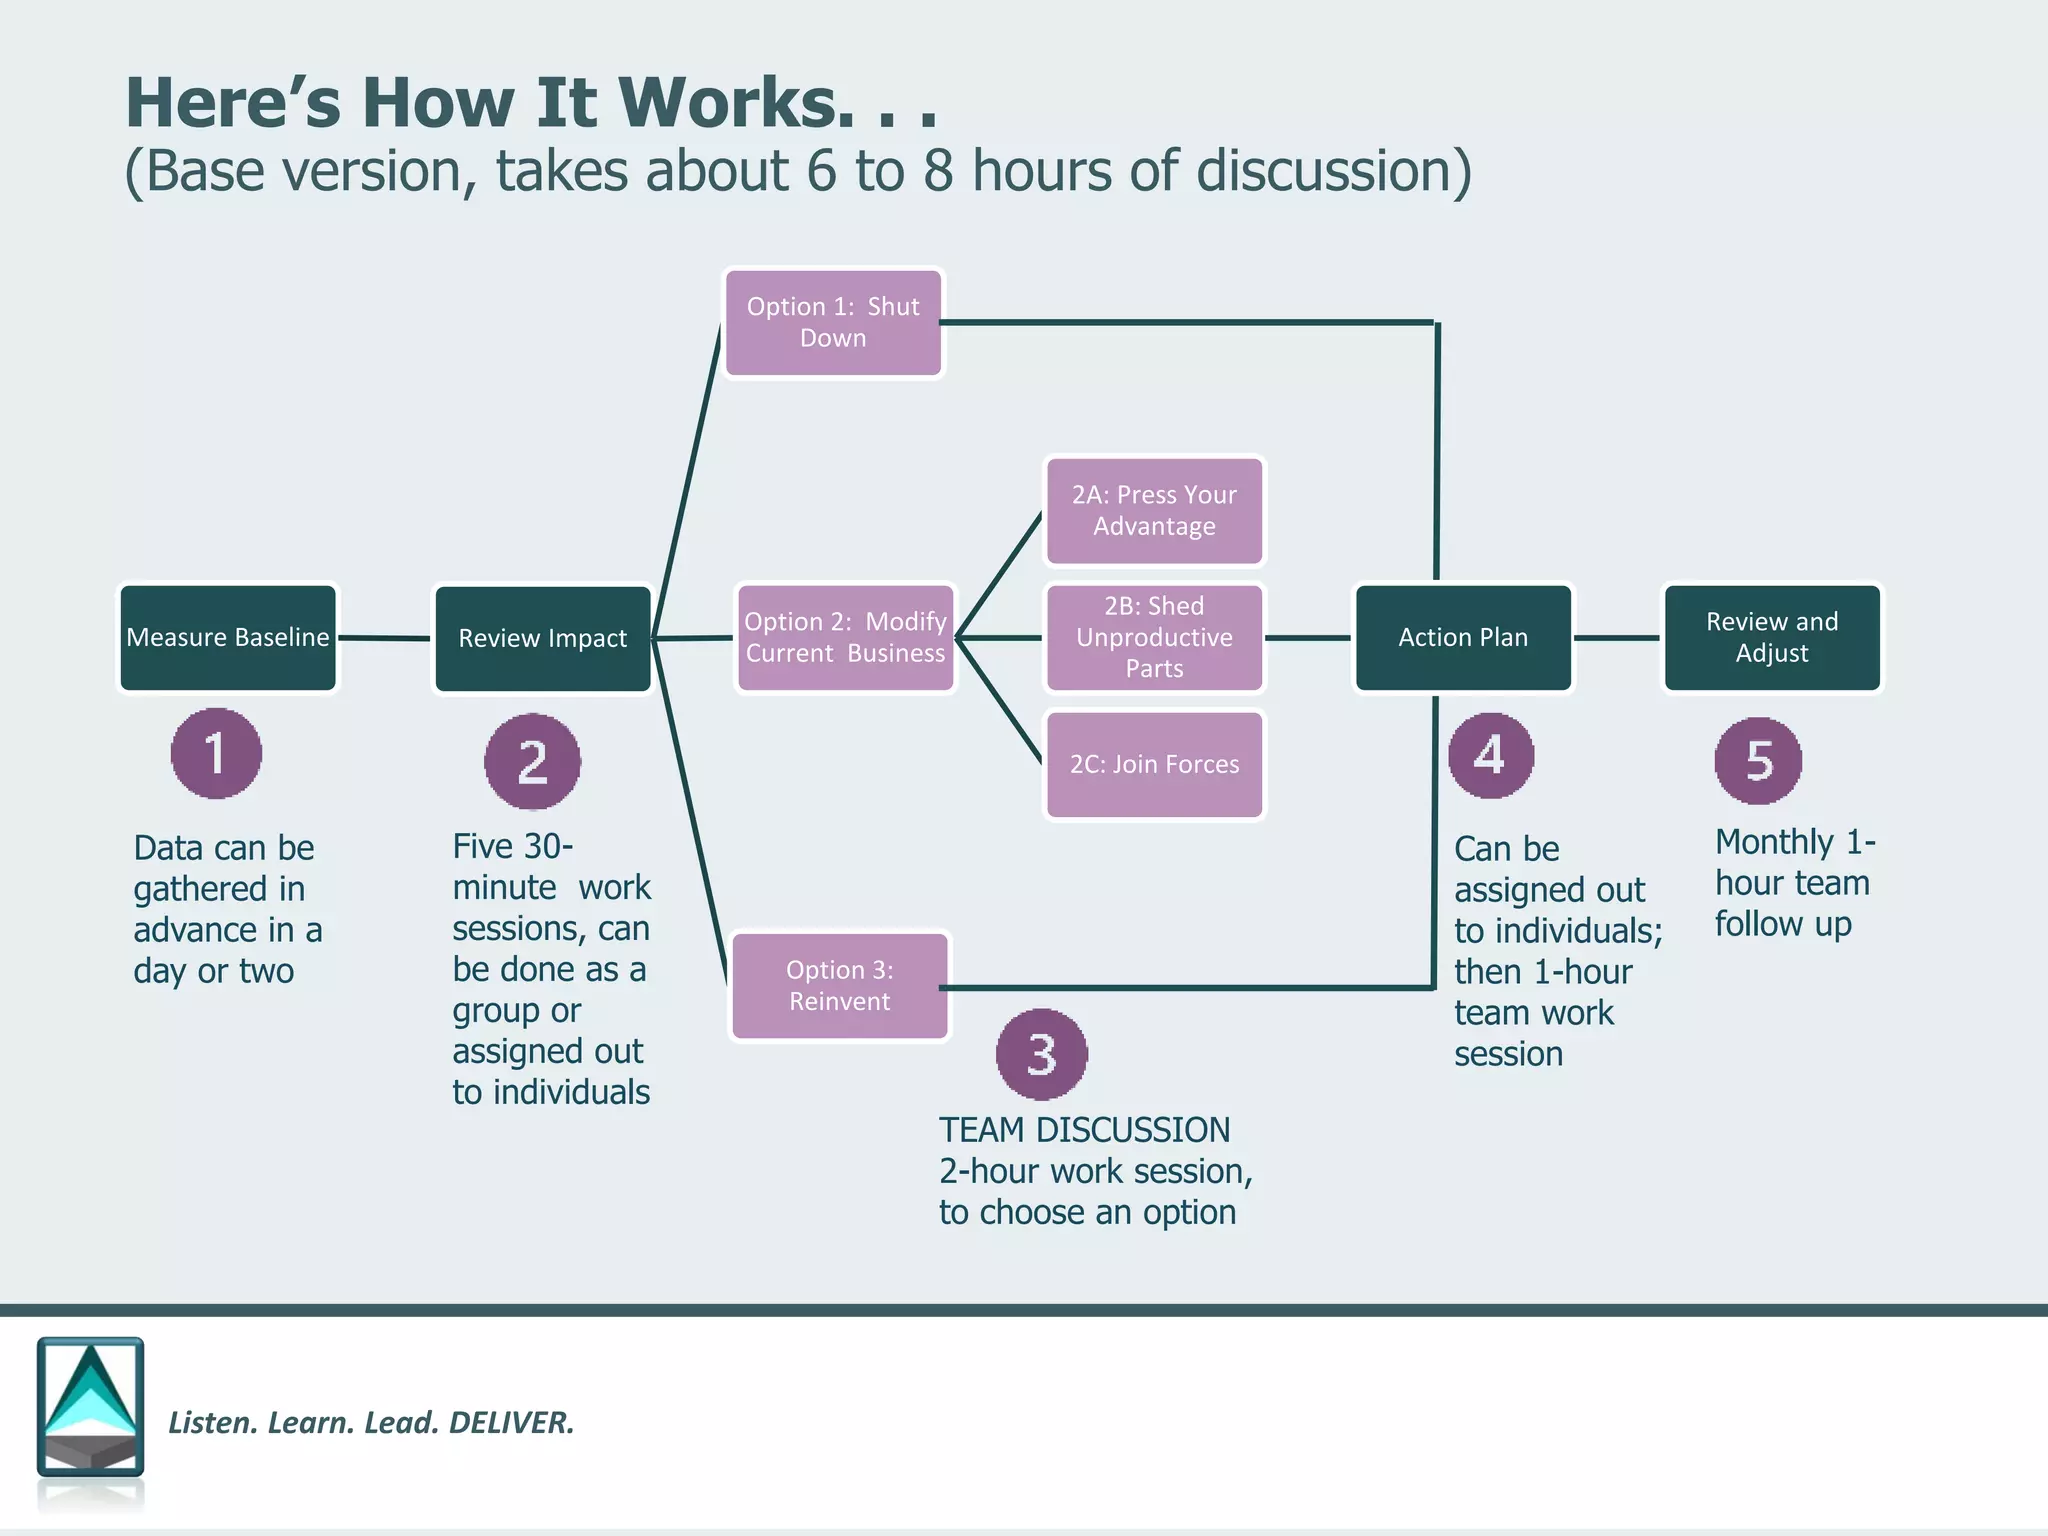
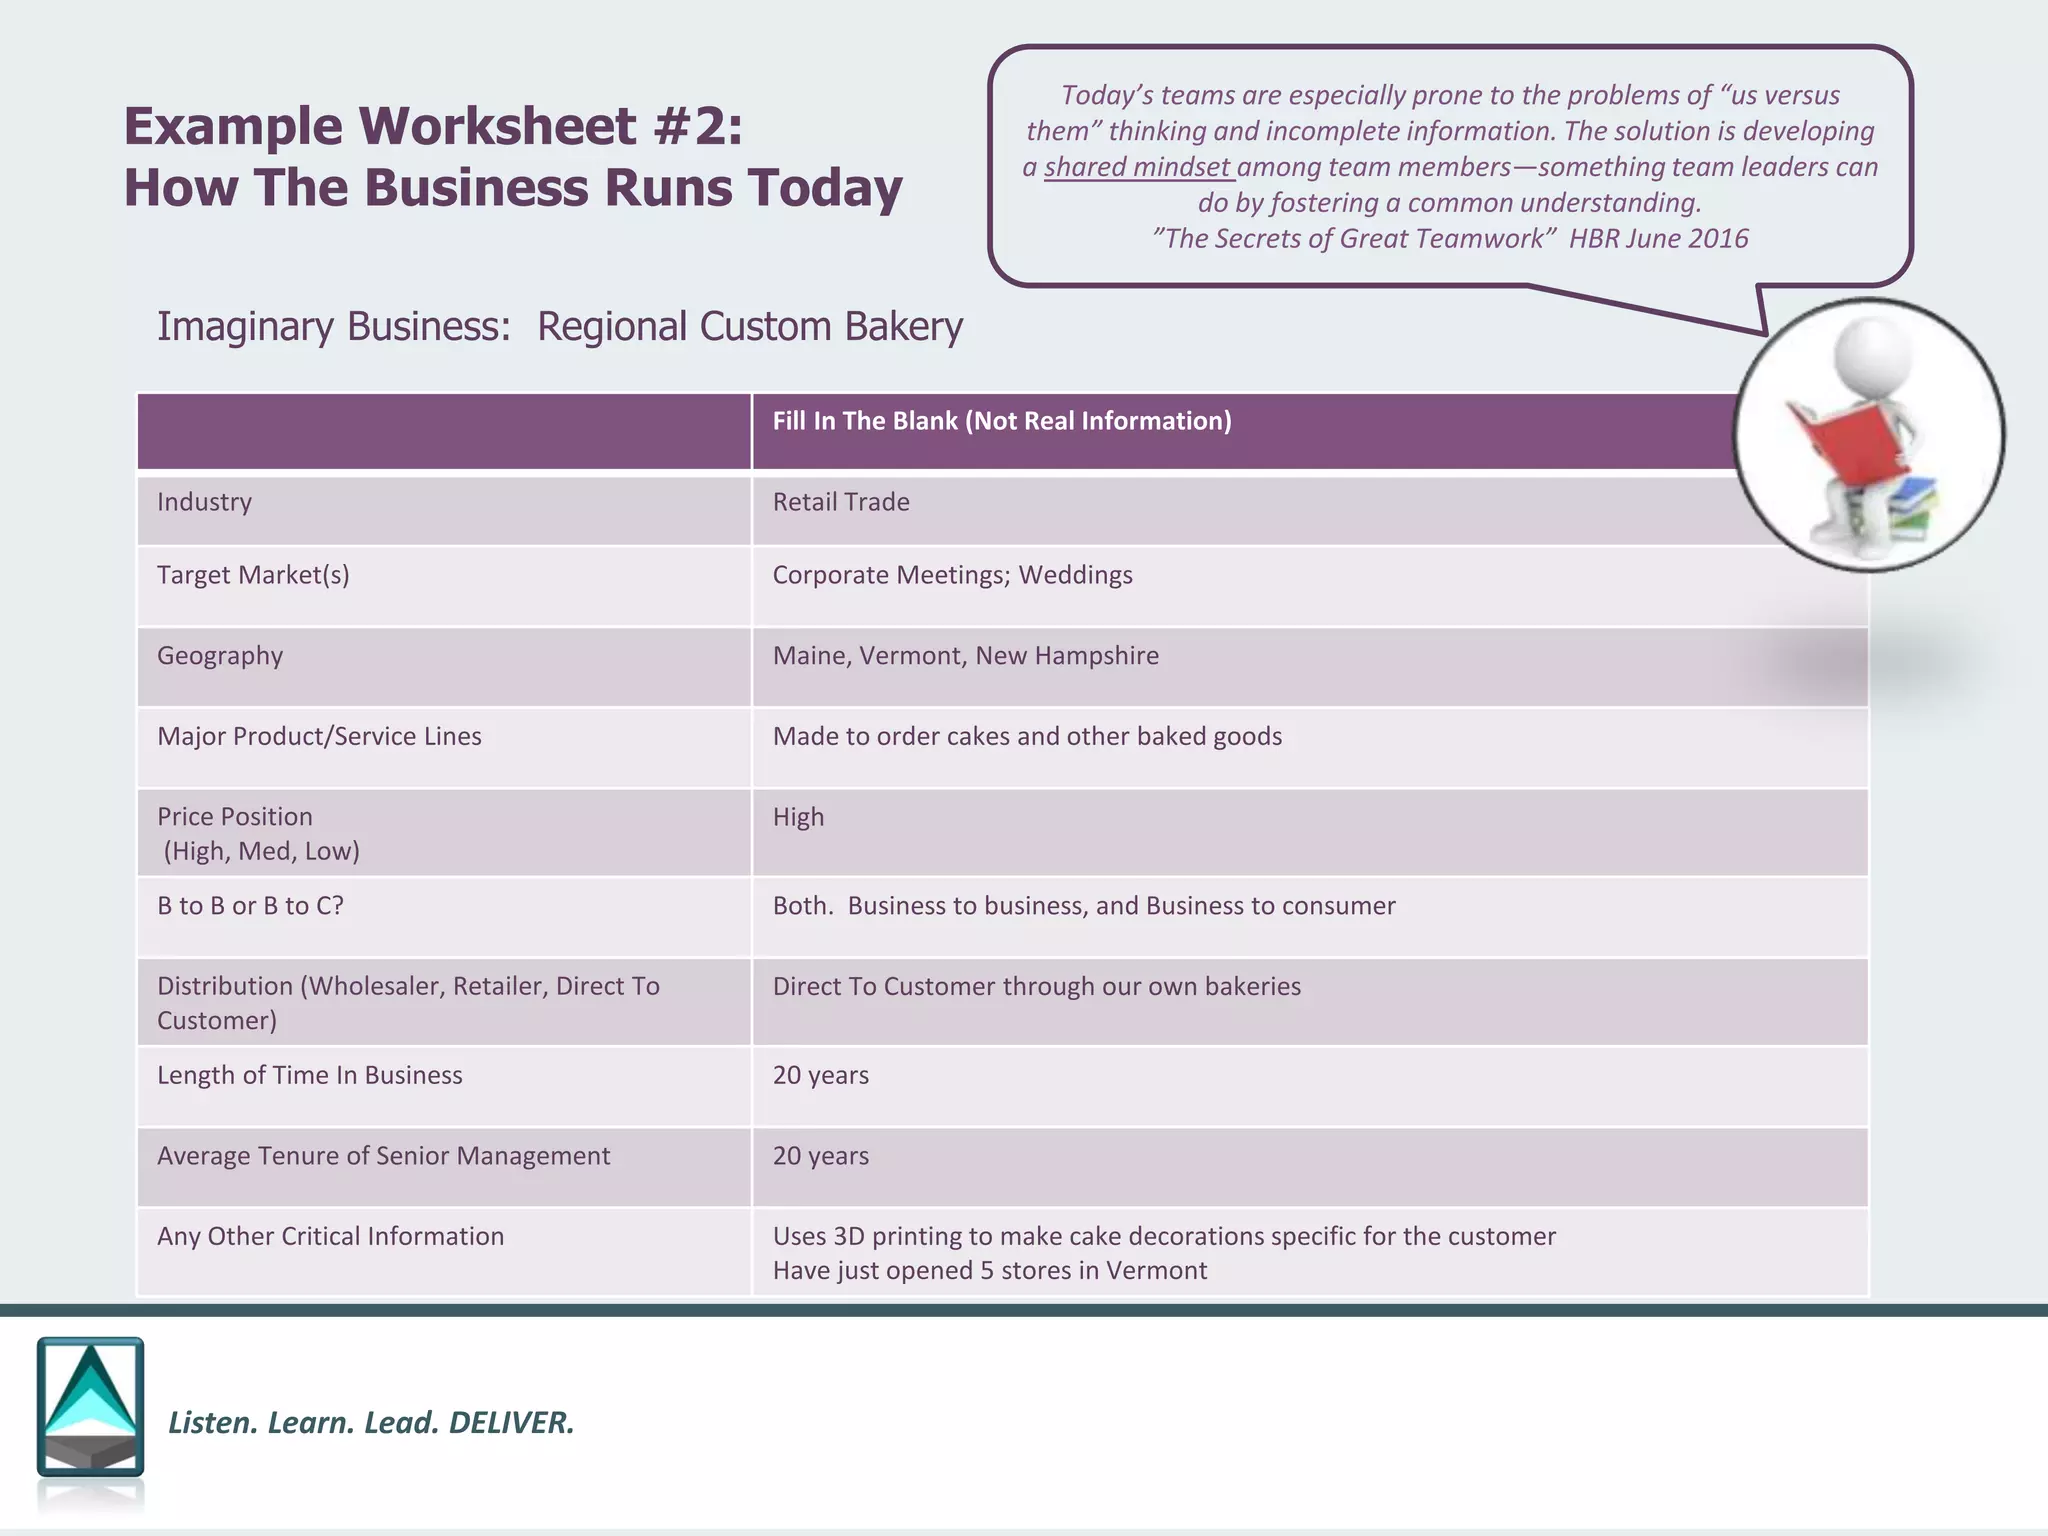
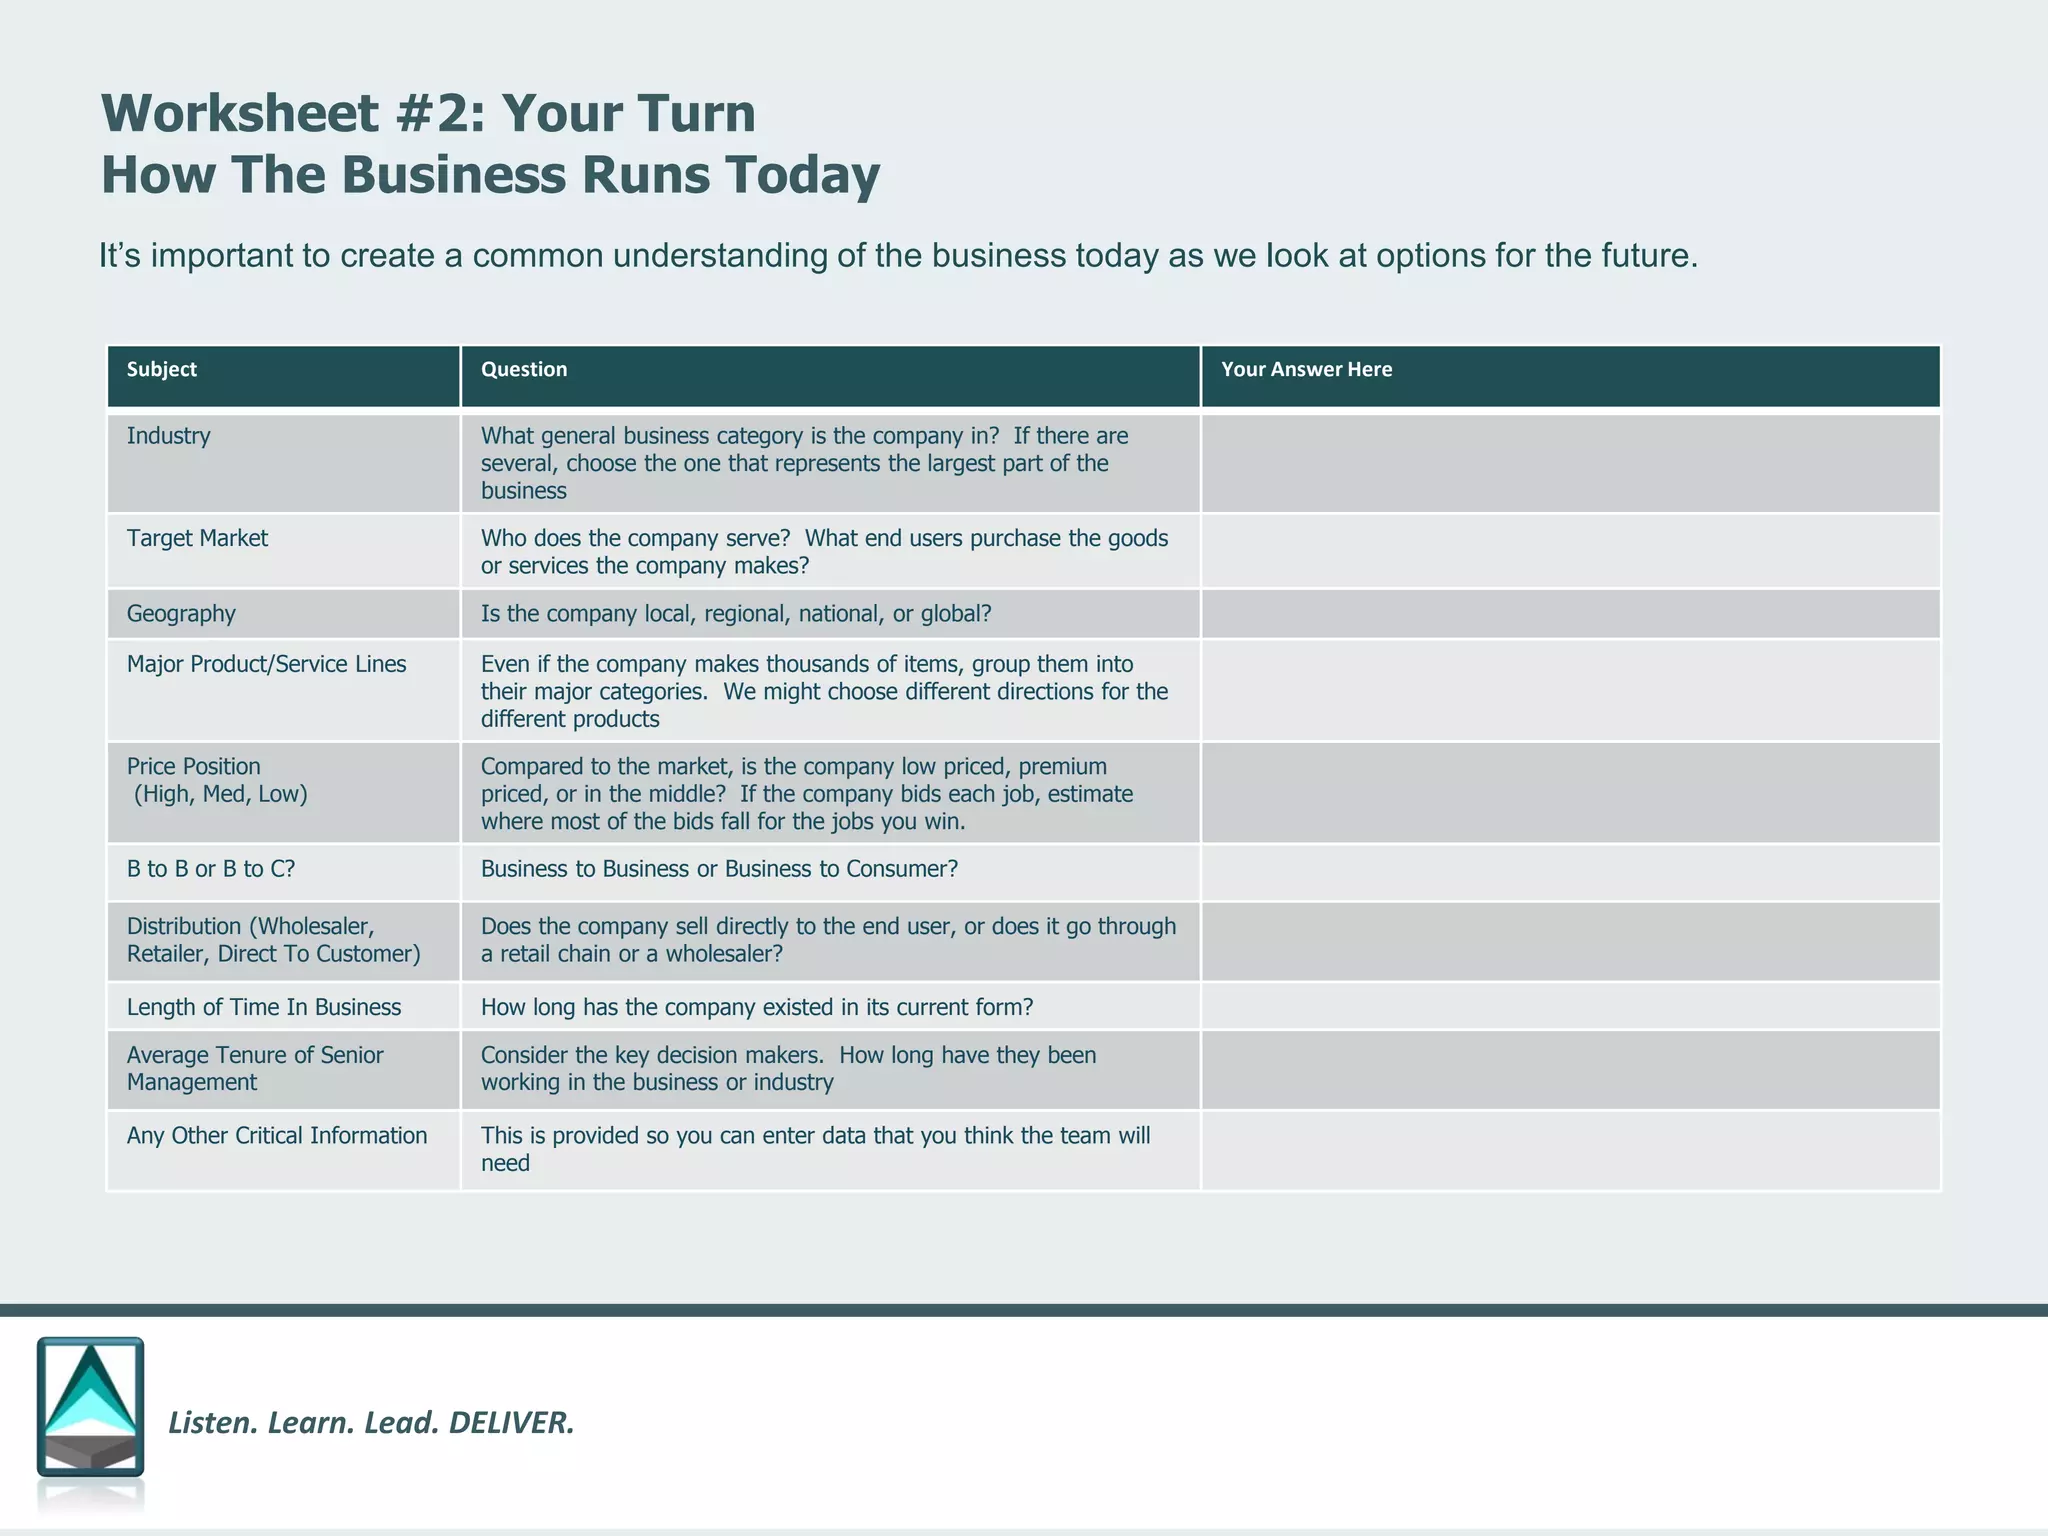
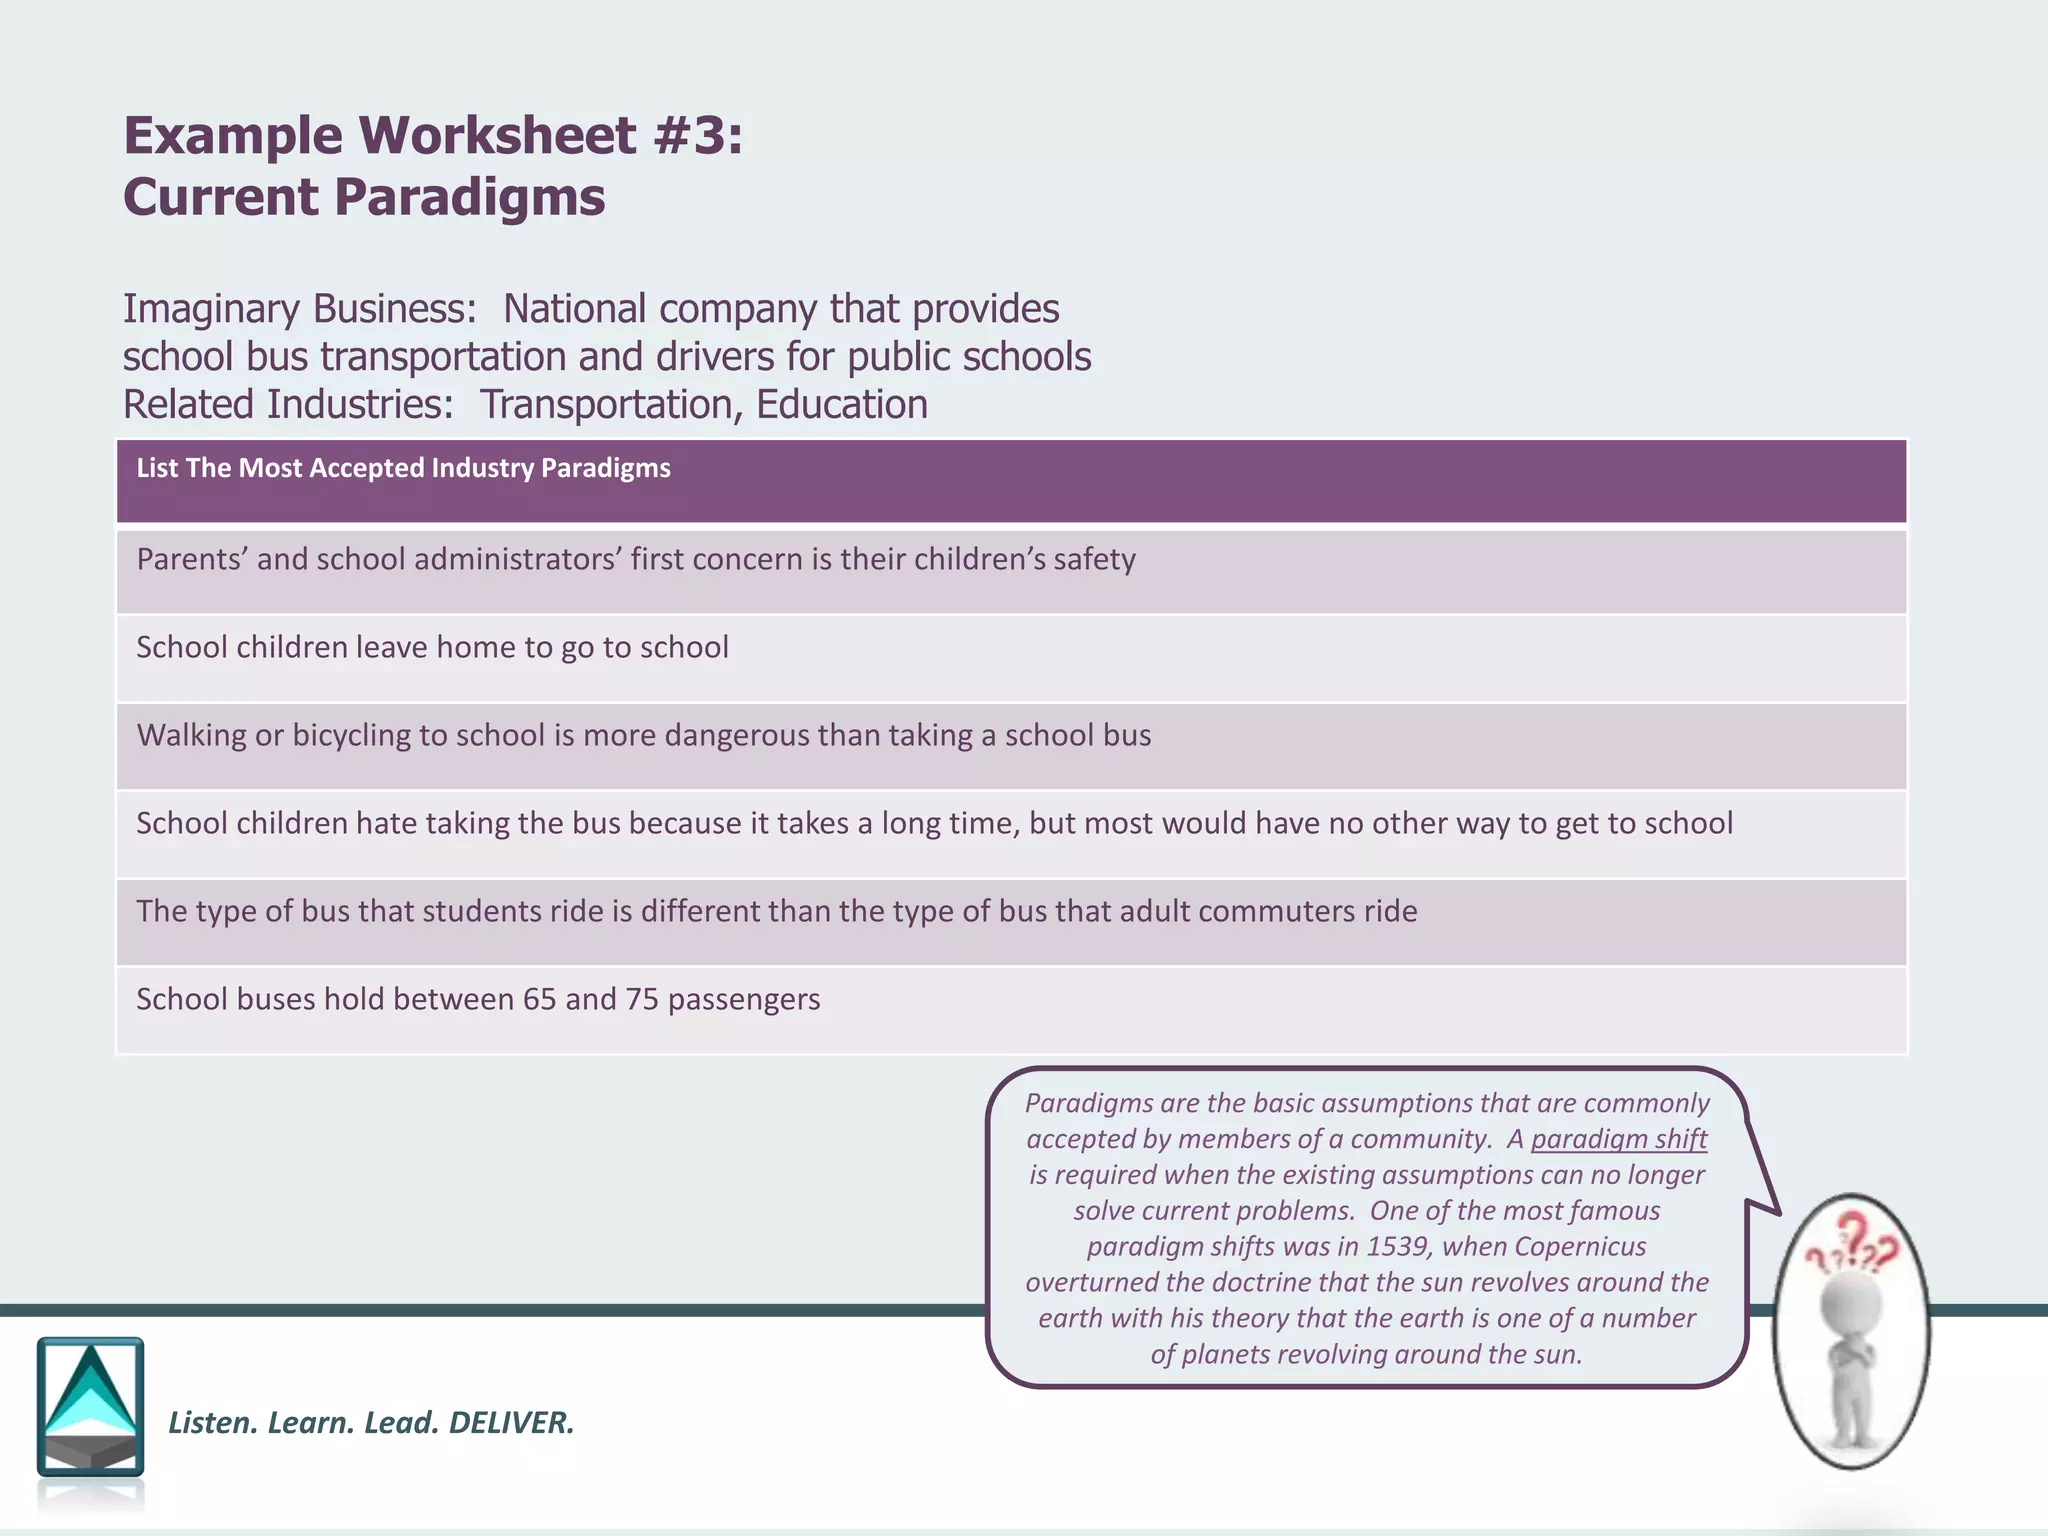
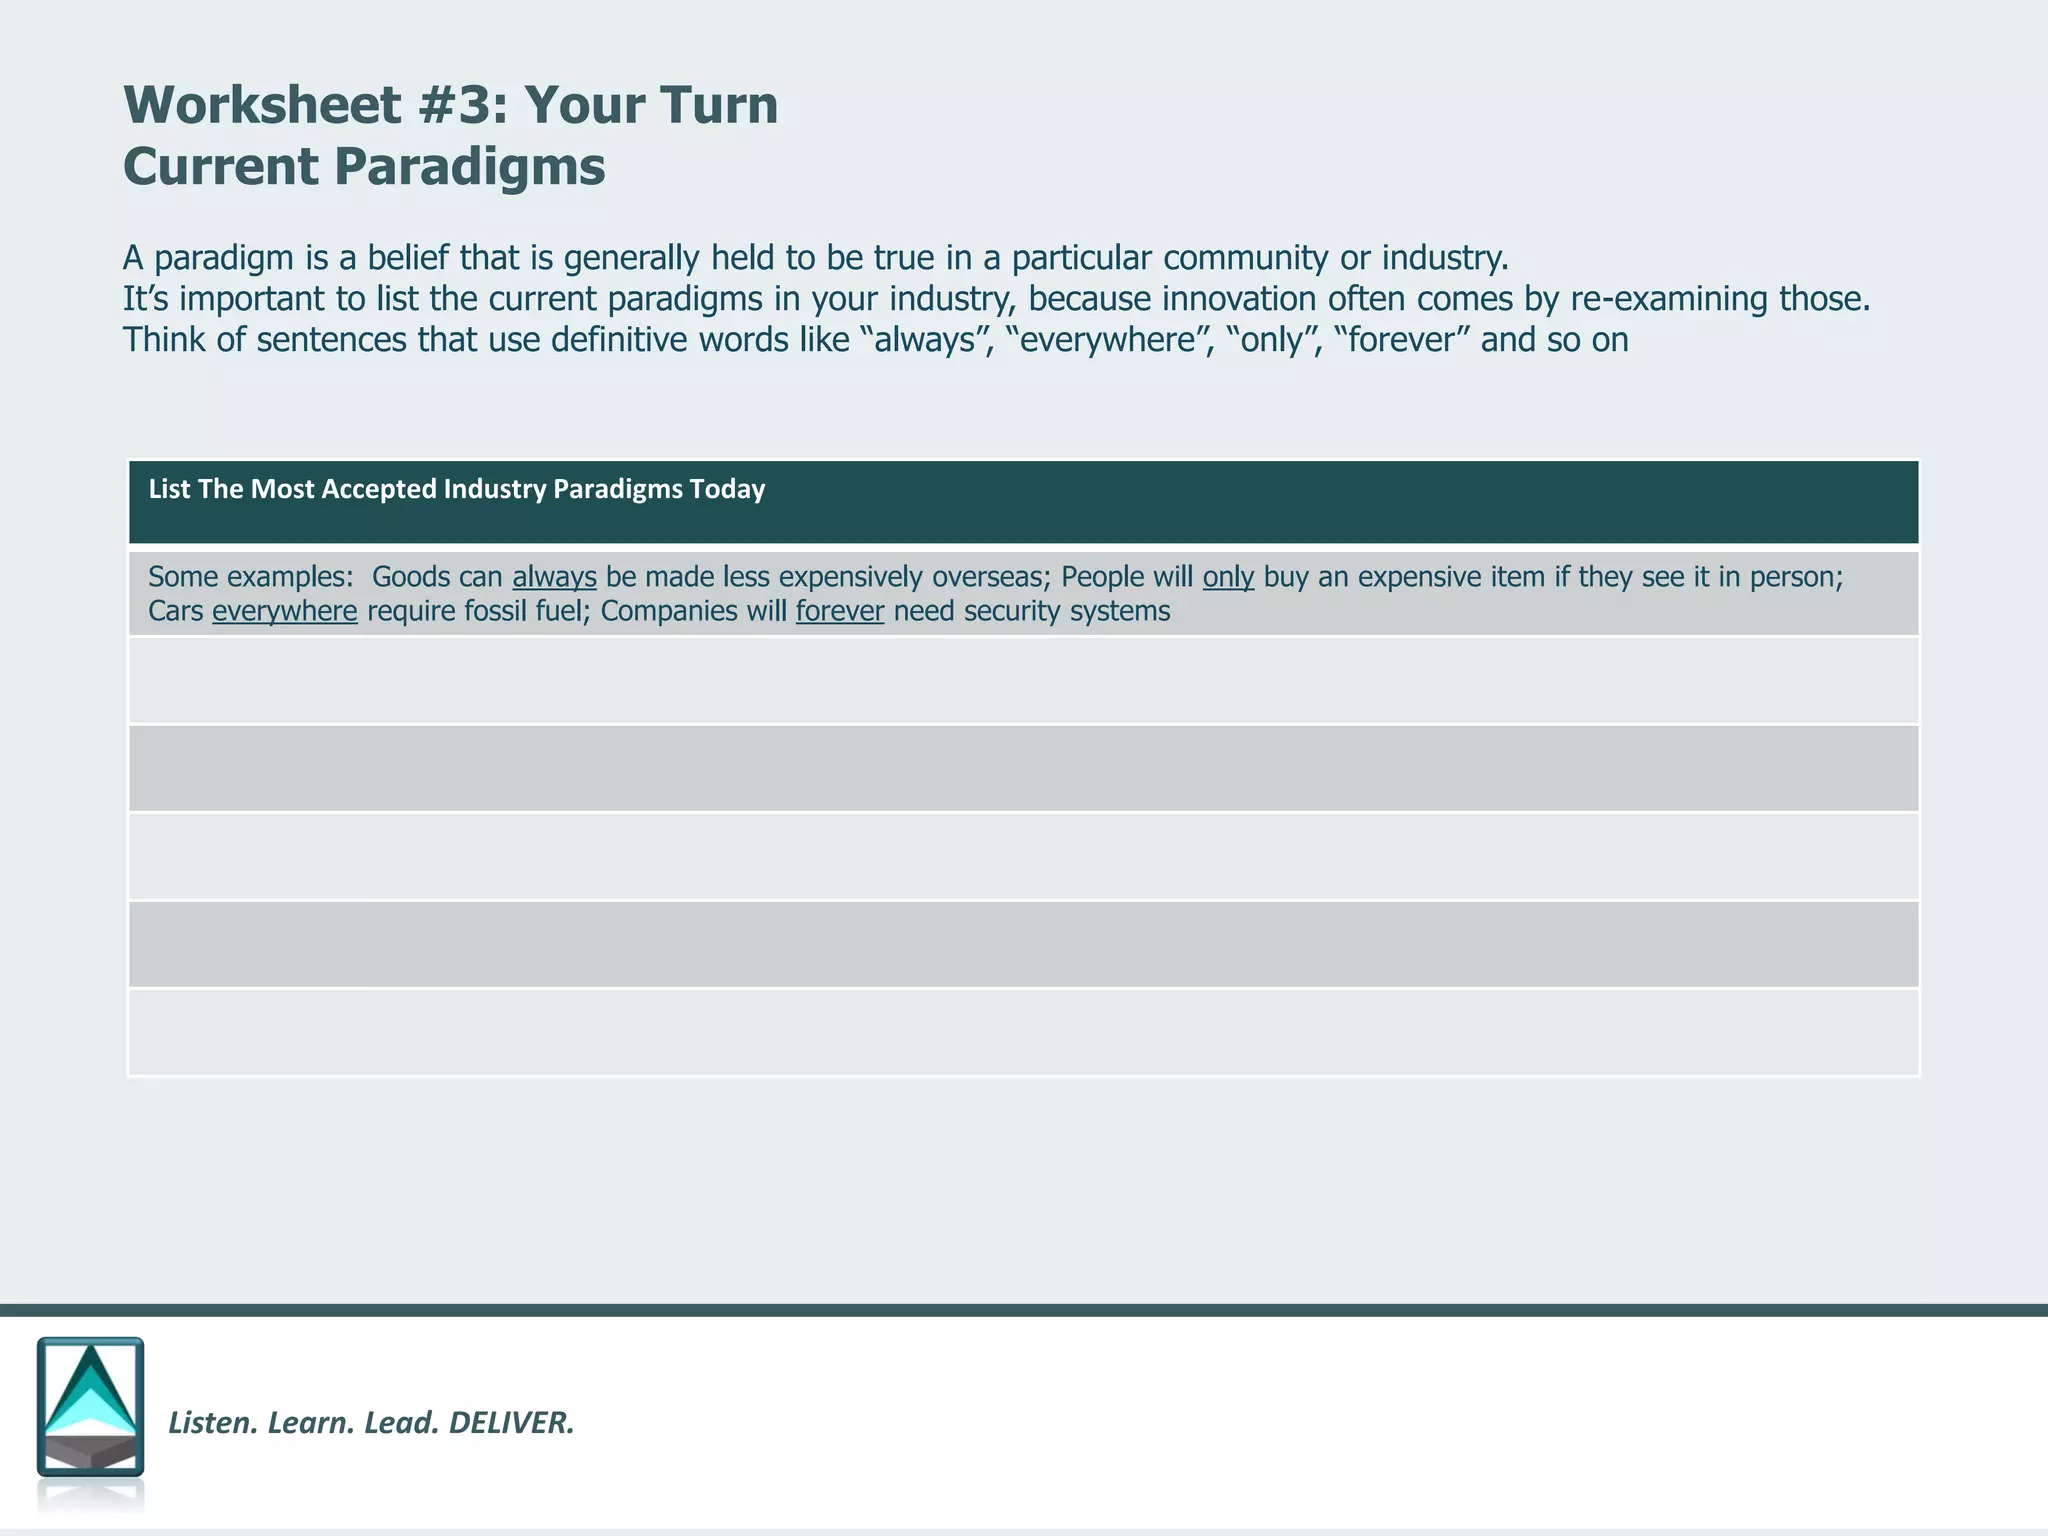
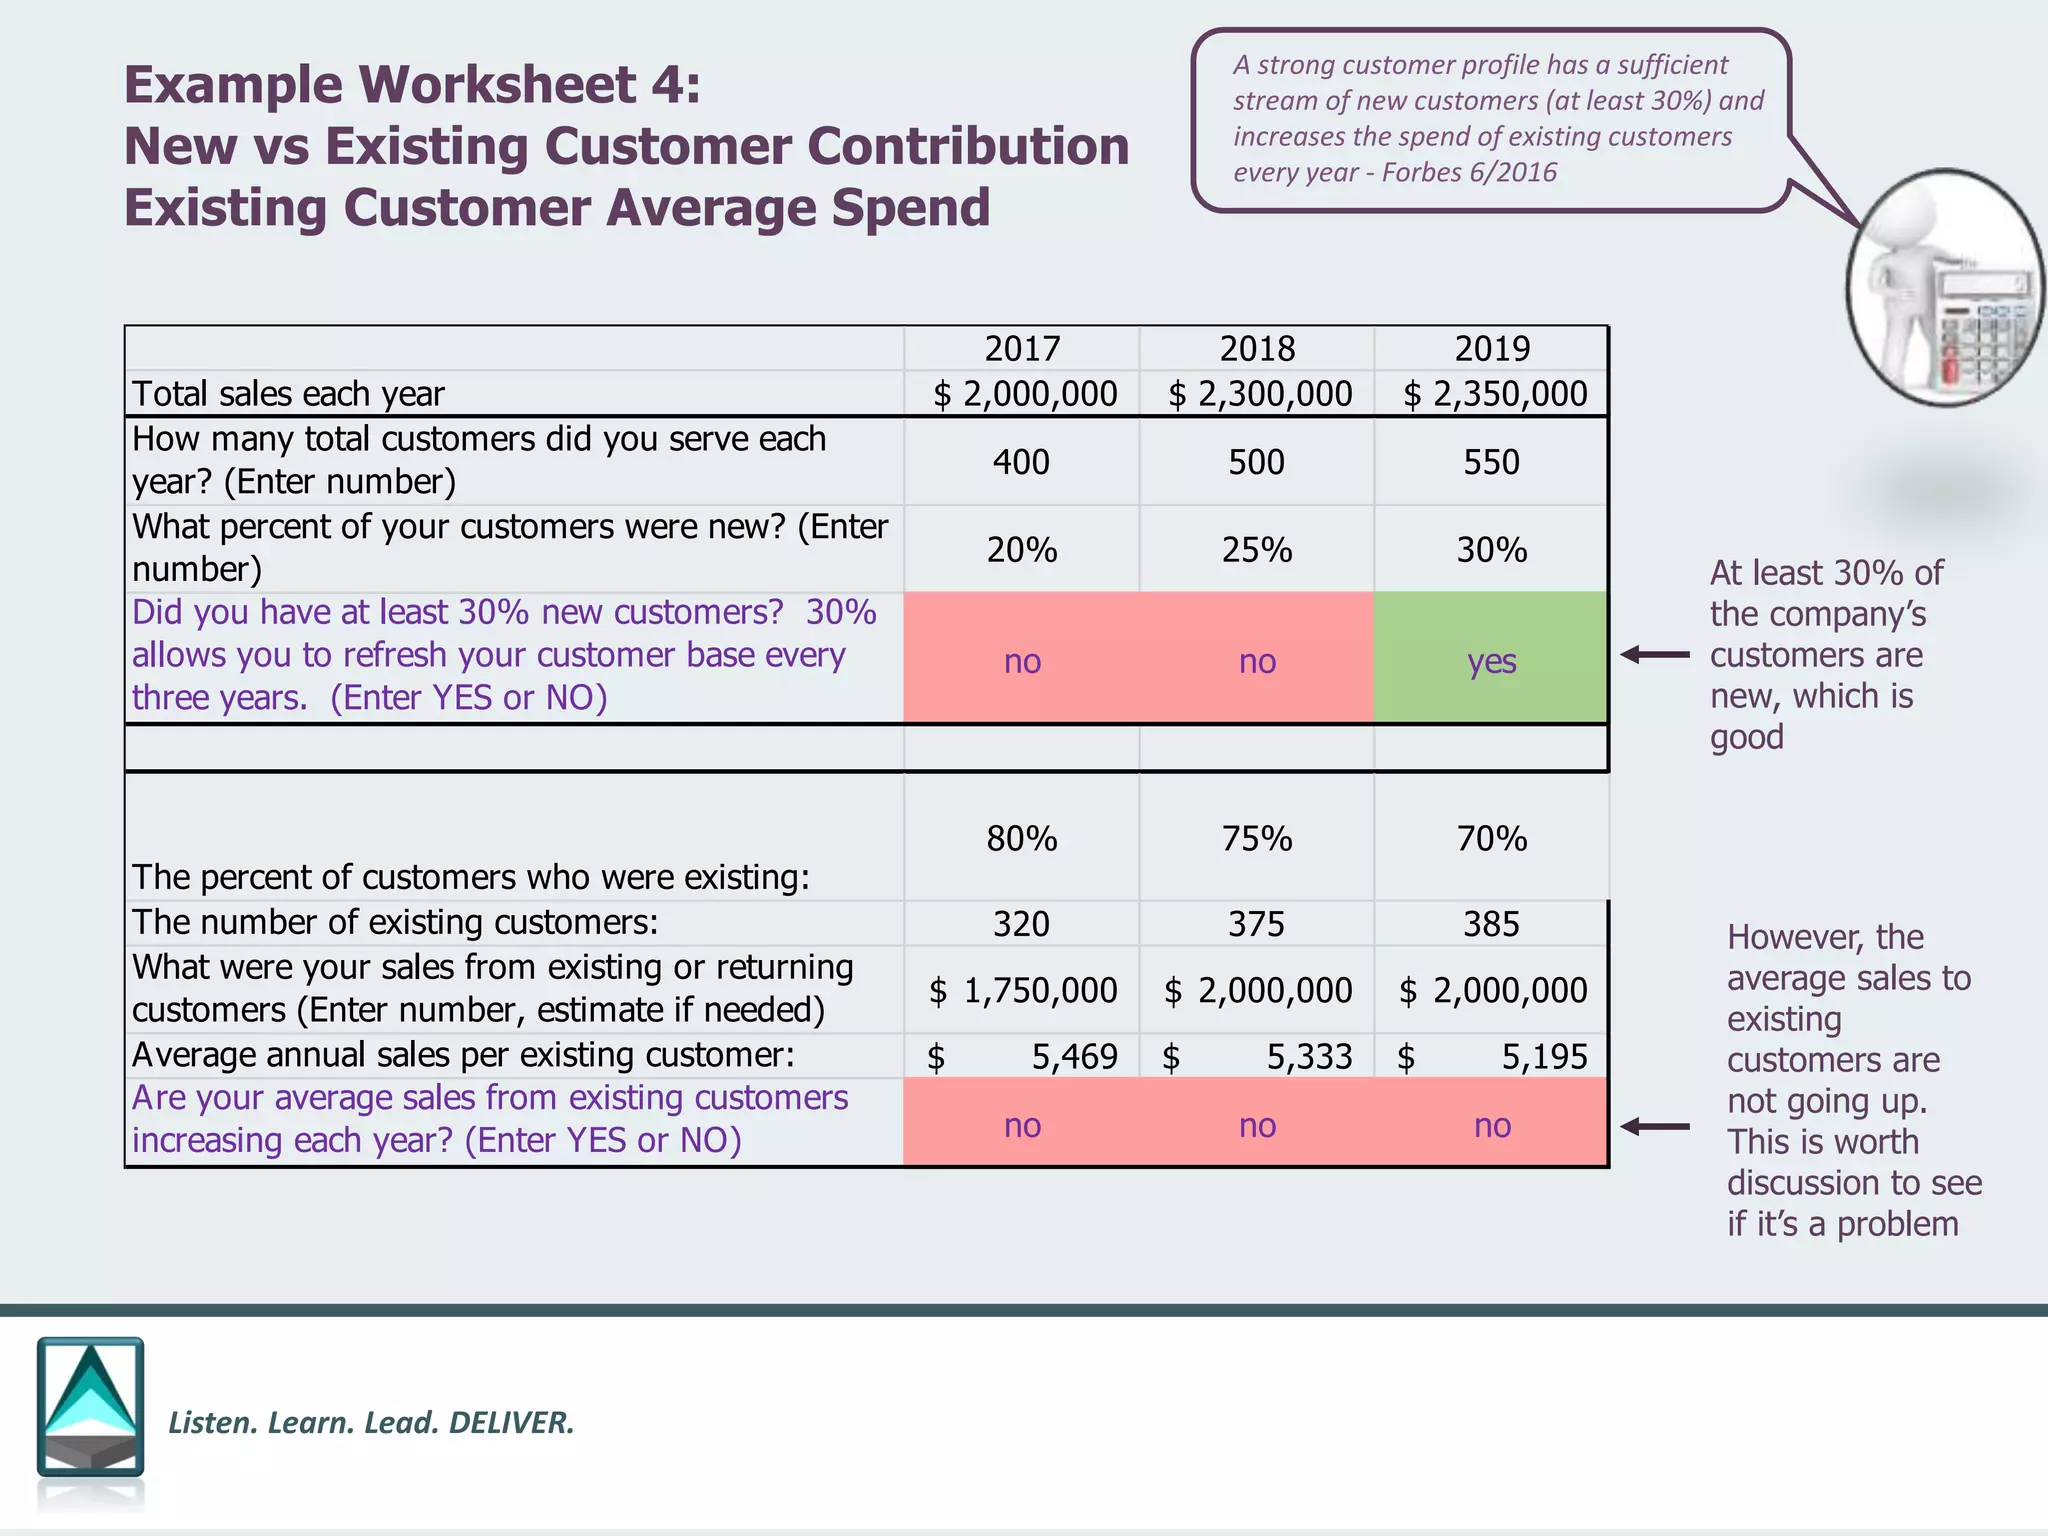
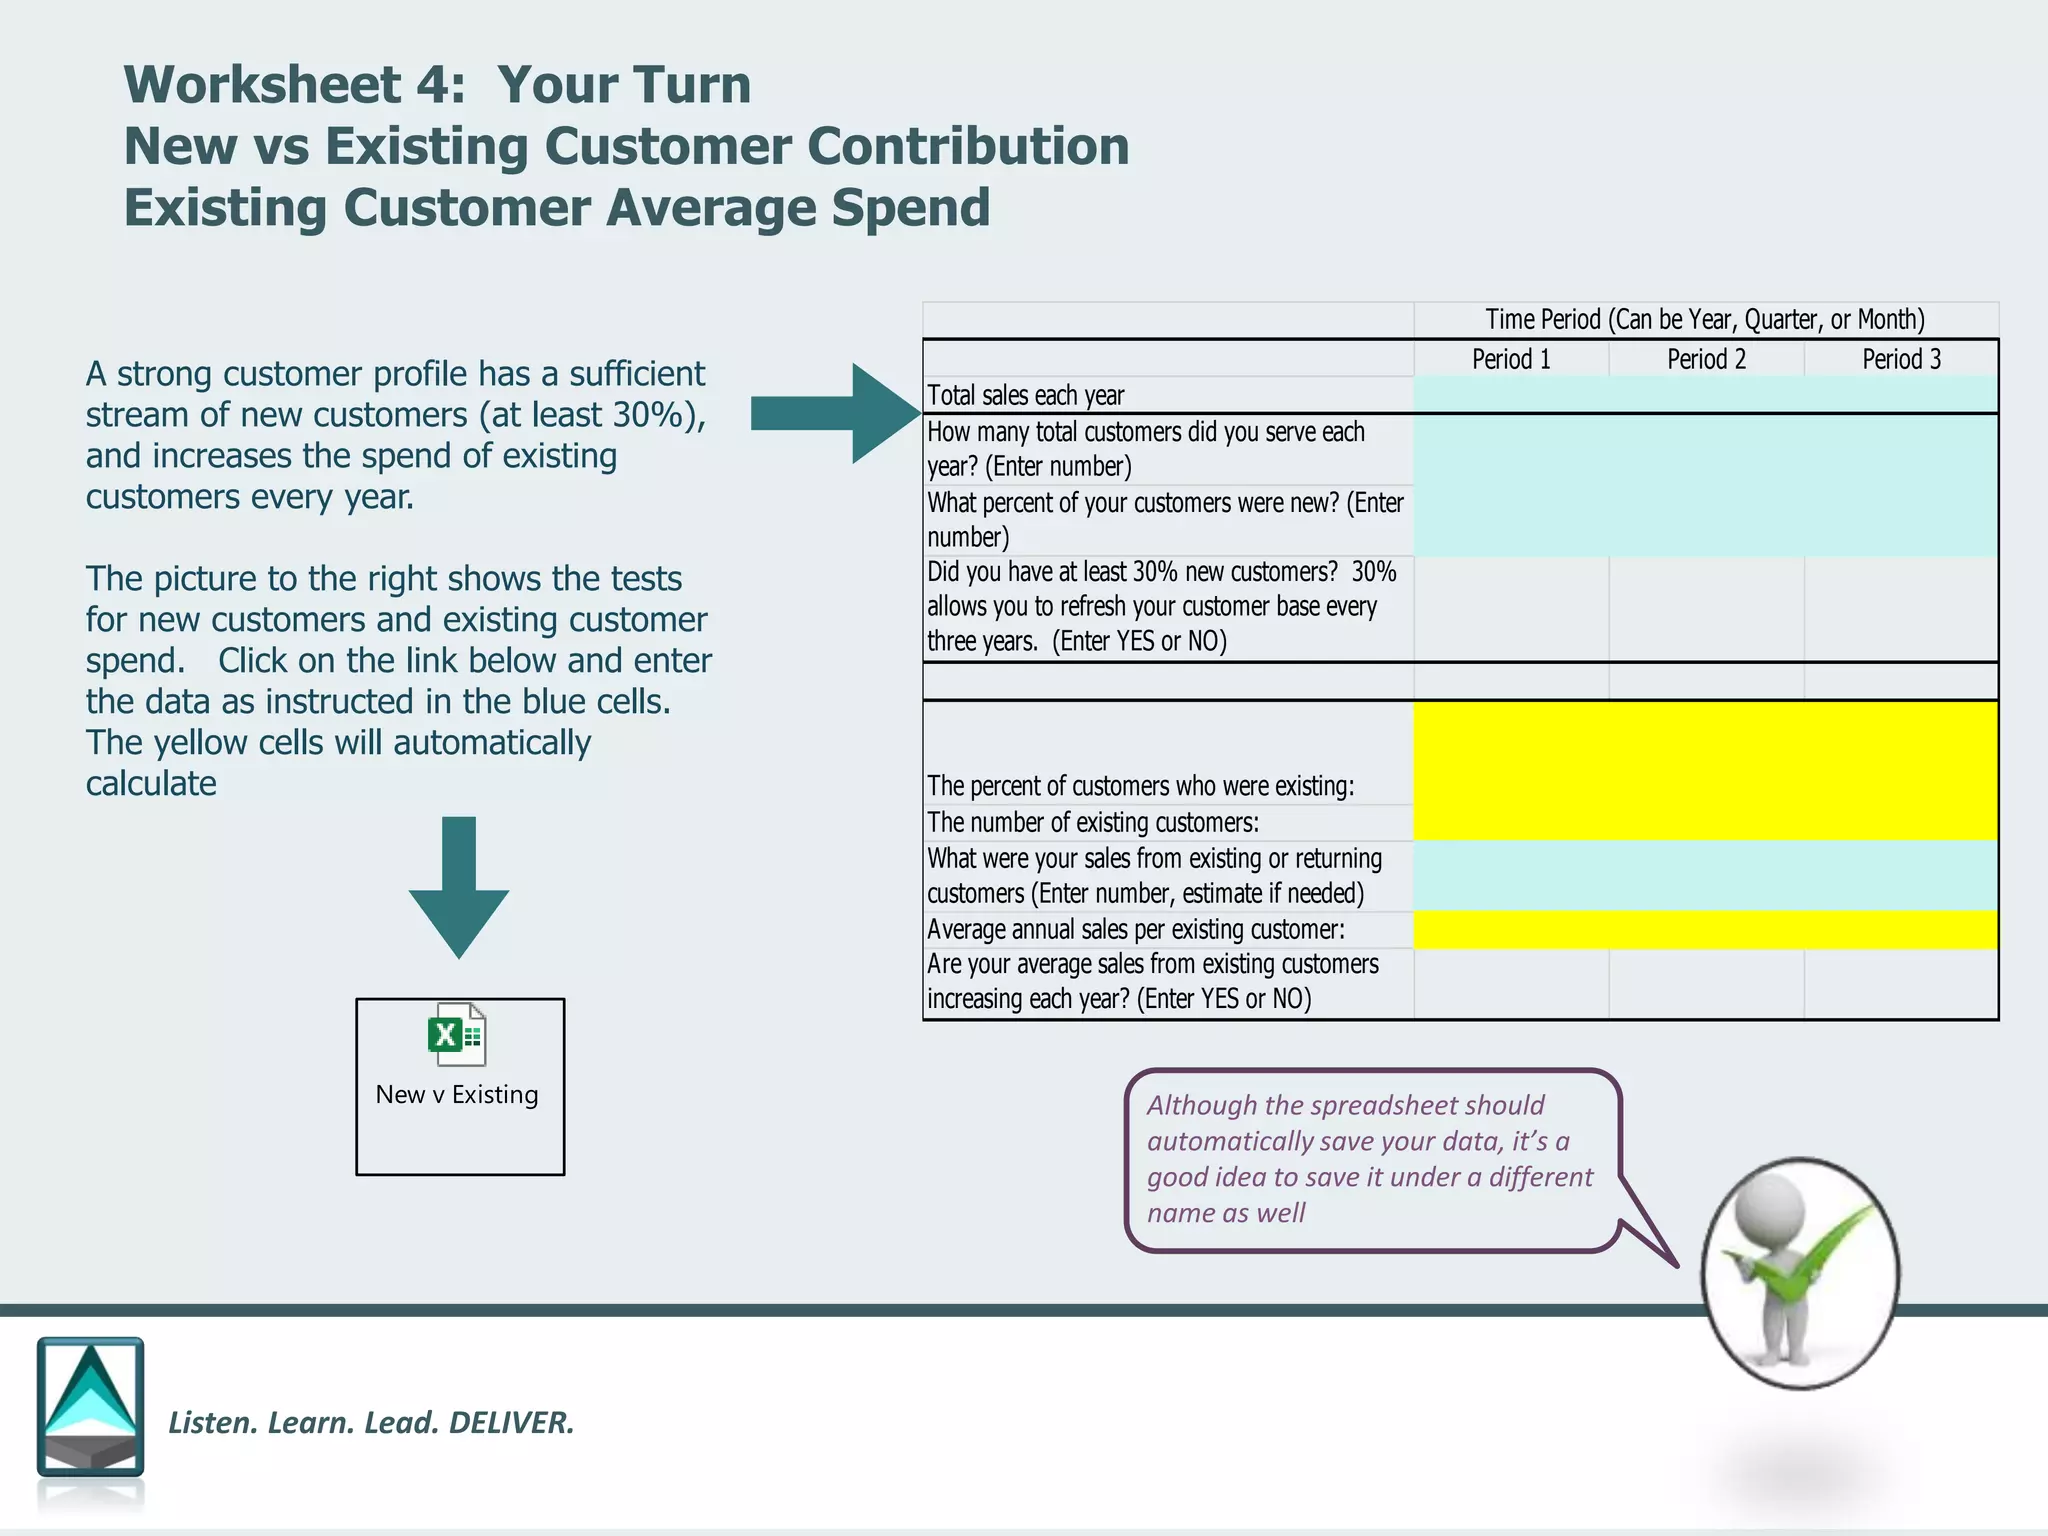
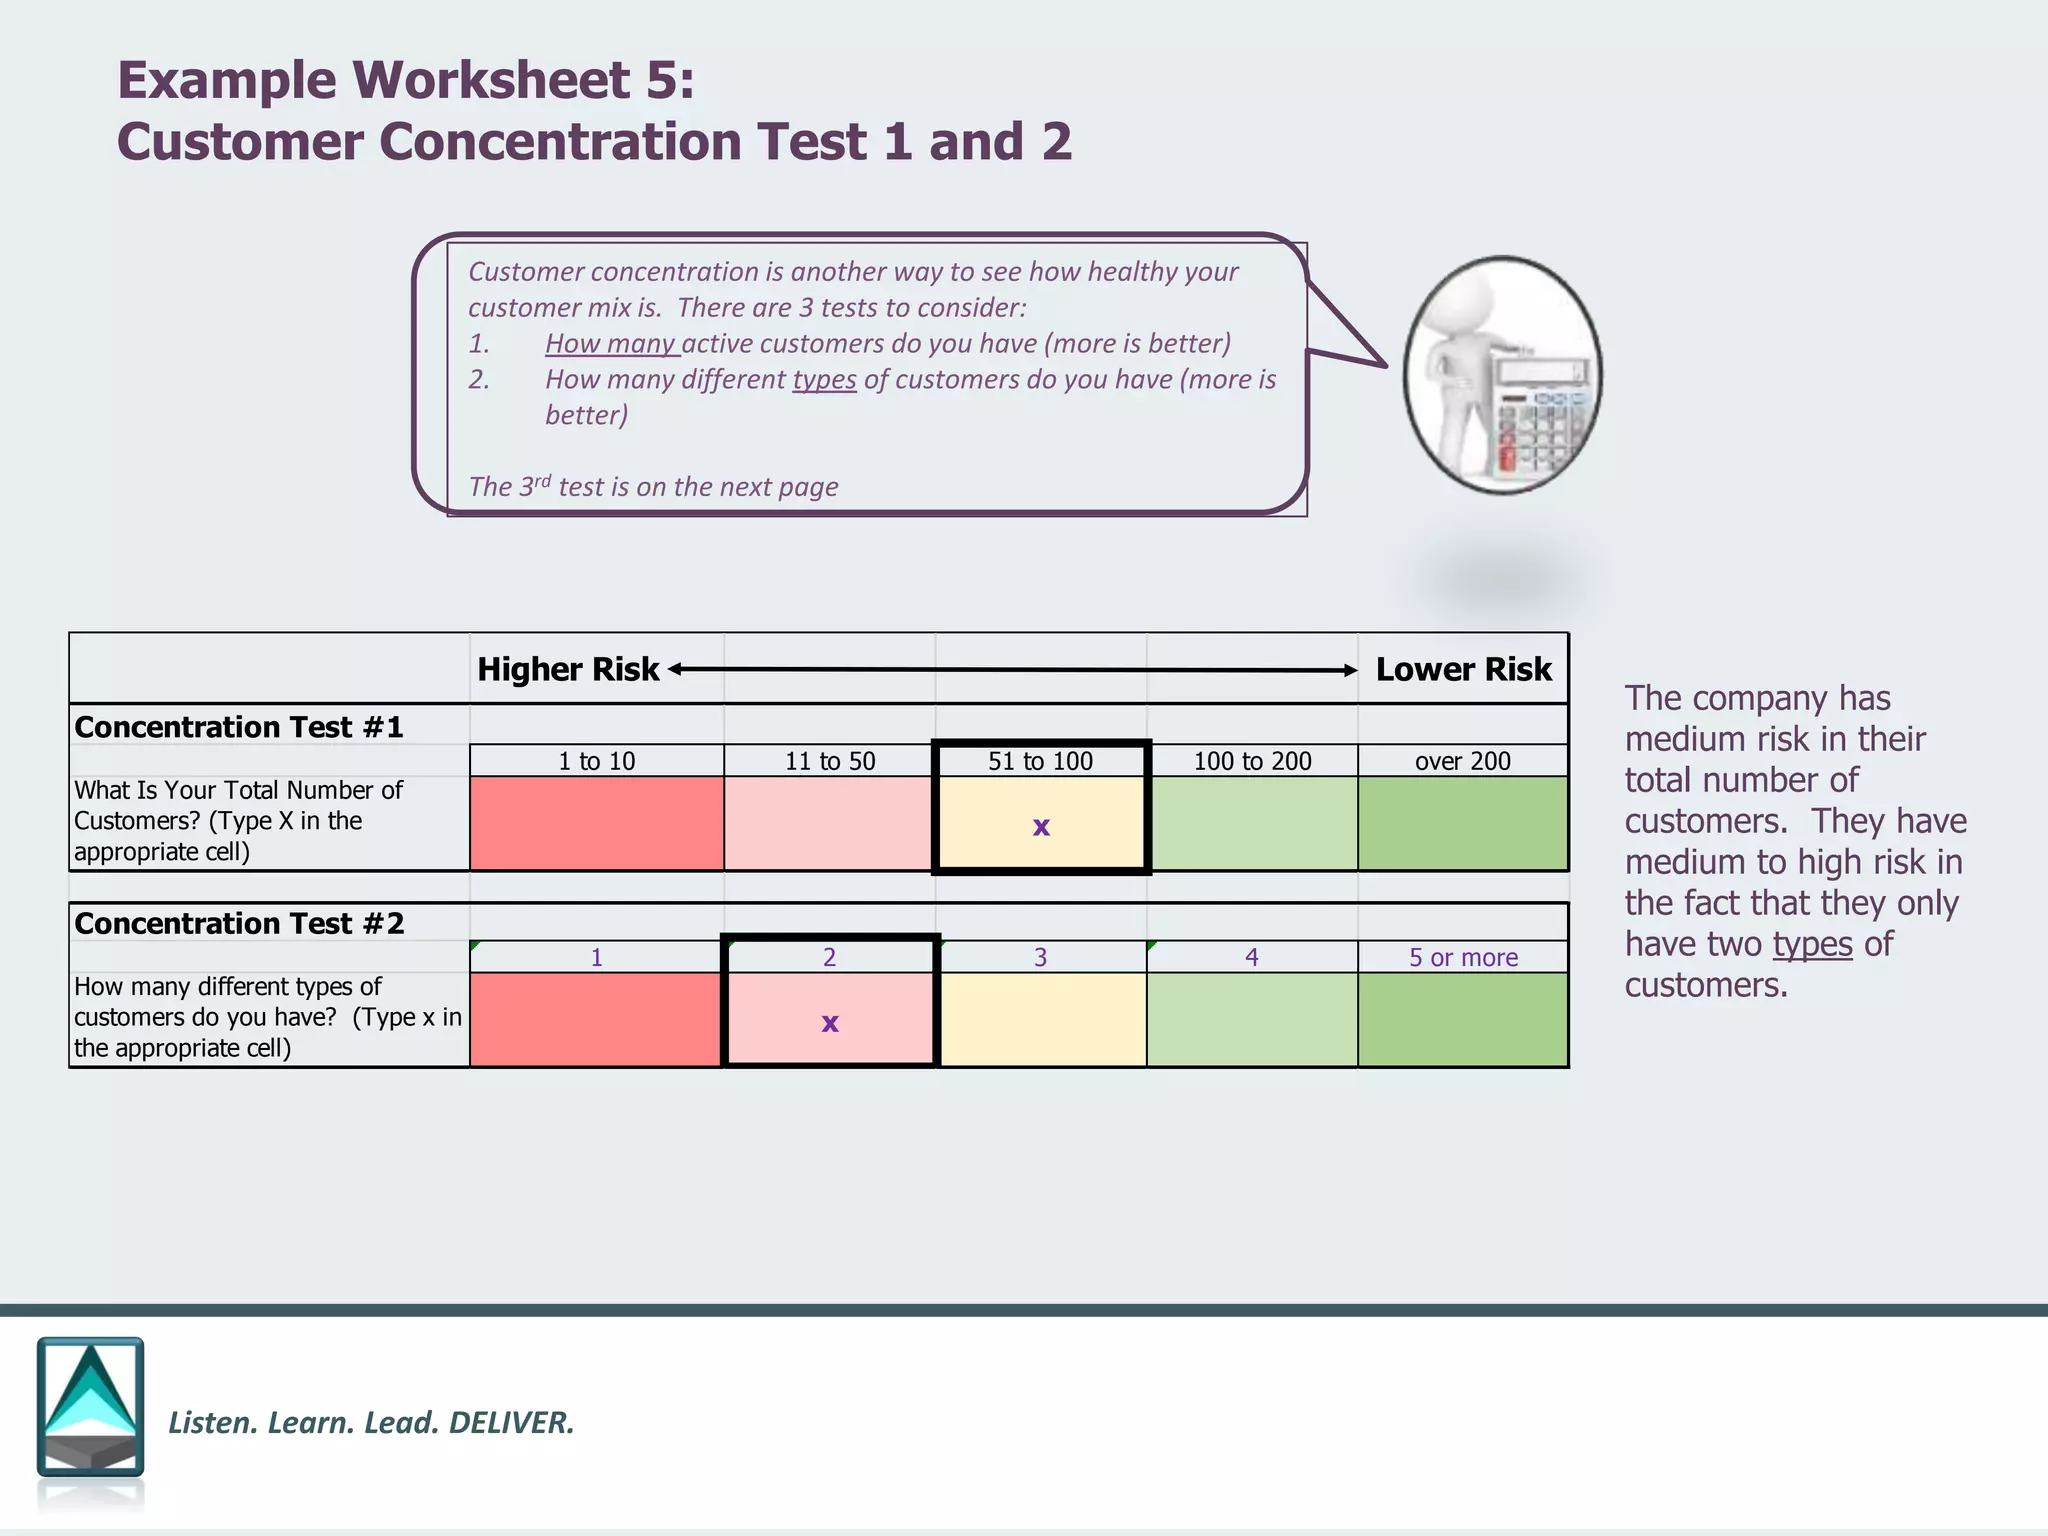
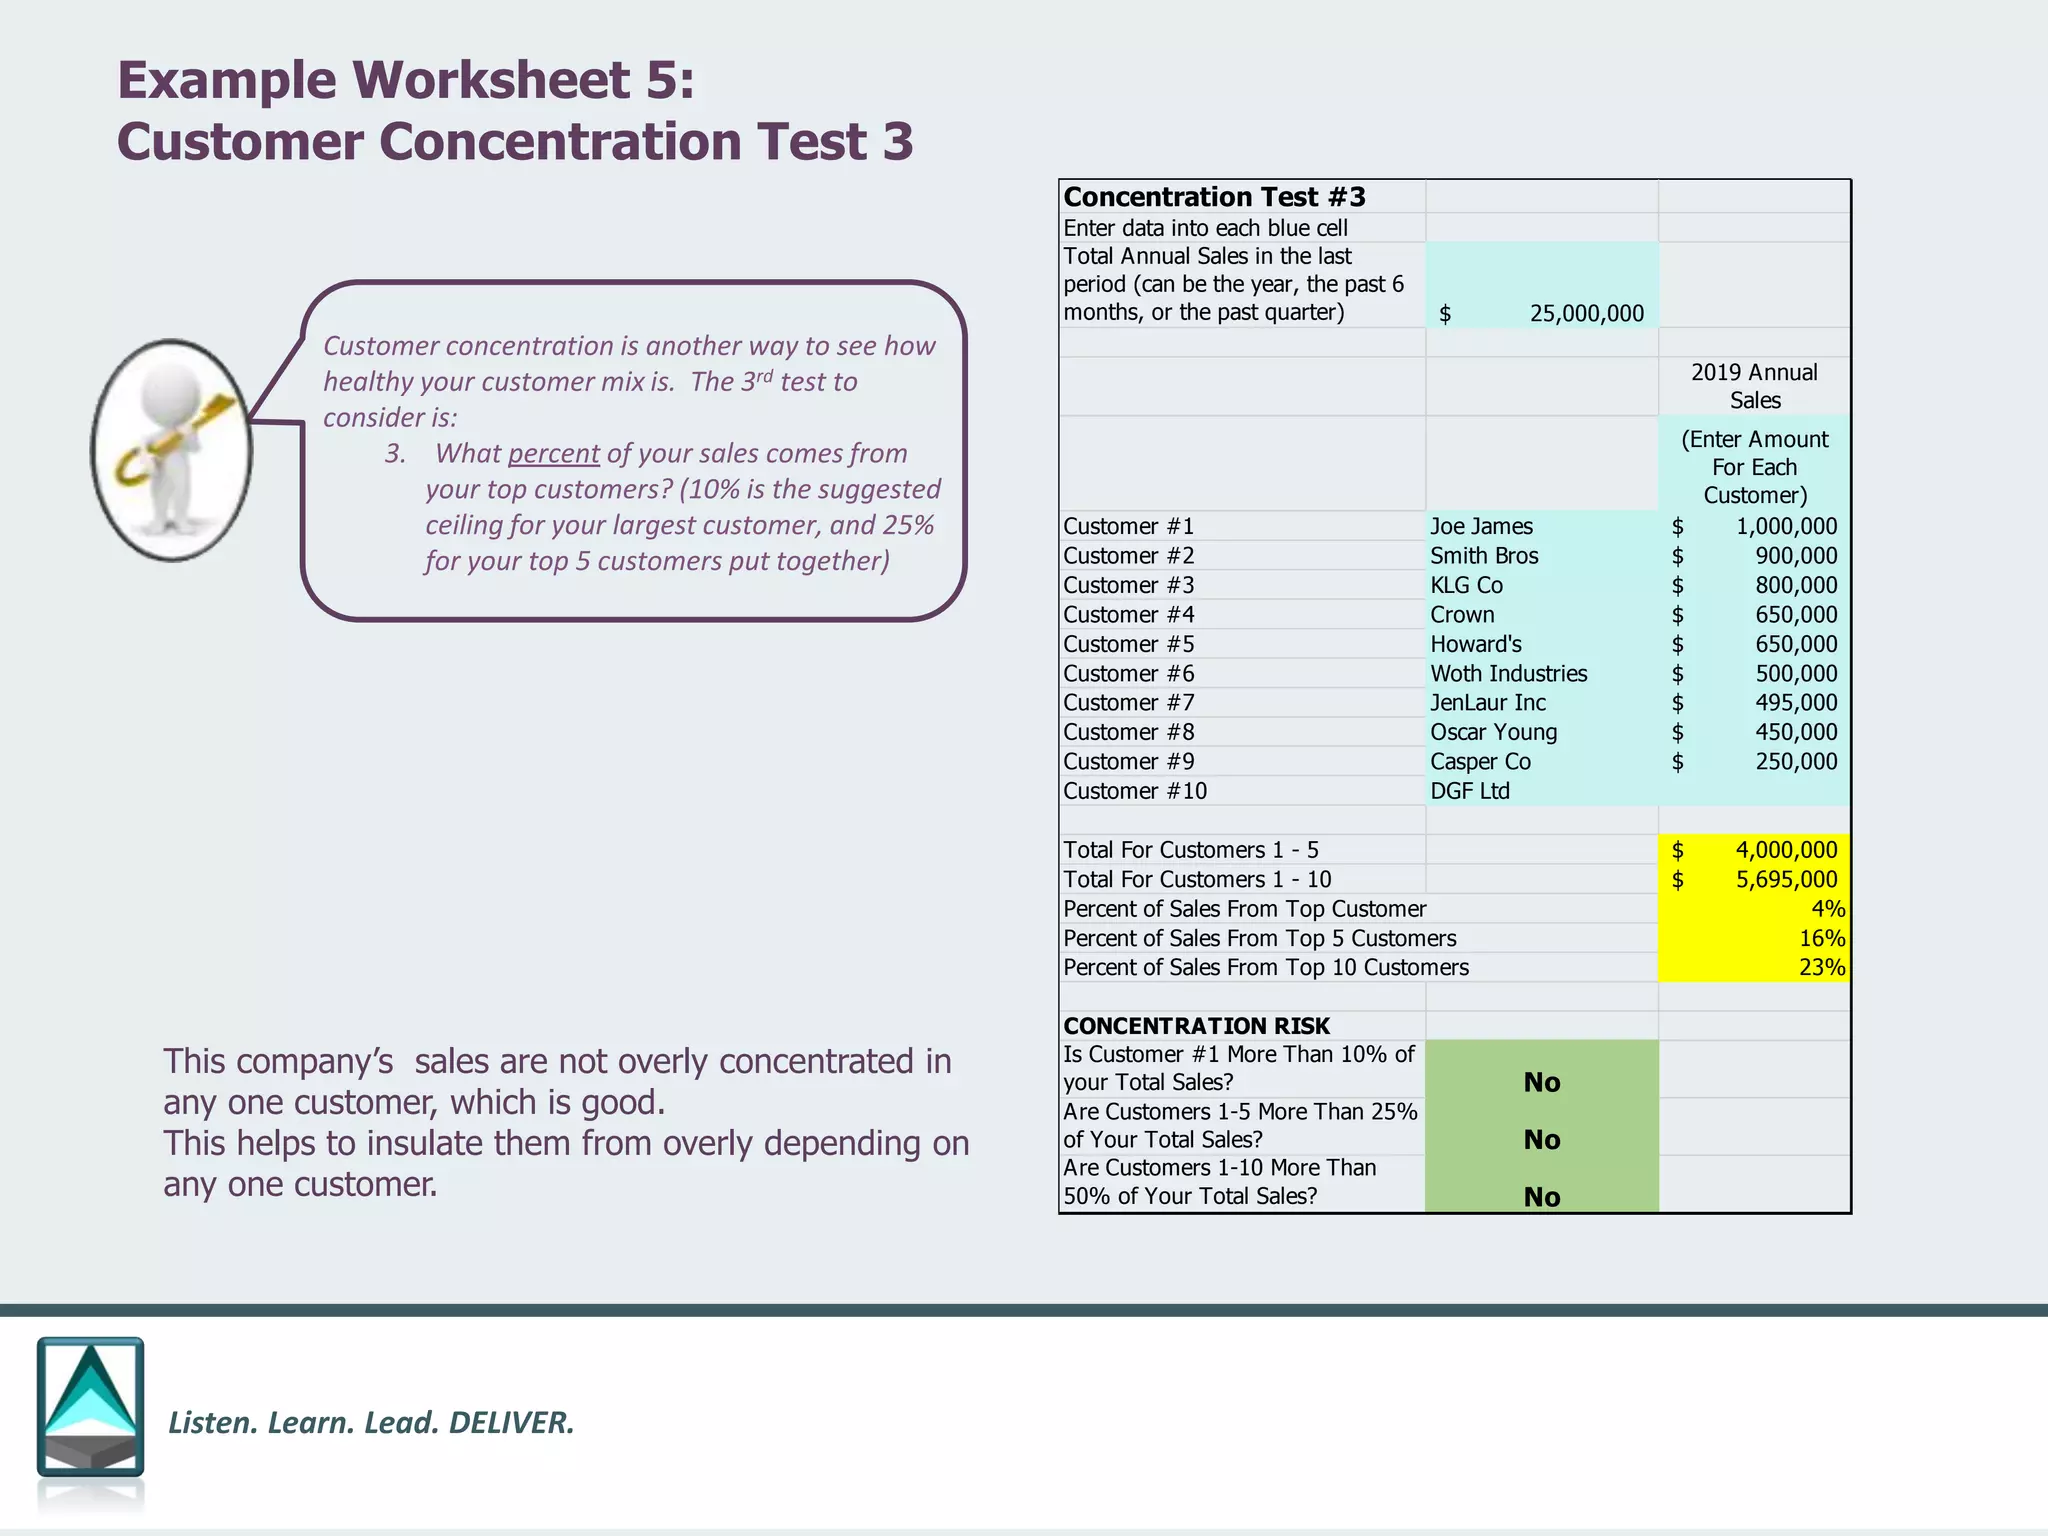
Listen. Learn. Lead. DELIVER.
Listen. Learn. Lead. DELIVER
MAPPING THE FUTURE
• Version 1.0 , July 2020
© 2020 Cathy Fischer. All rights reserved.
A Workbook To Chart Our Course Post Covid-19
MODULE 1
Listen. Learn. Lead. DELIVER.
Purpose And Premise
• Covid 19 is a historic disruption in our lives and businesses
• Companies of all sizes and across all industries need to determine what to do as a result
• Expert advice to respond to this need is available in the market, but it may be:
• Too high level/theoretical
• Too expensive/slow
• Question: what if there was a system – a set of processes and worksheets -- that companies of all
sizes could use to determine their own destiny?
• The requirements of this system:
• Down To Earth . . . Avoid jargon, get to the core of the issue
• Invite Participation . . . The real value will be in the discussion the tools facilitate
• Flexible . . . Able to be used effectively no matter how much/little data is available
• Generate Action . . . Get quickly to the outcome
Listen. Learn. Lead. DELIVER.
System Modules
• Module 1: Baseline – Assess organization’s health before Covid 19
• Module 2: Impact – Take stock of current assets
• Module 3: Options – Consider choices for future state; choose one
• Module 4: Action Plan – Move forward with specific steps
• Module 5: Adjust – Assess results, change course if needed
Look for me and my friends to
see best practices, examples,
benchmarks, and help along
the way!
Listen. Learn. Lead. DELIVER.
Measure Baseline Review Impact
Option 1: Shut
Down
Option 2: Modify
Current Business
2A: Press Your
Advantage
2B: Shed
Unproductive
Parts
Action Plan
Review and
Adjust
2C: Join Forces
Option 3:
Reinvent
Here’s How It Works. . .
(Base version, takes about 6 to 8 hours of discussion)
Data can be
gathered in
advance in a
day or two
Five 30-
minute work
sessions, can
be done as a
group or
assigned out
to individuals
TEAM DISCUSSION
2-hour work session,
to choose an option
Can be
assigned out
to individuals;
then 1-hour
team work
session
Monthly 1-
hour team
follow up
Listen. Learn. Lead. DELIVER.
MODULE 1
INSTRUCTIONS AND WORKSHEETS
Let’s get to work!
Listen. Learn. Lead. DELIVER.
Module 1: Baseline
Vital Statistics:
1. Industry Growth
2. How The Business Runs Today
3. Current Paradigms
4. New vs Existing Customers
5. Customer Concentration
6. Demand Generation Funnel
7. Demand Generation Tools
8. Supply Metrics
9. Supply Process
10. Business Results
Was Strong
and Stable
Was Strong
and
Growing
Fast
Was Weak
and
Declining
Was Small
and
Growing
Then conclude which of these best
described your business at that time
A complete view of
the business in only
10 worksheets
Assess organization’s health
going into Covid 19
Listen. Learn. Lead. DELIVER.
Name Annual Sales Growth
2017 2018 2019
Overall Industry Durable Goods 4.3% 6.7% 2.3%
Competitor A Safety Glass Inc 5.0% 7.0% 8.0%
Competitor B No Fail Glass 2.0% 2.0% 2.0%
Competitor C Glass Perfect 10.0% 5.0% 1.0%
Imaginary Business: Safety Glass manufacturing company
In this example, Safety Glass Inc is growing faster than the
market and getting stronger each year, No Fail Glass is growing
steadily but at a slower rate than the market, and Glass Perfect
is really struggling to keep up.
Example Worksheet 1:
Industry Growth
This is the “gross output” of an industry, which
captures total industry sales to end users and
to other industries, so it includes B:B and B:C
data. If a competitor is growing faster than
the industry, they are increasing share. If not,
they are losing share. The industry data
comes from the Bureau of Economic Analysis.
BEA data is free, and there are tutorials on
how to use the data. See bea.gov
Listen. Learn. Lead. DELIVER.
Worksheet 1: Your Turn
Industry Growth
Name Annual Sales Growth
2017 2018 2019
Overall
Industry
Competitor A
Competitor B
Competitor C
The table to the right shows the percent growth
of major industries in the US over the past three
years. Pick the industry that is closest to yours
and enter the gross output percent change in the
table below. Then enter the sales growth of your
top three competitors, to the best of your ability
IMPORTANT TIP: To enter
data into any chart in this
presentation, click “Escape” to
get out of the Slideshow View
and into the Normal View
Listen. Learn. Lead. DELIVER.
Example Worksheet #2:
How The Business Runs Today
Fill In The Blank (Not Real Information)
Industry Retail Trade
Target Market(s) Corporate Meetings; Weddings
Geography Maine, Vermont, New Hampshire
Major Product/Service Lines Made to order cakes and other baked goods
Price Position
(High, Med, Low)
High
B to B or B to C? Both. Business to business, and Business to consumer
Distribution (Wholesaler, Retailer, Direct To
Customer)
Direct To Customer through our own bakeries
Length of Time In Business 20 years
Average Tenure of Senior Management 20 years
Any Other Critical Information Uses 3D printing to make cake decorations specific for the customer
Have just opened 5 stores in Vermont
Imaginary Business: Regional Custom Bakery
Today’s teams are especially prone to the problems of “us versus
them” thinking and incomplete information. The solution is developing
a shared mindset among team members—something team leaders can
do by fostering a common understanding.
”The Secrets of Great Teamwork” HBR June 2016
Listen. Learn. Lead. DELIVER.
Worksheet #2: Your Turn
How The Business Runs Today
Subject Question Your Answer Here
Industry What general business category is the company in? If there are
several, choose the one that represents the largest part of the
business
Target Market Who does the company serve? What end users purchase the goods
or services the company makes?
Geography Is the company local, regional, national, or global?
Major Product/Service Lines Even if the company makes thousands of items, group them into
their major categories. We might choose different directions for the
different products
Price Position
(High, Med, Low)
Compared to the market, is the company low priced, premium
priced, or in the middle? If the company bids each job, estimate
where most of the bids fall for the jobs you win.
B to B or B to C? Business to Business or Business to Consumer?
Distribution (Wholesaler,
Retailer, Direct To Customer)
Does the company sell directly to the end user, or does it go through
a retail chain or a wholesaler?
Length of Time In Business How long has the company existed in its current form?
Average Tenure of Senior
Management
Consider the key decision makers. How long have they been
working in the business or industry
Any Other Critical Information This is provided so you can enter data that you think the team will
need
It’s important to create a common understanding of the business today as we look at options for the future.
Listen. Learn. Lead. DELIVER.
Example Worksheet #3:
Current Paradigms
List The Most Accepted Industry Paradigms
Parents’ and school administrators’ first concern is their children’s safety
School children leave home to go to school
Walking or bicycling to school is more dangerous than taking a school bus
School children hate taking the bus because it takes a long time, but most would have no other way to get to school
The type of bus that students ride is different than the type of bus that adult commuters ride
School buses hold between 65 and 75 passengers
Paradigms are the basic assumptions that are commonly
accepted by members of a community. A paradigm shift
is required when the existing assumptions can no longer
solve current problems. One of the most famous
paradigm shifts was in 1539, when Copernicus
overturned the doctrine that the sun revolves around the
earth with his theory that the earth is one of a number
of planets revolving around the sun.
Imaginary Business: National company that provides
school bus transportation and drivers for public schools
Related Industries: Transportation, Education
Listen. Learn. Lead. DELIVER.
Worksheet #3: Your Turn
Current Paradigms
List The Most Accepted Industry Paradigms Today
Some examples: Goods can always be made less expensively overseas; People will only buy an expensive item if they see it in person;
Cars everywhere require fossil fuel; Companies will forever need security systems
A paradigm is a belief that is generally held to be true in a particular community or industry.
It’s important to list the current paradigms in your industry, because innovation often comes by re-examining those.
Think of sentences that use definitive words like “always”, “everywhere”, “only”, “forever” and so on
Listen. Learn. Lead. DELIVER.
Example Worksheet 4:
New vs Existing Customer Contribution
Existing Customer Average Spend
At least 30% of
the company’s
customers are
new, which is
good
However, the
average sales to
existing
customers are
not going up.
This is worth
discussion to see
if it’s a problem
A strong customer profile has a sufficient
stream of new customers (at least 30%) and
increases the spend of existing customers
every year - Forbes 6/2016
2017 2018 2019
Total sales each year 2,000,000$ 2,300,000$ 2,350,000$
How many total customers did you serve each
year? (Enter number)
400 500 550
What percent of your customers were new? (Enter
number)
20% 25% 30%
Did you have at least 30% new customers? 30%
allows you to refresh your customer base every
three years. (Enter YES or NO)
no no yes
The percent of customers who were existing:
80% 75% 70%
The number of existing customers: 320 375 385
What were your sales from existing or returning
customers (Enter number, estimate if needed)
1,750,000$ 2,000,000$ 2,000,000$
Average annual sales per existing customer: 5,469$ 5,333$ 5,195$
Are your average sales from existing customers
increasing each year? (Enter YES or NO) no no no
Listen. Learn. Lead. DELIVER.
Worksheet 4: Your Turn
New vs Existing Customer Contribution
Existing Customer Average Spend
A strong customer profile has a sufficient
stream of new customers (at least 30%),
and increases the spend of existing
customers every year.
The picture to the right shows the tests
for new customers and existing customer
spend. Click on the link below and enter
the data as instructed in the blue cells.
The yellow cells will automatically
calculate
Period 1 Period 2 Period 3
Total sales each year
How many total customers did you serve each
year? (Enter number)
What percent of your customers were new? (Enter
number)
Did you have at least 30% new customers? 30%
allows you to refresh your customer base every
three years. (Enter YES or NO)
The percent of customers who were existing:
The number of existing customers:
What were your sales from existing or returning
customers (Enter number, estimate if needed)
Average annual sales per existing customer:
Are your average sales from existing customers
increasing each year? (Enter YES or NO)
Time Period (Can be Year, Quarter, or Month)
Although the spreadsheet should
automatically save your data, it’s a
good idea to save it under a different
name as well
New v Existing
Listen. Learn. Lead. DELIVER.
Example Worksheet 5:
Customer Concentration Test 1 and 2
The company has
medium risk in their
total number of
customers. They have
medium to high risk in
the fact that they only
have two types of
customers.
Higher Risk Lower Risk
Concentration Test #1
1 to 10 11 to 50 51 to 100 100 to 200 over 200
What Is Your Total Number of
Customers? (Type X in the
appropriate cell)
x
Concentration Test #2
1 2 3 4 5 or more
How many different types of
customers do you have? (Type x in
the appropriate cell)
x
Customer concentration is another way to see how healthy your
customer mix is. There are 3 tests to consider:
1. How many active customers do you have (more is better)
2. How many different types of customers do you have (more is
better)
The 3rd test is on the next page
Listen. Learn. Lead. DELIVER.
Example Worksheet 5:
Customer Concentration Test 3
This company’s sales are not overly concentrated in
any one customer, which is good.
This helps to insulate them from overly depending on
any one customer.
Customer concentration is another way to see how
healthy your customer mix is. The 3rd test to
consider is:
3. What percent of your sales comes from
your top customers? (10% is the suggested
ceiling for your largest customer, and 25%
for your top 5 customers put together)
Concentration Test #3
Enter data into each blue cell
Total Annual Sales in the last
period (can be the year, the past 6
months, or the past quarter) 25,000,000$
2019 Annual
Sales
(Enter Amount
For Each
Customer)
Customer #1 Joe James 1,000,000$
Customer #2 Smith Bros 900,000$
Customer #3 KLG Co 800,000$
Customer #4 Crown 650,000$
Customer #5 Howard's 650,000$
Customer #6 Woth Industries 500,000$
Customer #7 JenLaur Inc 495,000$
Customer #8 Oscar Young 450,000$
Customer #9 Casper Co 250,000$
Customer #10 DGF Ltd
Total For Customers 1 - 5 4,000,000$
Total For Customers 1 - 10 5,695,000$
Percent of Sales From Top Customer 4%
Percent of Sales From Top 5 Customers 16%
Percent of Sales From Top 10 Customers 23%
CONCENTRATION RISK
Is Customer #1 More Than 10% of
your Total Sales? No
Are Customers 1-5 More Than 25%
of Your Total Sales? No
Are Customers 1-10 More Than
50% of Your Total Sales? No
Listen. Learn. Lead. DELIVER.
Worksheet 5: Your Turn
Customer Concentration
Tests 1, 2, 3
The picture to the right shows these
tests. Click on the link below to
open the excel file and enter data as
instructed. The yellow cells will
automatically calculate.
Concentration Test #1 Higher Risk Lower Risk
1 to 10 11 to 50 51 to 100 100 to 200 over 200
What Is Your Total Number of
Customers? (Type x in the
appropriate cell)
Concentration Test #2
1 2 3 4 5 or more
How many different types of
customers do you have? (Type x in
the appropriate cell)
Building Example:
Residential and
Commerciall
Restaurant Example:
Breakfast, Dinner, and
Lunch
Hair Salon Example:
Male, Child, Formal
Occasion Female,
Regular Female
Concentration Test #3
Enter data into each blue cell
Total Annual Sales in the last
period (can be the year, the past 6
months, or the past quarter)
2019 Annual
Sales
(Enter Amount
For Each
Customer)
Customer #1 (Enter Name Here)
Customer #2 (Enter Name Here)
Customer #3 (Enter Name Here)
Customer #4 (Enter Name Here)
Customer #5 (Enter Name Here)
Customer #6 (Enter Name Here)
Customer #7 (Enter Name Here)
Customer #8 (Enter Name Here)
Customer #9 (Enter Name Here)
Customer #10 (Enter Name Here)
Total For Customers 1 - 5 -$
Total For Customers 1 - 10 -$
Percent of Sales From Top Customer #DIV/0!
Percent of Sales From Top 5 Customers #DIV/0!
Percent of Sales From Top 10 Customers #DIV/0!
CONCENTRATION RISK
Is Customer #1 More Than 10% of
your Total Sales? #DIV/0!
Are Customers 1-5 More Than 25%
of Your Total Sales? #DIV/0!
Are Customers 1-10 More Than
50% of Your Total Sales? #DIV/0!
Cust
Concentration
Listen. Learn. Lead. DELIVER.
Example Worksheet 6:
Demand Generation Funnel
FUNNEL STAGE Excellent
Very
Strong
Okay
Needs
Help
Poor
Tools -- how many different ways do you reach out to
possible customers?
x
All Contacts – how strong is your system at capturing
the names and information of people who contact
you?
x
Qualified Leads - -how strong is your system at
understanding the specific need that the possible
customer has, so you can determine if you can help
them?
x
Good Prospects – how strong is your system at
turning over the leads generated from Marketing to
the Sales team to act on?
x
Priority Opportunities – how strong is your system at
evaluating the sales potential of each prospect to help
determine your focus?
x
“Demand generation” is the entire set of marketing and
sales activities that turn potential customers into long
term clients. Thinking about this as a funnel helps to
visualize what your system looks like
Listen. Learn. Lead. DELIVER.
Worksheet 6: Your Turn
Demand Generation Funnel
Demand Generation Tools
All
Contacts
Qualified
Leads
Good
Prospects
Priority
Opportunities
A complete demand generation
funnel is shown on the right.
Click on the link below to fill in
your self assessment. If you
don’t have data, just provide
your opinion.
Demand Funnel
Listen. Learn. Lead. DELIVER.
Example Worksheet 7:
Demand Generation Tools
Demand generation tools are the
approaches you use at the very beginning
of a customer relationship to get the
customer into the funnel. There are many
different demand generation tools, as
shown on the right.
Demand Generation
Tool
Never, and we
haven't even
considered it
Never, but we
have talked
about it
We tried it in
the past or
use it in
specific
situations
We use this
frequently and
are really
familiar with it
We use this all
the time
SCORE
Give away a sample of your
best stuff
x 4
Make and provide a useful
tool, app, or resource
x 2
Use Lookalike audiences on
Facebook
x 1
Use Managed placements in
Display advertising
x 2
Invest more in Content
Creation
x 2
Improve your email
strategy
x 5
Implement a lead scoring
system
x 5
YOUR FINAL SCORE 21
YOUR RATING BELOW
OPPORTUNITY
Strong
Medium
Opportunity
Novice
My company's usage of this tool (enter "x" in the correct column)
You are well on your way to using the best demand generation tools in the
market. Choose what's working best and do more
You have been using some of the tools available to you, but there are
obvious areas that could be improved
You are dabbling in demand generation, which is great, but there is
probably a lot more business to be gained by deploying more tools
The world is your oyster. Because you are just starting out applying digital
demand generation tools, the upside for you is terrific!
Listen. Learn. Lead. DELIVER.
Worksheet 7: Your Turn
Demand Generation Tools
When you open the worksheet, you will
see the explanation of the demand
generation tool, along with an example.
This will allow you to easily score your use
of demand generation tools.
Click on the link below to open the excel
file and enter data as instructed. Your
overall rating will be automatically
generated from your answers.
Demand Generation
Tool
Comment Example
Give away a sample of your
best stuff
This creates trust, reflects well on your brand, and makes
potential customers more willing to give you information that
you can then use to qualify them as leads
An athletic club offers a free visit, or a hair
care company provides shampoo samples
Make and provide a useful
tool, app, or resource
Similar to giving away your best stuff, this approach provides a
way for potential customers to interact with your brand in a
positive way before buying
A restaurant provides recipes of their
popular dishes
Use Lookalike audiences on
Facebook
This approach allows you to significantly increase the reach of
your Facebook campaigns by creating a custom audience that
has the same characteristics of your current customers. Just
pop into Facebook, put "create a custom audience" into the
search bar, and follow the tutorial. It can be as inexpensive as
$100 to try this.
A painting company creates a custom
audience based on the demographics of
their most profitable customers
Use Managed placements in
Display advertising
Managed placements allow your company to more effectively
control who sees their ads, limiting the audience to those who
are more likely to respond.
A construction company places display ads
on Google that reach people who have
previously been on their website
Invest more in Content
Creation
This basically means to make what you say and what you
show to potential customers more persuasive. If you write
blogs, are you offering fresh perspective? If you have photos
of successful projects, do they look as inviting as possible?
A cupcake bakery creates mouth watering
pictures of their cupcakes
Improve your email
strategy
Test, test, test. Try different headlines, different visuals, or
different offers. Keep your email contacts interested in opening
up your (digital) envelope.
An accounting firm tests one email that says
"find out more" compared to another that
says "click for us to call you"
Implement a lead scoring
system
If you have more leads than you can service, it can be very
effective to implement a scoring system. Use the behaviors of
your most profitable customers as a model, and score possible
customers based on that same behavior
A commercial artist realizes that her best
leads come from word of mouth referrals,
so she makes cards that her customers can
hand out
Demand
Generation Tools
Listen. Learn. Lead. DELIVER.
Introduction To Worksheets 8 and 9:
Supply Side
The supply chain includes all the parts of the business that happen after the customer places their order for the
product or service. It includes forecasting the demand for the future, procuring raw materials, making the product or
service, delivering it to the customer and getting paid for it. A healthy supply chain is critical to ongoing profits.
Since the supply chain has a lot of moving parts, there are two challenges to evaluating it:
1. Figuring out what the most important measurements are, because there are hundreds of options. In this case, we
are measuring
 Five specific metrics (Worksheet 8): perfect order percent, cash to cash cycle time, inventory days of supply,
customer order cycle time, and cost of supply chain.
 Seven specific processes (Worksheet 9): measurement system, forecasting, customer review, supplier review,
quality control, inventory management, transportation measurement.
2. Figuring out what the “right” score should be on whatever you are measuring. The truth is, getting to a specific
number is less important than making continuous improvement. Start wherever you are, and build from there
Note: if you run a service business, you may think that the supply side doesn’t really apply to you. However, most of
the concepts of great supply chain are relevant and measurable in a service business.
According to a survey by Deloitte from 2014, 79%
of companies with high-performing supply chains
achieve revenue growth superior to the
average within their industries. Conversely, just
8% of businesses with less capable supply chains
report above-average growth.
Listen. Learn. Lead. DELIVER.
Example Worksheet 8:
Supply Side Metrics
We are looking at these 5 metrics:
1. Perfect Order – for this company, the percent of
their orders that are “perfect” is increasing every
time period. Good news!
2. Inventory Days Supply – for this company, the
inventory days supply increased from period 2
to period 3. Normally this is not a good sign,
although in an emergency situation a company
might want to increase their supply to serve
customers
3. Cash to Cash Cycle Time – for this company, the
cash to cash cycle time increased a little bit
from the 2nd to the 3rd period, but it’s well below
where the company started. Good news
overall.
4. Customer Order Cycle Time – for this company,
the customer order cycle time is basically
unchanged over time.
5. Cost of Supply – for this customer, the cost of
supply as a percent of their total sales is going
down over time. Good news
MEASUREMENT AND DESCRIPTION Period 1 Period 2 Period 3 QUESTION BELOW
Enter YES
or NO in
the blue cell
PERFECT ORDER: The error free rate of the entire supply chain 57% 69% 80%
Is the percent of perfect orders
getting higher over time?
yes Good News
ENTER DATA INTO EACH BLUE CELL
On Time Delivery: The percent of orders which are delivered on
time
83% 91% 97%
In Full Delivery: The percent of orders where the customer
receives exactly what they ordered, in the right quantity
90% 94% 95%
Damage Free Delivery: The percent of orders which arrive in the
right condition
80% 85% 96%
Accurate Documentation: The percent of orders which receive
accurate documentation during the whole process, including
information on delivery date and accurate billing information
95% 95% 90%
INVENTORY DAYS OF SUPPLY: The number of days your
inventory would last without replenishment, before running out. 75 50 60
Is the inventory days of supply
getting lower over time?
no
May Need
Attention
ENTER DATA INTO EACH BLUE CELL
The total quantity of products you have in stock, in units 500 500 1000
The average number of products sold each month, in units 200 300 500
The average number of products sold each day, in units 7 10 17
CASH TO CASH CYCLE TIME: The time between when a
company sends cash to suppliers, and when it receives cash from
customers
90 45 50
Is the cash to cash cycle time
getting shorter over time?
yes Good News
ENTER DATA INTO EACH BLUE CELL
Days of Inventory - how many days of product can you supply
from what you have on hand?
75 50 60
Days Payable - how many days you can wait before paying
suppliers
30 45 50
Days Receivable - how many days it takes to receive payment 45 40 40
CUSTOMER ORDER CYCLE TIME: The number of days
between receipt of a purchase order and customer delivery
Is the customer order cycle time
getting shorter over time?
no
May Need
Attention
ENTER HOW MANY DAYS IT TAKES BETWEEN WHEN YOU
RECEIVE AN ORDER AND WHEN YOU DELIVER IT
40 35 40
COST OF SUPPLY: The total cost of the supply chain system
divided by the total sales, excluding the cost of the product
53% 32% 21%
Is the percent of your sales that
you are spending on the supply
chain getting lower over time?
yes Good News
ENTER DATA INTO EACH BLUE CELL
Salaries of people who purchase your raw material, forecast your
sales, take the orders, manage the warehouse, make your
product, transport your finished product, bill and collect payment
from the customer, and handle any customer service issues
$ 10,000 $ 15,000 20,000$
Cost of transporting the product, whether by mail, by truck, by
courier, by plane, or by any other method
$ 400 $ 450 500$
Cost of warehousing, such as real estate rental $ 200 $ 300 400$
Total cost 10,600$ 15,750$ 20,900$
Total sales $ 20,000 $ 50,000 100,000$
ANALYSIS AND DATA ENTRY AREA EVALUATION AREA
Time Periods
(These can be months, quarters, or years)
Listen. Learn. Lead. DELIVER.
Worksheet 8: Your Turn
Supply Side Metrics
Each of these metrics will be automatically
calculated in the yellow cells when you
input the data in the blue cells. If you
don’t have accurate data, just put in your
best estimate. When you are done
entering the data, answer the questions
“yes” or “no” in the Evaluation area, and
the worksheet will tell you if an area needs
focus
Don’t be put off by complexity of this
worksheet: it will make sense once you
are working with it.
Click on the link below to open the metrics
worksheet:
MEASUREMENT AND DESCRIPTION Period 1 Period 2 Period 3 QUESTION BELOW
Enter Yes
or No in the
blue cell
This cell will
automatically change
based on your entry
PERFECT ORDER: The error free rate of the
entire supply chain process
0% 0% 0%
Is the percent of perfect orders
getting higher over time?
May Need
Attention
ENTER DATA INTO EACH BLUE CELL
On Time Delivery: The percent of orders which
are delivered on time
In Full Delivery: The percent of orders which are
delivered completely (the customer receives the
right items, in the right quantities)
Damage Free Delivery: The percent of orders
which arrive in the right condition
Accurate Documentation: The percent of orders
which receive accurate documentation during the
whole process, including information on delivery
date and accurate billing information
CASH TO CASH CYCLE TIME: The time
between when a company sends cash to suppliers,
and when it receives cash from customers
0 0 0
Is the cash to cash cycle time
getting shorter over time?
May Need
Attention
ENTER DATA INTO EACH BLUE CELL
Days of Inventory - how many days of product
you have on hand
Days Payable - how long you can wait before
paying suppliers
Days Receivable - how long it takes to receive
payment
INVENTORY DAYS OF SUPPLY: The number
of days your inventory would last without
replenishment, before running out.
#DIV/0! #DIV/0! #DIV/0!
Is the inventory days of supply
getting lower over time?
May Need
Attention
ENTER DATA INTO EACH BLUE CELL
The total quantity of products you have in stock, in
units
The average number of products sold each month,
in units
The average number of products sold each day, in
units 0 0 0
CUSTOMER ORDER CYCLE TIME: The
number of days between receipt of a purchase
order and customer delivery
Is the customer order cycle time
getting shorter over time?
May Need
Attention
ENTER HOW MANY DAYS IT TAKES BETWEEN
WHEN YOU RECEIVE AN ORDER AND WHEN YOU
DELIVER IT
COST OF SUPPLY: The total cost of the supply
chain system divided by the total sales, excluding
the cost of the product
#DIV/0! #DIV/0! #DIV/0!
Is the percent of your sales that
you are spending on the supply
chain getting lower over time?
May Need
Attention
ENTER DATA INTO EACH BLUE CELL
Salaries of people who purchase your raw
material, forecast your sales, take the orders,
manage the warehouse, make your product,
transport your finished product, bill and collect
payment from the customer, and handle any
customer service issues
Cost of transporting the product, whether by mail,
by truck, by courier, by plane, or by any other
method
Cost of warehousing, such as real estate rental
Total cost 0 0 0
Total sales
Time Periods
(These can be months, quarters, or years)
ANALYSIS AND DATA ENTRY AREA EVALUATION AREA
Supply Chain
Metrics
Listen. Learn. Lead. DELIVER.
Example Worksheet 9:
Supply Side Process
There are 7 processes that are key to a
strong supply chain:
1. Measurement
2. Forecasting
3. Regular Supplier Review
4. Regular Customer Review
5. Quality Control
6. Inventory Management
7. Transportation Management
Depending on which box you “x”, the
score will calculate. The final score will
be shown below.
Remember, the important point isn’t
what your score is today. It’s what you
will do to keep improving your score
over time.
This company’s Supply Chain rates as an
“opportunity”. Focusing on making
supply chain process improvements
should show immediate results
Core Supply Chain Process
Never, and we
haven't even
considered it
Never, but we
have talked
about it
We tried it in
the past or
use it in
specific times
of the year
We use this
frequently and
are really
familiar with it
We use this all
the time and we
could teach
others how to
do it
SCORE
Metrics x 2
Forecasting x 3
Regular Supplier Review x 4
Regular Customer Review x 4
Quality Control x 3
Inventory Management x 3
Transportation Management x 2
YOUR TOTAL SCORE 21
YOUR RATING BELOW
OPPORTUNITY
Strong
Medium
Opportunity
Novice
My company's usage of this process (enter "X" in the correct column)
You are well on your way to using the best supply chain processes in the
market. Choose what's working best and do more
You have been using some of the Supply Chain processes available to you,
but there are obvious areas that could be improved
You are dabbling in Supply Chain processes, which is great, but there is
probably a lot more business to be gained by using more of them
The world is your oyster. Because you are just starting out applying Supply
Chain processes, the upside for you is terrific!
Listen. Learn. Lead. DELIVER.
Worksheet 9: Your Turn
Supply Side Process
When you open this file, you will see
a description of the 7 processes that
are key to a strong supply chain.
This will help you evaluate your
capability in this area.
Click on the link below to open the
process worksheet
Supply Chain
Process
Core Supply Chain Process Description
Never, and we
haven't even
considered it
Never, but we
have talked
about it
We tried it in
the past or
use it in
specific times
of the year
We use this
frequently and
are really
familiar with it
We use this all
the time and we
could teach
others how to
do it
SCORE
Metrics
Agreement upon what measurements are important, accurate and
regular measurement of those items, putting those measurements
into a form that all the team members can understand , and
sharing them regularly
#N/A
Forecasting
Calculating how many jobs or orders your company expects to
receive in the future, comparing that information to actual historical
information, and discussing the assumptions of the forecast on a
regular basis. The discussion can be weekly, monthly, quarterly, or
any other time frame, as long as it happens regularly
#N/A
Regular Supplier Review
At least annually, discussing with each of your most important
suppliers how well they are meeting your needs in terms of quality,
timeliness, and cost. Developing a plan for improvement, writing it
down, and tracking their performance
#N/A
Regular Customer Review
Obtaining ongoing information from your customers about how well
you are meeting their needs in terms of quality, timeliness, and
cost. Developing a plan for improvement, writing it down, and
tracking your performance regularly
#N/A
Quality Control
Defining your quality standards in a factual way. Inspecting
incoming raw materials to ensure they meet your standards, and
then inspecting the finished good or sevice you provide before you
give it to the customer to ensure it meets your standards.
#N/A
Inventory Management
Defining how inventory should be received, stored, and counted on
a regular basis, and then tracking how you are doing against those
goals
#N/A
Transportation Management
Reviewing how your products are delivered to your customers, and
making sure that this is happening in the most efficient way that
best meets the customer needs. If necessary, having different
levels of delivery timing available at different prices
#N/A
YOUR TOTAL SCORE #N/A
YOUR RATING BELOW
#N/A
Strong
Medium
Opportunity
Novice
My company's usage of this process (enter "X" in the correct column)
You are well on your way to using the best supply chain processes in the
market. Choose what's working best and do more
You have been using some of the Supply Chain processes available to you,
but there are obvious areas that could be improved
You are dabbling in Supply Chain processes, which is great, but there is
probably a lot more business to be gained by using more of them
The world is your oyster. Because you are just starting out applying Supply
Chain processes, the upside for you is terrific!
Listen. Learn. Lead. DELIVER.
Example Worksheet 10:
Business Results
P&L Statement
Period 1 Period 2 Period 3 Period 4 Period 5
Revenue Stream 1 7,690$ 7,815$ 7,983$ 8,064$ 8,190$
Revenue Stream 2 1,908$ 1,938$ 1,968$ 2,000$ 2,031$
Returns, Refunds, Discounts (275)$ (280)$ (284)$ (288)$ (293)$
Total Net Revenue 9,323$ 9,473$ 9,667$ 9,776$ 9,928$
Cost of Goods Sold 3,533$ 3,589$ 3,646$ 3,704$ 3,762$
Gross Profit 5,790$ 5,884$ 6,021$ 6,072$ 6,166$
Expenses
Advertising and Promotion 250$ 256$ 260$ 266$ 271$
Depreciation and Amortization 1,456$ 1,485$ 1,515$ 1,545$ 1,576$
Insurance 15$ 15$ 15$ 16$ 16$
Maintenance 76$ 77$ 80$ 81$ 83$
Office Supplies 38$ 38$ 39$ 40$ 41$
Rent 78$ 79$ 80$ 83$ 84$
Salaries, Benefits & Wages 3,367$ 3,433$ 3,501$ 3,570$ 3,642$
Telcommunication 20$ 21$ 21$ 21$ 22$
Travel 31$ 31$ 32$ 33$ 33$
Utilities 19$ 19$ 20$ 20$ 20$
Other Expense 1 51$ 52$ 53$ 54$ 55$
Other Expense 2
Total Expenses 5,401$ 5,506$ 5,616$ 5,729$ 5,843$
Earnings Before Interest and Taxes 389$ 378$ 405$ 343$ 323$
Interest Expense 30$ 3$ 3$ 3$ 3$
Earnings Before Taxes 359$ 375$ 402$ 340$ 320$
Income taxes 108$ 112$ 107$ 102$ 97$
Net Earnings 251$ 263$ 295$ 238$ 223$
Ratios
Gross Profit % Revenue 62% 62% 62% 62% 62%
Expenses % Revenue 58% 58% 58% 59% 59%
EBIT % Revenue 4% 4% 4% 4% 3%
Net Earnings % Revenue 3% 3% 3% 2% 2%
Business results are the last item in
Module 1 to review, because they are
outcome of all the decisions and metrics
you reviewed in Modules 1 – 9. While it
often seems to make sense to skip right
to this step, it’s important to go through
the process of filling out all the
worksheets. Otherwise, you may reach
incorrect conclusions, or everyone on
your team may reach different
conclusions.
You probably already have your own P&L
statement format, and of course that is
fine to use instead of this one.
Listen. Learn. Lead. DELIVER.
Example Worksheet 10:
Business Results
Cash Flow Statement
Period 1 Period 2 Period 3 Period 4 Period 5
Operating Cash Flow
Net Earnings 2,474$ 11,791$ 21,075$ 26,713$ 28,227$
Plus: Depreciation & Amortization 19,500$ 18,150$ 17,205$ 16,544$ 16,080$
Less: Changes in Working Capital 9,003$ 1,702$ 775$ 903$ 827$
Cash From Operations 12,971$ 28,239$ 37,505$ 42,354$ 43,480$
Investing Cash Flow
Investments in Property and Equipment 15,000$ 15,000$ 15,000$ 15,000$ 15,000$
Cash From Investing 15,000$ 15,000$ 15,000$ 15,000$ 15,000$
Financing Cash Flow
Issuance/(Repayment) of Debt 150,000$ (20,000)$
Issuance/(Repayment) of Equity 20,000$
Cash From Financing 170,000$ -$ (20,000)$ -$ -$
Net Increase/(Decrease) in Cash 167,971$ 13,239$ 2,505$ 27,354$ 28,480$
Opening Cash Balance 167,971$ 181,210$ 183,715$ 211,069$
Closing Cash Balance 167,971$ 181,210$ 183,715$ 211,069$ 239,549$
There is an ongoing debate in the financial
market about which is more important, profit
or cash. The truth is that they are both
important. While you may recognize profit
from an accounting standpoint when you sell
something, you may not actually get the cash
immediately. In the meantime, you have bills
to pay.
Think of cash like oxygen: you need it
constantly to survive. Think of profit like food:
you can go without it for a short term, but to
survive long term we must eat as well as
breathe.
Listen. Learn. Lead. DELIVER.
Worksheet 10: Your Turn
Business Results
P&L and Cash Flow Statements
Cash Flow
Worksheet
Period 1 Period 2 Period 3 Period 4 Period 5
Operating Cash Flow
Net Earnings
Plus: Depreciation & Amortization
Less: Changes in Working Capital
Cash From Operations -$ -$ -$ -$ -$
Investing Cash Flow
Investments in Property and Equipment
Cash From Investing -$ -$ -$ -$ -$
Financing Cash Flow
Issuance/(Repayment) of Debt
Issuance/(Repayment) of Equity
Cash From Financing -$ -$ -$ -$ -$
Net Increase/(Decrease) in Cash -$ -$ -$ -$ -$
Opening Cash Balance -$ -$ -$ -$
Closing Cash Balance -$ -$ -$ -$ -$
Period 1 Period 2 Period 3 Period 4 Period 5
Revenue Stream 1
Revenue Stream 2
Returns, Refunds, Discounts
Total Net Revenue -$ -$ -$ -$ -$
Cost of Goods Sold
Gross Profit -$ -$ -$ -$ -$
Expenses (Change or Add as Needed)
Advertising and Promotion
Depreciation and Amortization
Insurance
Maintenance
Office Supplies
Rent
Salaries, Benefits & Wages
Telcommunication
Travel
Utilities
Other Expense 1
Other Expense 2
Total Expenses -$ -$ -$ -$ -$
Earnings Before Interest and Taxes -$ -$ -$ -$ -$
Interest Expense
Earnings Before Taxes -$ -$ -$ -$ -$
Income taxes
Net Earnings -$ -$ -$ -$ -$
Ratios
Gross Profit % Revenue #DIV/0! #DIV/0! #DIV/0! #DIV/0! #DIV/0!
Expenses % Revenue #DIV/0! #DIV/0! #DIV/0! #DIV/0! #DIV/0!
EBIT % Revenue #DIV/0! #DIV/0! #DIV/0! #DIV/0! #DIV/0!
Net Earnings % Revenue #DIV/0! #DIV/0! #DIV/0! #DIV/0! #DIV/0!
These formats are provided if needed, although generally
businesses will have their own preferred format for financial
statements. Click on the links and fill in the blue cells. The
yellow cells will automatically calculate.
Listen. Learn. Lead. DELIVER.
Example Module 1 Summary
Topic Conclusion
1 Industry Growth Our market is growing at about 5%; our main competitor is growing at 10%, so they are gaining share
2
How The Business Runs
Today
We are a regional company serving the Northeast US with premium priced products that we sell through wholesalers to customers. In 20 years
we have not changed our basic business model
3
Paradigms The industry has always believed that our type of product must be sold face to face because it’s complicated. If someone figures this out, it would
be a major advantage.
4
New v Existing
Customers
An acceptable 30% of our customers are new, but we are not increasing sales to our existing customers
5
Customer
Concentration
We are not overly dependent on a few customers, but we are only reaching out to two different types of customers
6
Demand Generation
Process
We do a pretty good job securing initial interest, but we struggle to convert the interest into qualified leads and turn them over to sales
7
Demand Generation
Tools
We have good Display presence online, but we are limited in our content and we haven’t ever considered giving away samples of what we can do
for customers
8
Supply Side Metrics We have improved our delivery time, and the accuracy of our orders. But we should speed up the time between when the customer places the
order and we fulfill it, which they would like
9
Supply Side Process We use most of the supply processes, such as scenario forecasting and inventory management, but we only use them during the peak business
period.
10
Business Results We are only growing sales at 1% in a market that is growing 8%, so we are losing share. Cost control is good, but we haven’t been increasing
our marketing spend significantly because we aren’t sure how to measure the return from it. Cash is strong, although the majority of our cash
came from a loan we took out the year the business opened. Our main product line is over 80% of our sales. and our secondary line could be sold
to existing and new customers.
Reviewing the main conclusions from each worksheet is the
final step in this Module. Congratulations!
It’s important to step back
and see the big picture. Did
you know that a lion takes
two steps backward in order
to make a big leap forward?
Listen. Learn. Lead. DELIVER.
Module 1 Summary: Your Turn
Topic Conclusion
1 Industry Growth
2
How The Business Runs
Today
3 Paradigms
4 New v Existing Customers
5 Customer Concentration
6
Demand Generation
Process
7 Demand Generation Tools
8 Supply Side Metrics
9 Supply Side Process
10
Business Results
Spend a few minutes looking at each worksheet, and jot down your major conclusions. Each team member should
complete this exercise so they are prepared when the team meets together
Listen. Learn. Lead. DELIVER.
Example Module 1: Putting A Pin In It
Was
Strong and
Stable
Was
Strong and
Growing
Fast
Was Weak
and
Declining
Was Small
and
Growing
Weak
Strong
GrowingDeclining
Pace of Growth
BusinessStrength
Just one more quick thing before we move on. Take a look at this chart, and mark where your business
was right before Covid. This will be used to help determine how dramatic of a change is required.
Listen. Learn. Lead. DELIVER.
Module 1: Your Turn
Putting A Pin In It
Was
Strong and
Stable
Was
Strong and
Growing
Fast
Was Weak
and
Declining
Was Small
and
Growing
Weak
Strong
GrowingDeclining
Pace of Growth
BusinessStrength
Click on the push pin below, and drag it to the
place on the grid which you feel best describes
your business as right before Covid 19
Listen. Learn. Lead. DELIVER.
Great
Work!
Listen. Learn. Lead. DELIVER.
My career has been beyond anything I dreamed of as a little girl,
thanks to the great people whom I have been blessed to work with
at companies like P&G, Newell, Goodyear, AkzoNobel, and Signet
Jewelers. I have worked in product categories as diverse as
mascara, tool boxes, tires, and diamond rings.
I think of my career in three pieces:
 My core capabilities: Listen, Learn, and Lead
 The industries where I have worked: CPG, Durable Goods,
Specialty Retail
 The 3 roles where my skills have been best used: Chief
Marketing Officer, General Manager, and SVP Strategy and
Innovation.
Underlying all of these, at the base, is my commitment to deliver
the results that the organization needs and the customer wants.
As I write this manual, our world is trying to make its way through
the fog of Covid 19, which is profoundly changing all customer
experiences. My hope is that this workbook may, in some way,
help organizations figure out where they want to go and who they
want to be as the fog lifts.
If you would like to reach me, please go to my LinkedIn page:
www.linkedin.com/in/fischer/cathy.
Thank You!
Cathy Fischer
Listen. Learn. Lead. DELIVER.

Mapping the Future - Module 1.0 final

  • 1.
    Listen. Learn. Lead.DELIVER. Listen. Learn. Lead. DELIVER MAPPING THE FUTURE • Version 1.0 , July 2020 © 2020 Cathy Fischer. All rights reserved. A Workbook To Chart Our Course Post Covid-19 MODULE 1
  • 2.
    Listen. Learn. Lead.DELIVER. Purpose And Premise • Covid 19 is a historic disruption in our lives and businesses • Companies of all sizes and across all industries need to determine what to do as a result • Expert advice to respond to this need is available in the market, but it may be: • Too high level/theoretical • Too expensive/slow • Question: what if there was a system – a set of processes and worksheets -- that companies of all sizes could use to determine their own destiny? • The requirements of this system: • Down To Earth . . . Avoid jargon, get to the core of the issue • Invite Participation . . . The real value will be in the discussion the tools facilitate • Flexible . . . Able to be used effectively no matter how much/little data is available • Generate Action . . . Get quickly to the outcome
  • 3.
    Listen. Learn. Lead.DELIVER. System Modules • Module 1: Baseline – Assess organization’s health before Covid 19 • Module 2: Impact – Take stock of current assets • Module 3: Options – Consider choices for future state; choose one • Module 4: Action Plan – Move forward with specific steps • Module 5: Adjust – Assess results, change course if needed Look for me and my friends to see best practices, examples, benchmarks, and help along the way!
  • 4.
    Listen. Learn. Lead.DELIVER. Measure Baseline Review Impact Option 1: Shut Down Option 2: Modify Current Business 2A: Press Your Advantage 2B: Shed Unproductive Parts Action Plan Review and Adjust 2C: Join Forces Option 3: Reinvent Here’s How It Works. . . (Base version, takes about 6 to 8 hours of discussion) Data can be gathered in advance in a day or two Five 30- minute work sessions, can be done as a group or assigned out to individuals TEAM DISCUSSION 2-hour work session, to choose an option Can be assigned out to individuals; then 1-hour team work session Monthly 1- hour team follow up
  • 5.
    Listen. Learn. Lead.DELIVER. MODULE 1 INSTRUCTIONS AND WORKSHEETS Let’s get to work!
  • 6.
    Listen. Learn. Lead.DELIVER. Module 1: Baseline Vital Statistics: 1. Industry Growth 2. How The Business Runs Today 3. Current Paradigms 4. New vs Existing Customers 5. Customer Concentration 6. Demand Generation Funnel 7. Demand Generation Tools 8. Supply Metrics 9. Supply Process 10. Business Results Was Strong and Stable Was Strong and Growing Fast Was Weak and Declining Was Small and Growing Then conclude which of these best described your business at that time A complete view of the business in only 10 worksheets Assess organization’s health going into Covid 19
  • 7.
    Listen. Learn. Lead.DELIVER. Name Annual Sales Growth 2017 2018 2019 Overall Industry Durable Goods 4.3% 6.7% 2.3% Competitor A Safety Glass Inc 5.0% 7.0% 8.0% Competitor B No Fail Glass 2.0% 2.0% 2.0% Competitor C Glass Perfect 10.0% 5.0% 1.0% Imaginary Business: Safety Glass manufacturing company In this example, Safety Glass Inc is growing faster than the market and getting stronger each year, No Fail Glass is growing steadily but at a slower rate than the market, and Glass Perfect is really struggling to keep up. Example Worksheet 1: Industry Growth This is the “gross output” of an industry, which captures total industry sales to end users and to other industries, so it includes B:B and B:C data. If a competitor is growing faster than the industry, they are increasing share. If not, they are losing share. The industry data comes from the Bureau of Economic Analysis. BEA data is free, and there are tutorials on how to use the data. See bea.gov
  • 8.
    Listen. Learn. Lead.DELIVER. Worksheet 1: Your Turn Industry Growth Name Annual Sales Growth 2017 2018 2019 Overall Industry Competitor A Competitor B Competitor C The table to the right shows the percent growth of major industries in the US over the past three years. Pick the industry that is closest to yours and enter the gross output percent change in the table below. Then enter the sales growth of your top three competitors, to the best of your ability IMPORTANT TIP: To enter data into any chart in this presentation, click “Escape” to get out of the Slideshow View and into the Normal View
  • 9.
    Listen. Learn. Lead.DELIVER. Example Worksheet #2: How The Business Runs Today Fill In The Blank (Not Real Information) Industry Retail Trade Target Market(s) Corporate Meetings; Weddings Geography Maine, Vermont, New Hampshire Major Product/Service Lines Made to order cakes and other baked goods Price Position (High, Med, Low) High B to B or B to C? Both. Business to business, and Business to consumer Distribution (Wholesaler, Retailer, Direct To Customer) Direct To Customer through our own bakeries Length of Time In Business 20 years Average Tenure of Senior Management 20 years Any Other Critical Information Uses 3D printing to make cake decorations specific for the customer Have just opened 5 stores in Vermont Imaginary Business: Regional Custom Bakery Today’s teams are especially prone to the problems of “us versus them” thinking and incomplete information. The solution is developing a shared mindset among team members—something team leaders can do by fostering a common understanding. ”The Secrets of Great Teamwork” HBR June 2016
  • 10.
    Listen. Learn. Lead.DELIVER. Worksheet #2: Your Turn How The Business Runs Today Subject Question Your Answer Here Industry What general business category is the company in? If there are several, choose the one that represents the largest part of the business Target Market Who does the company serve? What end users purchase the goods or services the company makes? Geography Is the company local, regional, national, or global? Major Product/Service Lines Even if the company makes thousands of items, group them into their major categories. We might choose different directions for the different products Price Position (High, Med, Low) Compared to the market, is the company low priced, premium priced, or in the middle? If the company bids each job, estimate where most of the bids fall for the jobs you win. B to B or B to C? Business to Business or Business to Consumer? Distribution (Wholesaler, Retailer, Direct To Customer) Does the company sell directly to the end user, or does it go through a retail chain or a wholesaler? Length of Time In Business How long has the company existed in its current form? Average Tenure of Senior Management Consider the key decision makers. How long have they been working in the business or industry Any Other Critical Information This is provided so you can enter data that you think the team will need It’s important to create a common understanding of the business today as we look at options for the future.
  • 11.
    Listen. Learn. Lead.DELIVER. Example Worksheet #3: Current Paradigms List The Most Accepted Industry Paradigms Parents’ and school administrators’ first concern is their children’s safety School children leave home to go to school Walking or bicycling to school is more dangerous than taking a school bus School children hate taking the bus because it takes a long time, but most would have no other way to get to school The type of bus that students ride is different than the type of bus that adult commuters ride School buses hold between 65 and 75 passengers Paradigms are the basic assumptions that are commonly accepted by members of a community. A paradigm shift is required when the existing assumptions can no longer solve current problems. One of the most famous paradigm shifts was in 1539, when Copernicus overturned the doctrine that the sun revolves around the earth with his theory that the earth is one of a number of planets revolving around the sun. Imaginary Business: National company that provides school bus transportation and drivers for public schools Related Industries: Transportation, Education
  • 12.
    Listen. Learn. Lead.DELIVER. Worksheet #3: Your Turn Current Paradigms List The Most Accepted Industry Paradigms Today Some examples: Goods can always be made less expensively overseas; People will only buy an expensive item if they see it in person; Cars everywhere require fossil fuel; Companies will forever need security systems A paradigm is a belief that is generally held to be true in a particular community or industry. It’s important to list the current paradigms in your industry, because innovation often comes by re-examining those. Think of sentences that use definitive words like “always”, “everywhere”, “only”, “forever” and so on
  • 13.
    Listen. Learn. Lead.DELIVER. Example Worksheet 4: New vs Existing Customer Contribution Existing Customer Average Spend At least 30% of the company’s customers are new, which is good However, the average sales to existing customers are not going up. This is worth discussion to see if it’s a problem A strong customer profile has a sufficient stream of new customers (at least 30%) and increases the spend of existing customers every year - Forbes 6/2016 2017 2018 2019 Total sales each year 2,000,000$ 2,300,000$ 2,350,000$ How many total customers did you serve each year? (Enter number) 400 500 550 What percent of your customers were new? (Enter number) 20% 25% 30% Did you have at least 30% new customers? 30% allows you to refresh your customer base every three years. (Enter YES or NO) no no yes The percent of customers who were existing: 80% 75% 70% The number of existing customers: 320 375 385 What were your sales from existing or returning customers (Enter number, estimate if needed) 1,750,000$ 2,000,000$ 2,000,000$ Average annual sales per existing customer: 5,469$ 5,333$ 5,195$ Are your average sales from existing customers increasing each year? (Enter YES or NO) no no no
  • 14.
    Listen. Learn. Lead.DELIVER. Worksheet 4: Your Turn New vs Existing Customer Contribution Existing Customer Average Spend A strong customer profile has a sufficient stream of new customers (at least 30%), and increases the spend of existing customers every year. The picture to the right shows the tests for new customers and existing customer spend. Click on the link below and enter the data as instructed in the blue cells. The yellow cells will automatically calculate Period 1 Period 2 Period 3 Total sales each year How many total customers did you serve each year? (Enter number) What percent of your customers were new? (Enter number) Did you have at least 30% new customers? 30% allows you to refresh your customer base every three years. (Enter YES or NO) The percent of customers who were existing: The number of existing customers: What were your sales from existing or returning customers (Enter number, estimate if needed) Average annual sales per existing customer: Are your average sales from existing customers increasing each year? (Enter YES or NO) Time Period (Can be Year, Quarter, or Month) Although the spreadsheet should automatically save your data, it’s a good idea to save it under a different name as well New v Existing
  • 15.
    Listen. Learn. Lead.DELIVER. Example Worksheet 5: Customer Concentration Test 1 and 2 The company has medium risk in their total number of customers. They have medium to high risk in the fact that they only have two types of customers. Higher Risk Lower Risk Concentration Test #1 1 to 10 11 to 50 51 to 100 100 to 200 over 200 What Is Your Total Number of Customers? (Type X in the appropriate cell) x Concentration Test #2 1 2 3 4 5 or more How many different types of customers do you have? (Type x in the appropriate cell) x Customer concentration is another way to see how healthy your customer mix is. There are 3 tests to consider: 1. How many active customers do you have (more is better) 2. How many different types of customers do you have (more is better) The 3rd test is on the next page
  • 16.
    Listen. Learn. Lead.DELIVER. Example Worksheet 5: Customer Concentration Test 3 This company’s sales are not overly concentrated in any one customer, which is good. This helps to insulate them from overly depending on any one customer. Customer concentration is another way to see how healthy your customer mix is. The 3rd test to consider is: 3. What percent of your sales comes from your top customers? (10% is the suggested ceiling for your largest customer, and 25% for your top 5 customers put together) Concentration Test #3 Enter data into each blue cell Total Annual Sales in the last period (can be the year, the past 6 months, or the past quarter) 25,000,000$ 2019 Annual Sales (Enter Amount For Each Customer) Customer #1 Joe James 1,000,000$ Customer #2 Smith Bros 900,000$ Customer #3 KLG Co 800,000$ Customer #4 Crown 650,000$ Customer #5 Howard's 650,000$ Customer #6 Woth Industries 500,000$ Customer #7 JenLaur Inc 495,000$ Customer #8 Oscar Young 450,000$ Customer #9 Casper Co 250,000$ Customer #10 DGF Ltd Total For Customers 1 - 5 4,000,000$ Total For Customers 1 - 10 5,695,000$ Percent of Sales From Top Customer 4% Percent of Sales From Top 5 Customers 16% Percent of Sales From Top 10 Customers 23% CONCENTRATION RISK Is Customer #1 More Than 10% of your Total Sales? No Are Customers 1-5 More Than 25% of Your Total Sales? No Are Customers 1-10 More Than 50% of Your Total Sales? No
  • 17.
    Listen. Learn. Lead.DELIVER. Worksheet 5: Your Turn Customer Concentration Tests 1, 2, 3 The picture to the right shows these tests. Click on the link below to open the excel file and enter data as instructed. The yellow cells will automatically calculate. Concentration Test #1 Higher Risk Lower Risk 1 to 10 11 to 50 51 to 100 100 to 200 over 200 What Is Your Total Number of Customers? (Type x in the appropriate cell) Concentration Test #2 1 2 3 4 5 or more How many different types of customers do you have? (Type x in the appropriate cell) Building Example: Residential and Commerciall Restaurant Example: Breakfast, Dinner, and Lunch Hair Salon Example: Male, Child, Formal Occasion Female, Regular Female Concentration Test #3 Enter data into each blue cell Total Annual Sales in the last period (can be the year, the past 6 months, or the past quarter) 2019 Annual Sales (Enter Amount For Each Customer) Customer #1 (Enter Name Here) Customer #2 (Enter Name Here) Customer #3 (Enter Name Here) Customer #4 (Enter Name Here) Customer #5 (Enter Name Here) Customer #6 (Enter Name Here) Customer #7 (Enter Name Here) Customer #8 (Enter Name Here) Customer #9 (Enter Name Here) Customer #10 (Enter Name Here) Total For Customers 1 - 5 -$ Total For Customers 1 - 10 -$ Percent of Sales From Top Customer #DIV/0! Percent of Sales From Top 5 Customers #DIV/0! Percent of Sales From Top 10 Customers #DIV/0! CONCENTRATION RISK Is Customer #1 More Than 10% of your Total Sales? #DIV/0! Are Customers 1-5 More Than 25% of Your Total Sales? #DIV/0! Are Customers 1-10 More Than 50% of Your Total Sales? #DIV/0! Cust Concentration
  • 18.
    Listen. Learn. Lead.DELIVER. Example Worksheet 6: Demand Generation Funnel FUNNEL STAGE Excellent Very Strong Okay Needs Help Poor Tools -- how many different ways do you reach out to possible customers? x All Contacts – how strong is your system at capturing the names and information of people who contact you? x Qualified Leads - -how strong is your system at understanding the specific need that the possible customer has, so you can determine if you can help them? x Good Prospects – how strong is your system at turning over the leads generated from Marketing to the Sales team to act on? x Priority Opportunities – how strong is your system at evaluating the sales potential of each prospect to help determine your focus? x “Demand generation” is the entire set of marketing and sales activities that turn potential customers into long term clients. Thinking about this as a funnel helps to visualize what your system looks like
  • 19.
    Listen. Learn. Lead.DELIVER. Worksheet 6: Your Turn Demand Generation Funnel Demand Generation Tools All Contacts Qualified Leads Good Prospects Priority Opportunities A complete demand generation funnel is shown on the right. Click on the link below to fill in your self assessment. If you don’t have data, just provide your opinion. Demand Funnel
  • 20.
    Listen. Learn. Lead.DELIVER. Example Worksheet 7: Demand Generation Tools Demand generation tools are the approaches you use at the very beginning of a customer relationship to get the customer into the funnel. There are many different demand generation tools, as shown on the right. Demand Generation Tool Never, and we haven't even considered it Never, but we have talked about it We tried it in the past or use it in specific situations We use this frequently and are really familiar with it We use this all the time SCORE Give away a sample of your best stuff x 4 Make and provide a useful tool, app, or resource x 2 Use Lookalike audiences on Facebook x 1 Use Managed placements in Display advertising x 2 Invest more in Content Creation x 2 Improve your email strategy x 5 Implement a lead scoring system x 5 YOUR FINAL SCORE 21 YOUR RATING BELOW OPPORTUNITY Strong Medium Opportunity Novice My company's usage of this tool (enter "x" in the correct column) You are well on your way to using the best demand generation tools in the market. Choose what's working best and do more You have been using some of the tools available to you, but there are obvious areas that could be improved You are dabbling in demand generation, which is great, but there is probably a lot more business to be gained by deploying more tools The world is your oyster. Because you are just starting out applying digital demand generation tools, the upside for you is terrific!
  • 21.
    Listen. Learn. Lead.DELIVER. Worksheet 7: Your Turn Demand Generation Tools When you open the worksheet, you will see the explanation of the demand generation tool, along with an example. This will allow you to easily score your use of demand generation tools. Click on the link below to open the excel file and enter data as instructed. Your overall rating will be automatically generated from your answers. Demand Generation Tool Comment Example Give away a sample of your best stuff This creates trust, reflects well on your brand, and makes potential customers more willing to give you information that you can then use to qualify them as leads An athletic club offers a free visit, or a hair care company provides shampoo samples Make and provide a useful tool, app, or resource Similar to giving away your best stuff, this approach provides a way for potential customers to interact with your brand in a positive way before buying A restaurant provides recipes of their popular dishes Use Lookalike audiences on Facebook This approach allows you to significantly increase the reach of your Facebook campaigns by creating a custom audience that has the same characteristics of your current customers. Just pop into Facebook, put "create a custom audience" into the search bar, and follow the tutorial. It can be as inexpensive as $100 to try this. A painting company creates a custom audience based on the demographics of their most profitable customers Use Managed placements in Display advertising Managed placements allow your company to more effectively control who sees their ads, limiting the audience to those who are more likely to respond. A construction company places display ads on Google that reach people who have previously been on their website Invest more in Content Creation This basically means to make what you say and what you show to potential customers more persuasive. If you write blogs, are you offering fresh perspective? If you have photos of successful projects, do they look as inviting as possible? A cupcake bakery creates mouth watering pictures of their cupcakes Improve your email strategy Test, test, test. Try different headlines, different visuals, or different offers. Keep your email contacts interested in opening up your (digital) envelope. An accounting firm tests one email that says "find out more" compared to another that says "click for us to call you" Implement a lead scoring system If you have more leads than you can service, it can be very effective to implement a scoring system. Use the behaviors of your most profitable customers as a model, and score possible customers based on that same behavior A commercial artist realizes that her best leads come from word of mouth referrals, so she makes cards that her customers can hand out Demand Generation Tools
  • 22.
    Listen. Learn. Lead.DELIVER. Introduction To Worksheets 8 and 9: Supply Side The supply chain includes all the parts of the business that happen after the customer places their order for the product or service. It includes forecasting the demand for the future, procuring raw materials, making the product or service, delivering it to the customer and getting paid for it. A healthy supply chain is critical to ongoing profits. Since the supply chain has a lot of moving parts, there are two challenges to evaluating it: 1. Figuring out what the most important measurements are, because there are hundreds of options. In this case, we are measuring  Five specific metrics (Worksheet 8): perfect order percent, cash to cash cycle time, inventory days of supply, customer order cycle time, and cost of supply chain.  Seven specific processes (Worksheet 9): measurement system, forecasting, customer review, supplier review, quality control, inventory management, transportation measurement. 2. Figuring out what the “right” score should be on whatever you are measuring. The truth is, getting to a specific number is less important than making continuous improvement. Start wherever you are, and build from there Note: if you run a service business, you may think that the supply side doesn’t really apply to you. However, most of the concepts of great supply chain are relevant and measurable in a service business. According to a survey by Deloitte from 2014, 79% of companies with high-performing supply chains achieve revenue growth superior to the average within their industries. Conversely, just 8% of businesses with less capable supply chains report above-average growth.
  • 23.
    Listen. Learn. Lead.DELIVER. Example Worksheet 8: Supply Side Metrics We are looking at these 5 metrics: 1. Perfect Order – for this company, the percent of their orders that are “perfect” is increasing every time period. Good news! 2. Inventory Days Supply – for this company, the inventory days supply increased from period 2 to period 3. Normally this is not a good sign, although in an emergency situation a company might want to increase their supply to serve customers 3. Cash to Cash Cycle Time – for this company, the cash to cash cycle time increased a little bit from the 2nd to the 3rd period, but it’s well below where the company started. Good news overall. 4. Customer Order Cycle Time – for this company, the customer order cycle time is basically unchanged over time. 5. Cost of Supply – for this customer, the cost of supply as a percent of their total sales is going down over time. Good news MEASUREMENT AND DESCRIPTION Period 1 Period 2 Period 3 QUESTION BELOW Enter YES or NO in the blue cell PERFECT ORDER: The error free rate of the entire supply chain 57% 69% 80% Is the percent of perfect orders getting higher over time? yes Good News ENTER DATA INTO EACH BLUE CELL On Time Delivery: The percent of orders which are delivered on time 83% 91% 97% In Full Delivery: The percent of orders where the customer receives exactly what they ordered, in the right quantity 90% 94% 95% Damage Free Delivery: The percent of orders which arrive in the right condition 80% 85% 96% Accurate Documentation: The percent of orders which receive accurate documentation during the whole process, including information on delivery date and accurate billing information 95% 95% 90% INVENTORY DAYS OF SUPPLY: The number of days your inventory would last without replenishment, before running out. 75 50 60 Is the inventory days of supply getting lower over time? no May Need Attention ENTER DATA INTO EACH BLUE CELL The total quantity of products you have in stock, in units 500 500 1000 The average number of products sold each month, in units 200 300 500 The average number of products sold each day, in units 7 10 17 CASH TO CASH CYCLE TIME: The time between when a company sends cash to suppliers, and when it receives cash from customers 90 45 50 Is the cash to cash cycle time getting shorter over time? yes Good News ENTER DATA INTO EACH BLUE CELL Days of Inventory - how many days of product can you supply from what you have on hand? 75 50 60 Days Payable - how many days you can wait before paying suppliers 30 45 50 Days Receivable - how many days it takes to receive payment 45 40 40 CUSTOMER ORDER CYCLE TIME: The number of days between receipt of a purchase order and customer delivery Is the customer order cycle time getting shorter over time? no May Need Attention ENTER HOW MANY DAYS IT TAKES BETWEEN WHEN YOU RECEIVE AN ORDER AND WHEN YOU DELIVER IT 40 35 40 COST OF SUPPLY: The total cost of the supply chain system divided by the total sales, excluding the cost of the product 53% 32% 21% Is the percent of your sales that you are spending on the supply chain getting lower over time? yes Good News ENTER DATA INTO EACH BLUE CELL Salaries of people who purchase your raw material, forecast your sales, take the orders, manage the warehouse, make your product, transport your finished product, bill and collect payment from the customer, and handle any customer service issues $ 10,000 $ 15,000 20,000$ Cost of transporting the product, whether by mail, by truck, by courier, by plane, or by any other method $ 400 $ 450 500$ Cost of warehousing, such as real estate rental $ 200 $ 300 400$ Total cost 10,600$ 15,750$ 20,900$ Total sales $ 20,000 $ 50,000 100,000$ ANALYSIS AND DATA ENTRY AREA EVALUATION AREA Time Periods (These can be months, quarters, or years)
  • 24.
    Listen. Learn. Lead.DELIVER. Worksheet 8: Your Turn Supply Side Metrics Each of these metrics will be automatically calculated in the yellow cells when you input the data in the blue cells. If you don’t have accurate data, just put in your best estimate. When you are done entering the data, answer the questions “yes” or “no” in the Evaluation area, and the worksheet will tell you if an area needs focus Don’t be put off by complexity of this worksheet: it will make sense once you are working with it. Click on the link below to open the metrics worksheet: MEASUREMENT AND DESCRIPTION Period 1 Period 2 Period 3 QUESTION BELOW Enter Yes or No in the blue cell This cell will automatically change based on your entry PERFECT ORDER: The error free rate of the entire supply chain process 0% 0% 0% Is the percent of perfect orders getting higher over time? May Need Attention ENTER DATA INTO EACH BLUE CELL On Time Delivery: The percent of orders which are delivered on time In Full Delivery: The percent of orders which are delivered completely (the customer receives the right items, in the right quantities) Damage Free Delivery: The percent of orders which arrive in the right condition Accurate Documentation: The percent of orders which receive accurate documentation during the whole process, including information on delivery date and accurate billing information CASH TO CASH CYCLE TIME: The time between when a company sends cash to suppliers, and when it receives cash from customers 0 0 0 Is the cash to cash cycle time getting shorter over time? May Need Attention ENTER DATA INTO EACH BLUE CELL Days of Inventory - how many days of product you have on hand Days Payable - how long you can wait before paying suppliers Days Receivable - how long it takes to receive payment INVENTORY DAYS OF SUPPLY: The number of days your inventory would last without replenishment, before running out. #DIV/0! #DIV/0! #DIV/0! Is the inventory days of supply getting lower over time? May Need Attention ENTER DATA INTO EACH BLUE CELL The total quantity of products you have in stock, in units The average number of products sold each month, in units The average number of products sold each day, in units 0 0 0 CUSTOMER ORDER CYCLE TIME: The number of days between receipt of a purchase order and customer delivery Is the customer order cycle time getting shorter over time? May Need Attention ENTER HOW MANY DAYS IT TAKES BETWEEN WHEN YOU RECEIVE AN ORDER AND WHEN YOU DELIVER IT COST OF SUPPLY: The total cost of the supply chain system divided by the total sales, excluding the cost of the product #DIV/0! #DIV/0! #DIV/0! Is the percent of your sales that you are spending on the supply chain getting lower over time? May Need Attention ENTER DATA INTO EACH BLUE CELL Salaries of people who purchase your raw material, forecast your sales, take the orders, manage the warehouse, make your product, transport your finished product, bill and collect payment from the customer, and handle any customer service issues Cost of transporting the product, whether by mail, by truck, by courier, by plane, or by any other method Cost of warehousing, such as real estate rental Total cost 0 0 0 Total sales Time Periods (These can be months, quarters, or years) ANALYSIS AND DATA ENTRY AREA EVALUATION AREA Supply Chain Metrics
  • 25.
    Listen. Learn. Lead.DELIVER. Example Worksheet 9: Supply Side Process There are 7 processes that are key to a strong supply chain: 1. Measurement 2. Forecasting 3. Regular Supplier Review 4. Regular Customer Review 5. Quality Control 6. Inventory Management 7. Transportation Management Depending on which box you “x”, the score will calculate. The final score will be shown below. Remember, the important point isn’t what your score is today. It’s what you will do to keep improving your score over time. This company’s Supply Chain rates as an “opportunity”. Focusing on making supply chain process improvements should show immediate results Core Supply Chain Process Never, and we haven't even considered it Never, but we have talked about it We tried it in the past or use it in specific times of the year We use this frequently and are really familiar with it We use this all the time and we could teach others how to do it SCORE Metrics x 2 Forecasting x 3 Regular Supplier Review x 4 Regular Customer Review x 4 Quality Control x 3 Inventory Management x 3 Transportation Management x 2 YOUR TOTAL SCORE 21 YOUR RATING BELOW OPPORTUNITY Strong Medium Opportunity Novice My company's usage of this process (enter "X" in the correct column) You are well on your way to using the best supply chain processes in the market. Choose what's working best and do more You have been using some of the Supply Chain processes available to you, but there are obvious areas that could be improved You are dabbling in Supply Chain processes, which is great, but there is probably a lot more business to be gained by using more of them The world is your oyster. Because you are just starting out applying Supply Chain processes, the upside for you is terrific!
  • 26.
    Listen. Learn. Lead.DELIVER. Worksheet 9: Your Turn Supply Side Process When you open this file, you will see a description of the 7 processes that are key to a strong supply chain. This will help you evaluate your capability in this area. Click on the link below to open the process worksheet Supply Chain Process Core Supply Chain Process Description Never, and we haven't even considered it Never, but we have talked about it We tried it in the past or use it in specific times of the year We use this frequently and are really familiar with it We use this all the time and we could teach others how to do it SCORE Metrics Agreement upon what measurements are important, accurate and regular measurement of those items, putting those measurements into a form that all the team members can understand , and sharing them regularly #N/A Forecasting Calculating how many jobs or orders your company expects to receive in the future, comparing that information to actual historical information, and discussing the assumptions of the forecast on a regular basis. The discussion can be weekly, monthly, quarterly, or any other time frame, as long as it happens regularly #N/A Regular Supplier Review At least annually, discussing with each of your most important suppliers how well they are meeting your needs in terms of quality, timeliness, and cost. Developing a plan for improvement, writing it down, and tracking their performance #N/A Regular Customer Review Obtaining ongoing information from your customers about how well you are meeting their needs in terms of quality, timeliness, and cost. Developing a plan for improvement, writing it down, and tracking your performance regularly #N/A Quality Control Defining your quality standards in a factual way. Inspecting incoming raw materials to ensure they meet your standards, and then inspecting the finished good or sevice you provide before you give it to the customer to ensure it meets your standards. #N/A Inventory Management Defining how inventory should be received, stored, and counted on a regular basis, and then tracking how you are doing against those goals #N/A Transportation Management Reviewing how your products are delivered to your customers, and making sure that this is happening in the most efficient way that best meets the customer needs. If necessary, having different levels of delivery timing available at different prices #N/A YOUR TOTAL SCORE #N/A YOUR RATING BELOW #N/A Strong Medium Opportunity Novice My company's usage of this process (enter "X" in the correct column) You are well on your way to using the best supply chain processes in the market. Choose what's working best and do more You have been using some of the Supply Chain processes available to you, but there are obvious areas that could be improved You are dabbling in Supply Chain processes, which is great, but there is probably a lot more business to be gained by using more of them The world is your oyster. Because you are just starting out applying Supply Chain processes, the upside for you is terrific!
  • 27.
    Listen. Learn. Lead.DELIVER. Example Worksheet 10: Business Results P&L Statement Period 1 Period 2 Period 3 Period 4 Period 5 Revenue Stream 1 7,690$ 7,815$ 7,983$ 8,064$ 8,190$ Revenue Stream 2 1,908$ 1,938$ 1,968$ 2,000$ 2,031$ Returns, Refunds, Discounts (275)$ (280)$ (284)$ (288)$ (293)$ Total Net Revenue 9,323$ 9,473$ 9,667$ 9,776$ 9,928$ Cost of Goods Sold 3,533$ 3,589$ 3,646$ 3,704$ 3,762$ Gross Profit 5,790$ 5,884$ 6,021$ 6,072$ 6,166$ Expenses Advertising and Promotion 250$ 256$ 260$ 266$ 271$ Depreciation and Amortization 1,456$ 1,485$ 1,515$ 1,545$ 1,576$ Insurance 15$ 15$ 15$ 16$ 16$ Maintenance 76$ 77$ 80$ 81$ 83$ Office Supplies 38$ 38$ 39$ 40$ 41$ Rent 78$ 79$ 80$ 83$ 84$ Salaries, Benefits & Wages 3,367$ 3,433$ 3,501$ 3,570$ 3,642$ Telcommunication 20$ 21$ 21$ 21$ 22$ Travel 31$ 31$ 32$ 33$ 33$ Utilities 19$ 19$ 20$ 20$ 20$ Other Expense 1 51$ 52$ 53$ 54$ 55$ Other Expense 2 Total Expenses 5,401$ 5,506$ 5,616$ 5,729$ 5,843$ Earnings Before Interest and Taxes 389$ 378$ 405$ 343$ 323$ Interest Expense 30$ 3$ 3$ 3$ 3$ Earnings Before Taxes 359$ 375$ 402$ 340$ 320$ Income taxes 108$ 112$ 107$ 102$ 97$ Net Earnings 251$ 263$ 295$ 238$ 223$ Ratios Gross Profit % Revenue 62% 62% 62% 62% 62% Expenses % Revenue 58% 58% 58% 59% 59% EBIT % Revenue 4% 4% 4% 4% 3% Net Earnings % Revenue 3% 3% 3% 2% 2% Business results are the last item in Module 1 to review, because they are outcome of all the decisions and metrics you reviewed in Modules 1 – 9. While it often seems to make sense to skip right to this step, it’s important to go through the process of filling out all the worksheets. Otherwise, you may reach incorrect conclusions, or everyone on your team may reach different conclusions. You probably already have your own P&L statement format, and of course that is fine to use instead of this one.
  • 28.
    Listen. Learn. Lead.DELIVER. Example Worksheet 10: Business Results Cash Flow Statement Period 1 Period 2 Period 3 Period 4 Period 5 Operating Cash Flow Net Earnings 2,474$ 11,791$ 21,075$ 26,713$ 28,227$ Plus: Depreciation & Amortization 19,500$ 18,150$ 17,205$ 16,544$ 16,080$ Less: Changes in Working Capital 9,003$ 1,702$ 775$ 903$ 827$ Cash From Operations 12,971$ 28,239$ 37,505$ 42,354$ 43,480$ Investing Cash Flow Investments in Property and Equipment 15,000$ 15,000$ 15,000$ 15,000$ 15,000$ Cash From Investing 15,000$ 15,000$ 15,000$ 15,000$ 15,000$ Financing Cash Flow Issuance/(Repayment) of Debt 150,000$ (20,000)$ Issuance/(Repayment) of Equity 20,000$ Cash From Financing 170,000$ -$ (20,000)$ -$ -$ Net Increase/(Decrease) in Cash 167,971$ 13,239$ 2,505$ 27,354$ 28,480$ Opening Cash Balance 167,971$ 181,210$ 183,715$ 211,069$ Closing Cash Balance 167,971$ 181,210$ 183,715$ 211,069$ 239,549$ There is an ongoing debate in the financial market about which is more important, profit or cash. The truth is that they are both important. While you may recognize profit from an accounting standpoint when you sell something, you may not actually get the cash immediately. In the meantime, you have bills to pay. Think of cash like oxygen: you need it constantly to survive. Think of profit like food: you can go without it for a short term, but to survive long term we must eat as well as breathe.
  • 29.
    Listen. Learn. Lead.DELIVER. Worksheet 10: Your Turn Business Results P&L and Cash Flow Statements Cash Flow Worksheet Period 1 Period 2 Period 3 Period 4 Period 5 Operating Cash Flow Net Earnings Plus: Depreciation & Amortization Less: Changes in Working Capital Cash From Operations -$ -$ -$ -$ -$ Investing Cash Flow Investments in Property and Equipment Cash From Investing -$ -$ -$ -$ -$ Financing Cash Flow Issuance/(Repayment) of Debt Issuance/(Repayment) of Equity Cash From Financing -$ -$ -$ -$ -$ Net Increase/(Decrease) in Cash -$ -$ -$ -$ -$ Opening Cash Balance -$ -$ -$ -$ Closing Cash Balance -$ -$ -$ -$ -$ Period 1 Period 2 Period 3 Period 4 Period 5 Revenue Stream 1 Revenue Stream 2 Returns, Refunds, Discounts Total Net Revenue -$ -$ -$ -$ -$ Cost of Goods Sold Gross Profit -$ -$ -$ -$ -$ Expenses (Change or Add as Needed) Advertising and Promotion Depreciation and Amortization Insurance Maintenance Office Supplies Rent Salaries, Benefits & Wages Telcommunication Travel Utilities Other Expense 1 Other Expense 2 Total Expenses -$ -$ -$ -$ -$ Earnings Before Interest and Taxes -$ -$ -$ -$ -$ Interest Expense Earnings Before Taxes -$ -$ -$ -$ -$ Income taxes Net Earnings -$ -$ -$ -$ -$ Ratios Gross Profit % Revenue #DIV/0! #DIV/0! #DIV/0! #DIV/0! #DIV/0! Expenses % Revenue #DIV/0! #DIV/0! #DIV/0! #DIV/0! #DIV/0! EBIT % Revenue #DIV/0! #DIV/0! #DIV/0! #DIV/0! #DIV/0! Net Earnings % Revenue #DIV/0! #DIV/0! #DIV/0! #DIV/0! #DIV/0! These formats are provided if needed, although generally businesses will have their own preferred format for financial statements. Click on the links and fill in the blue cells. The yellow cells will automatically calculate.
  • 30.
    Listen. Learn. Lead.DELIVER. Example Module 1 Summary Topic Conclusion 1 Industry Growth Our market is growing at about 5%; our main competitor is growing at 10%, so they are gaining share 2 How The Business Runs Today We are a regional company serving the Northeast US with premium priced products that we sell through wholesalers to customers. In 20 years we have not changed our basic business model 3 Paradigms The industry has always believed that our type of product must be sold face to face because it’s complicated. If someone figures this out, it would be a major advantage. 4 New v Existing Customers An acceptable 30% of our customers are new, but we are not increasing sales to our existing customers 5 Customer Concentration We are not overly dependent on a few customers, but we are only reaching out to two different types of customers 6 Demand Generation Process We do a pretty good job securing initial interest, but we struggle to convert the interest into qualified leads and turn them over to sales 7 Demand Generation Tools We have good Display presence online, but we are limited in our content and we haven’t ever considered giving away samples of what we can do for customers 8 Supply Side Metrics We have improved our delivery time, and the accuracy of our orders. But we should speed up the time between when the customer places the order and we fulfill it, which they would like 9 Supply Side Process We use most of the supply processes, such as scenario forecasting and inventory management, but we only use them during the peak business period. 10 Business Results We are only growing sales at 1% in a market that is growing 8%, so we are losing share. Cost control is good, but we haven’t been increasing our marketing spend significantly because we aren’t sure how to measure the return from it. Cash is strong, although the majority of our cash came from a loan we took out the year the business opened. Our main product line is over 80% of our sales. and our secondary line could be sold to existing and new customers. Reviewing the main conclusions from each worksheet is the final step in this Module. Congratulations! It’s important to step back and see the big picture. Did you know that a lion takes two steps backward in order to make a big leap forward?
  • 31.
    Listen. Learn. Lead.DELIVER. Module 1 Summary: Your Turn Topic Conclusion 1 Industry Growth 2 How The Business Runs Today 3 Paradigms 4 New v Existing Customers 5 Customer Concentration 6 Demand Generation Process 7 Demand Generation Tools 8 Supply Side Metrics 9 Supply Side Process 10 Business Results Spend a few minutes looking at each worksheet, and jot down your major conclusions. Each team member should complete this exercise so they are prepared when the team meets together
  • 32.
    Listen. Learn. Lead.DELIVER. Example Module 1: Putting A Pin In It Was Strong and Stable Was Strong and Growing Fast Was Weak and Declining Was Small and Growing Weak Strong GrowingDeclining Pace of Growth BusinessStrength Just one more quick thing before we move on. Take a look at this chart, and mark where your business was right before Covid. This will be used to help determine how dramatic of a change is required.
  • 33.
    Listen. Learn. Lead.DELIVER. Module 1: Your Turn Putting A Pin In It Was Strong and Stable Was Strong and Growing Fast Was Weak and Declining Was Small and Growing Weak Strong GrowingDeclining Pace of Growth BusinessStrength Click on the push pin below, and drag it to the place on the grid which you feel best describes your business as right before Covid 19
  • 34.
    Listen. Learn. Lead.DELIVER. Great Work!
  • 35.
    Listen. Learn. Lead.DELIVER. My career has been beyond anything I dreamed of as a little girl, thanks to the great people whom I have been blessed to work with at companies like P&G, Newell, Goodyear, AkzoNobel, and Signet Jewelers. I have worked in product categories as diverse as mascara, tool boxes, tires, and diamond rings. I think of my career in three pieces:  My core capabilities: Listen, Learn, and Lead  The industries where I have worked: CPG, Durable Goods, Specialty Retail  The 3 roles where my skills have been best used: Chief Marketing Officer, General Manager, and SVP Strategy and Innovation. Underlying all of these, at the base, is my commitment to deliver the results that the organization needs and the customer wants. As I write this manual, our world is trying to make its way through the fog of Covid 19, which is profoundly changing all customer experiences. My hope is that this workbook may, in some way, help organizations figure out where they want to go and who they want to be as the fog lifts. If you would like to reach me, please go to my LinkedIn page: www.linkedin.com/in/fischer/cathy. Thank You! Cathy Fischer Listen. Learn. Lead. DELIVER.