Download to read offline
![Management Practices for Sustainable Growth-Focus India as if People and Environment Matter Presentation by Prof.K.Prabhakar [email_address]](https://image.slidesharecdn.com/managementpracticesforsustainablegrowth-100806111241-phpapp01/85/Management-practices-for-sustainable-growth-1-320.jpg)
![Management Practices for Sustainable Growth-Focus India as if People and Environment Matter Presentation by Prof.K.Prabhakar [email_address]](https://image.slidesharecdn.com/managementpracticesforsustainablegrowth-100806111241-phpapp01/75/Management-practices-for-sustainable-growth-1-2048.jpg)

![Thank you If you have any questions please do send you mail to [email_address]](https://image.slidesharecdn.com/managementpracticesforsustainablegrowth-100806111241-phpapp01/85/Management-practices-for-sustainable-growth-49-320.jpg)

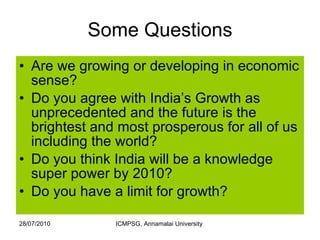
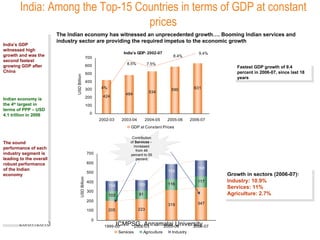
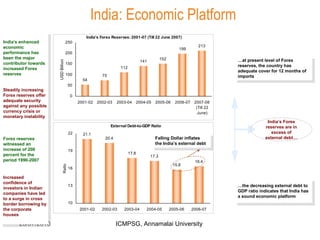
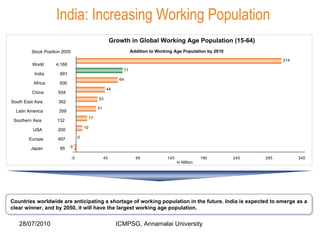
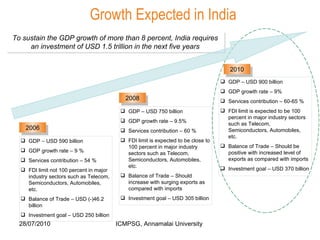
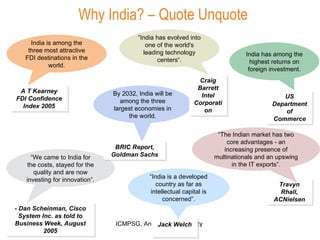
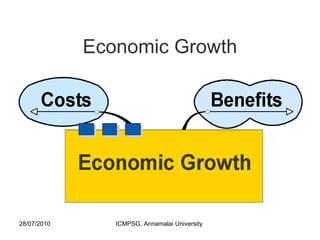
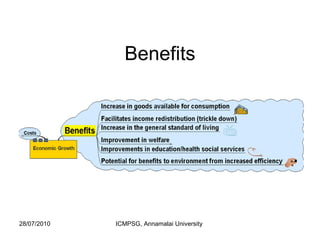
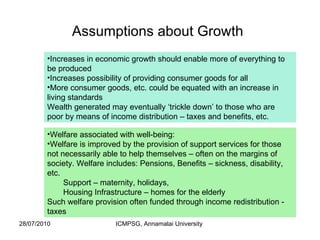
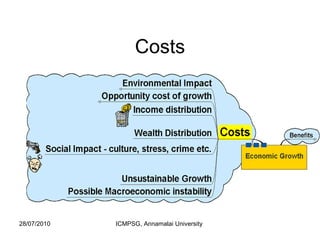
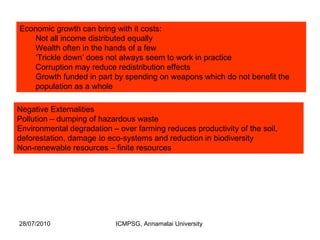
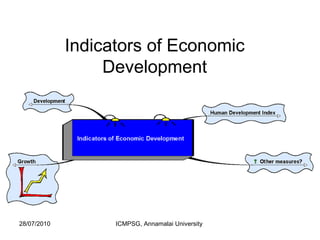
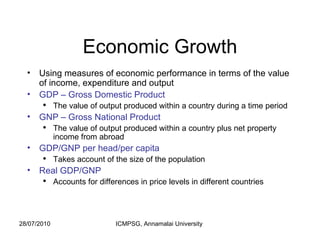
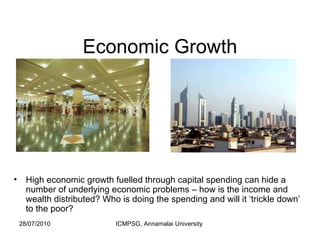
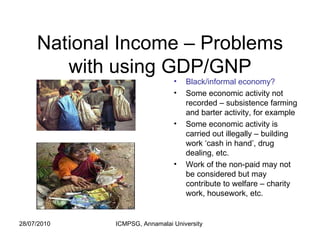
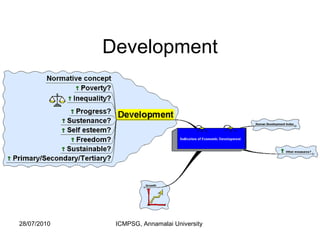
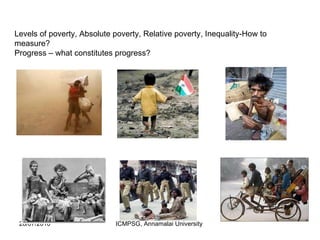
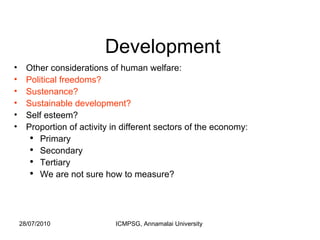
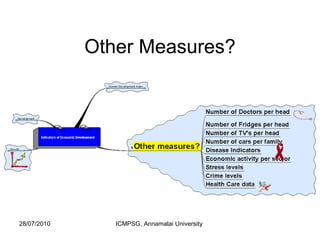
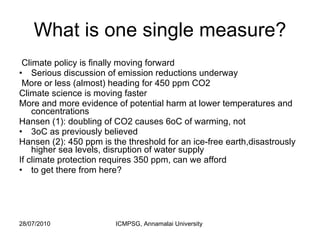
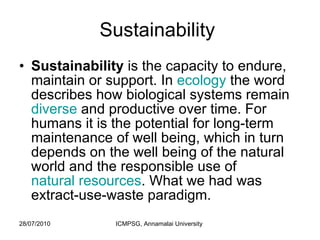
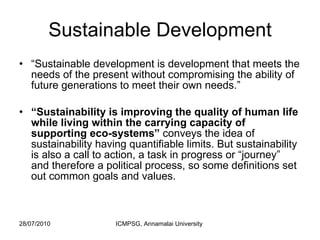
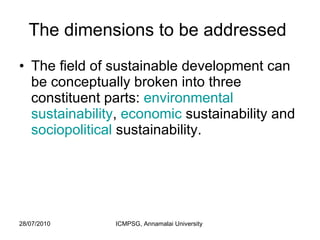
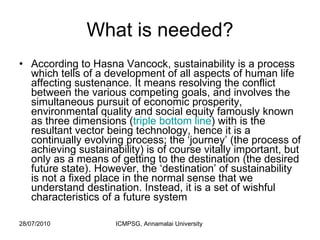
The document discusses sustainable growth and management practices in India. It begins by raising questions about India's economic growth and whether it benefits people and the environment. It then covers topics like India's strong economic performance and GDP growth, factors driving growth, and challenges like resource depletion that limit growth. It emphasizes the need for sustainable growth that improves living standards while protecting the environment and ensuring welfare for all. Management practices must consider economic, social and environmental dimensions of sustainability.


![Eco 8th Lecture[1]](https://cdn.slidesharecdn.com/ss_thumbnails/eco8thlecture1-12532565523311-phpapp02-thumbnail.jpg?width=640&height=640&fit=bounds)


![The Crooked Timber of New India [Autosaved].pptx](https://cdn.slidesharecdn.com/ss_thumbnails/thecrookedtimberofnewindiaautosaved-240302045121-e57b6550-thumbnail.jpg?width=640&height=640&fit=bounds)


