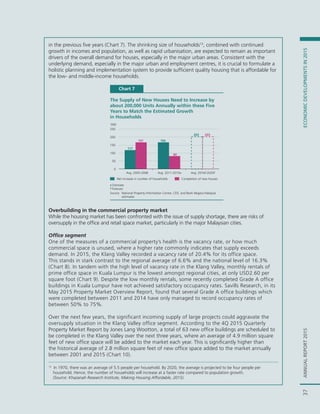
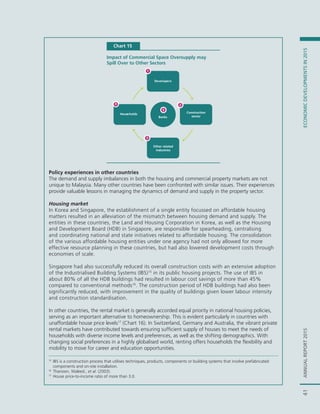
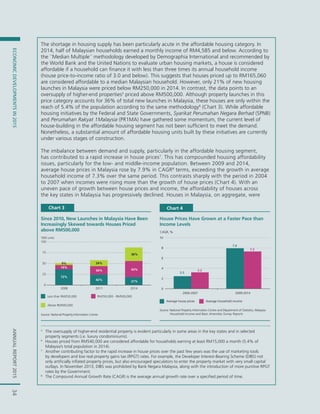
The Malaysian property market is experiencing uneven demand and supply conditions across segments. There is strong demand but insufficient supply in the housing market, especially for affordable housing. Between 2011-2015, the annual completion of new houses fell short of the increase in households by an average of 85,911 units per year. In contrast, the office and retail markets have seen oversupply as many new buildings have been constructed. This imbalance has led to rapidly rising house prices that have outpaced income growth, reducing housing affordability. The shortage is most severe for affordable housing priced below RM250,000, which constitutes only 21% of new launches yet is needed by half of Malaysian households. If unaddressed, this mismatch between house prices and income

![ANNUALREPORT2015ECONOMICDEVELOPMENTSIN201535ANNUALREPORT2015ECONOMICDEVELOPMENTSIN2015
9
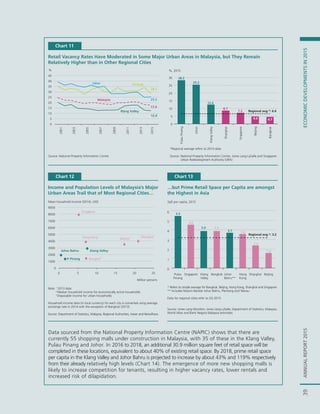
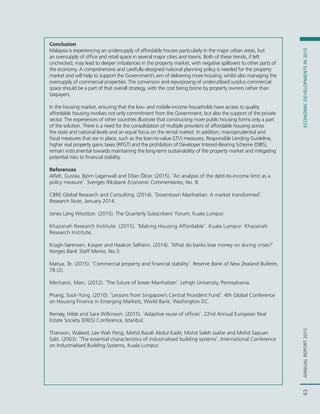
Houses priced up to a maximum of three times the annual median household income is considered affordable (RM165,060).
House Prices are Severely Unaffordable in Kuala Lumpur and Pulau Pinang
Location
House Price-to-Income Ratio
Rating
House Price-to-Income
Ratio
2012 2014
Kuala Lumpur 4.9 5.4
Pulau Pinang 4.1 5.2 Severely Unaffordable 5.1 & Above
Johor 3.7 4.2 Seriously Unaffordable 4.1 to 5.0
Selangor 3.6 4.0 Moderately Unaffordable 3.1 to 4.0
Malaysia 4.0 4.4 Affordable 3.0 & Below
Source: Department of Statistics, Malaysia Household Income and Basic Amenities Survey Reports, National Property Information Centre and
12th Annual Demographia International Housing Affordability Survey 2016
Table 1
considered seriously unaffordable in 2014 (house price-to-income ratio of 4.4) according to the
``Median Multiple´´ methodology. In the key states, houses were severely unaffordable in Kuala
Lumpur and Pulau Pinang, while those in Johor and Selangor were seriously unaffordable and
moderately unaffordable, respectively (Table 1).
The gap between actual house prices and the levels that are considered affordable to the
majority of Malaysian households requires comprehensive resolution. In 2014, the median house
price prevailing in the market was RM242,000, which was RM76,940 more than what would be
an affordable price for a median household9
. Amongst the key states, the gap was most severe
in Kuala Lumpur at RM215,680 (Chart 5). In the major urban employment centres in these key
states, the situation is even more acute (Chart 6).
Chart 5
House Prices in Key States are beyond the Reach
of Most Malaysians in 2014…
Note: Figures in parentheses ( ) refer to each state’s median household monthly income in 2014
Figures in square brackets [ ] refer to the state’s urban median household monthly income in 2014, used as a proxy to the median household income in each urban city
*The cities in each state are based upon the delineation of (i) District: Petaling (Shah Alam, Subang Jaya and Petaling Jaya) in Selangor and Johor Bahru in Johor;
(ii) Mukim: Kuala Lumpur Town Centre in Kuala Lumpur and Georgetown in Pulau Pinang
Source: Department of Statistics, Malaysia, National Property Information Centre and Bank Negara Malaysia estimates
165
274
224 187 169
Malaysia
(4,585)
Kuala Lumpur
(7,620)
Selangor
(6,214)
Johor
(5,197)
Pulau Pinang
(4,702)
Ideal median house prices Actual median house prices
Chart 6
…and Even More so in the Key Urban
Employment Centres
Ideal median house prices Actual city* median house prices
274 233 198 173
0
100
200
300
400
500
600
700
Kuala Lumpur City
[7,620]
Petaling
[6,484]
Johor Bahru
[5,497]
Georgetown
[4,792]
RM '000
0
100
200
300
400
500
600
700
RM '000
165 274 224 187 169
242
490
300
260 295
274 233 198 173
560
470
335
600](https://image.slidesharecdn.com/malaysianpropertymarket-170321033303/85/Malaysian-property-market-3-320.jpg)
![ANNUALREPORT2015ECONOMICDEVELOPMENTSIN201536ANNUALREPORT2015ECONOMICDEVELOPMENTSIN2015
Moving forward, a substantial increase in the supply of affordable housing is necessary. An estimated
202,571 new houses12
will be required annually between 2016 and 2020 to match the estimated
growth in households during this period, approximately 2.5 times the number of houses built annually
10
Alfelt, Gustav, et.al. (2015). There is no general definition of how a debt-to-income limit should be designed and its effects
can vary depending on its construction. For example, a debt-to-income limit can be introduced to either target individual
households or the banks’ lending stock. Furthermore, the definition of debt and income may differ across countries.
11
The loan size is based on 30% housing debt service ratio* (using income net of statutory deductions), 35-year loan tenure,
housing loan-to-value ratio of 90% and lending rate of 5%.
12
The estimate reflects a continuation of historical trends in terms of household formation and the capacity of households to
exercise choice in owning a house. Net household growth is thus assumed to continue to expand at its long-term average
(between 2005 and 2015) of 2.6% annually between 2016 and 2020.
* Most young buyers tend to be indebted with existing debt obligations (i.e. car loan, outstanding credit card repayments),
implying a lesser amount of disposable income that can be allocated for a housing loan.
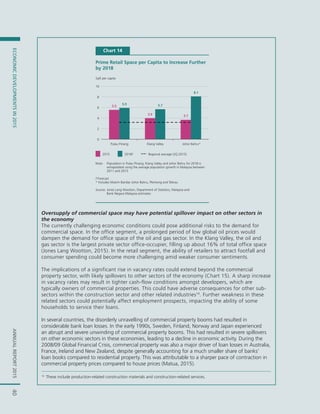
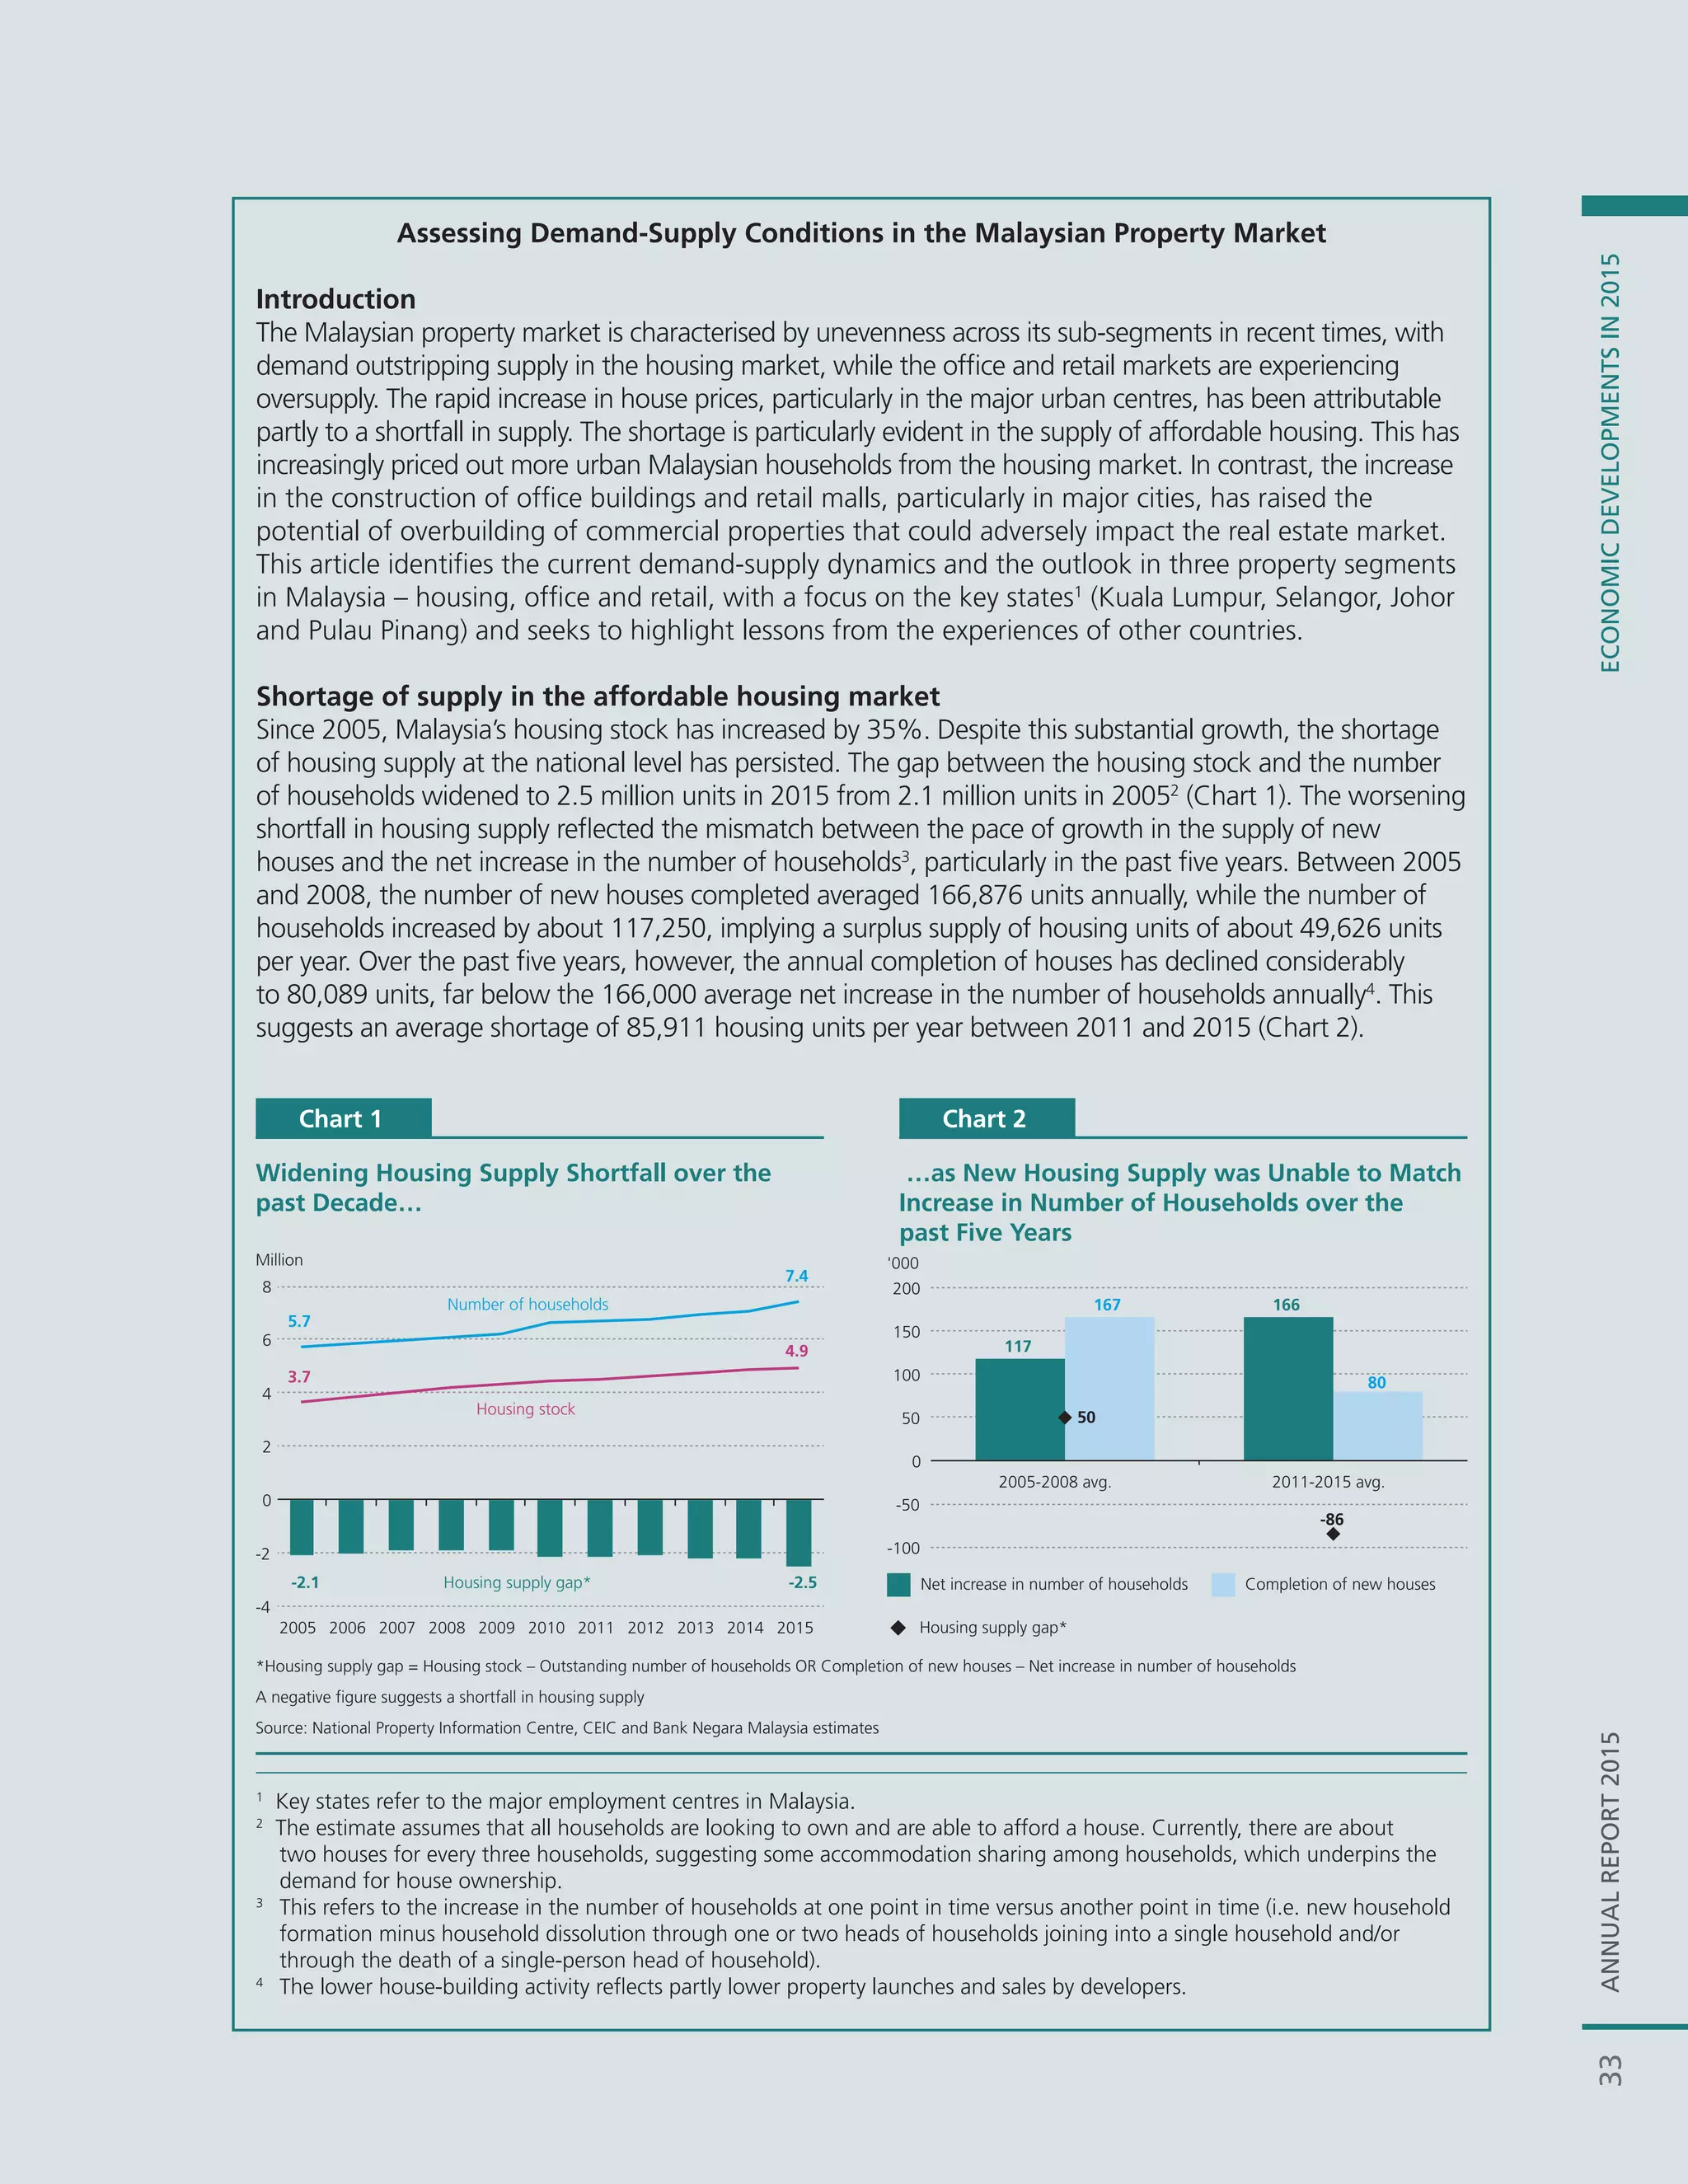
Information Box: Housing Loan Affordability
The assessment of housing affordability can alternatively be measured by the households’ ability to
service mortgage loans using their income. The debt-to-income measure, which has been increasingly
adopted by a number of countries with high household debt levels, establishes an upper limit to
a household’s total loan in relation to its disposable income10
. In this approach, we compare the
maximum loan11
amount that a bank can extend to a median household against the actual median
house prices. The results concur with our findings using the ``Median Multiple´´ approach.
A median household in Kuala Lumpur and Penang has insufficient capacity to service a mortgage
loan based on the median house prices in these areas (Chart A). In the key urban employment
centres, that capacity is even less (Chart B).
Chart A
House Prices in Kuala Lumpur and Penang are
Unaffordable to a Median Household
Max. affordables house prices Actual median house prices Max. affordables house prices Actual city* median house prices
261
404
342
293 267
242
490
300
260
295
0
Malaysia
(4,585)
Kuala Lumpur
(7,620)
Selangor
(6,214)
Johor
(5,197)
Pulau Pinang
(4,702)
RM '000
Note: Figures in parentheses ( ) refer to each state’s median household monthly income in 2014
Figures in square brackets [ ] refer to the state’s urban median household monthly income in 2014, used as a proxy to the median household income in each urban city
* The cities in each state are based upon the delineation of (i) District: Petaling (Shah Alam, Subang Jaya and Petaling Jaya) in Selangor and Johor Bahru in Johor,
(ii) Mukim: Kuala Lumpur Town Centre in Kuala Lumpur and Georgetown in Pulau Pinang
Source: Department of Statistics, Malaysia, National Property Information Centre and Bank Negara Malaysia estimates
Chart B
Even More Severe Situation in the Key Urban
Employment Centres
404 356
308 272
560
470
335
600
0
100
200
300
400
500
600
700
100
200
300
400
500
600
700
Kuala Lumpur City
[7,620]
Petaling
[6,484]
Johor Bahru
[5,497]
Georgetown
[4,792]
RM '000](https://image.slidesharecdn.com/malaysianpropertymarket-170321033303/85/Malaysian-property-market-4-320.jpg)