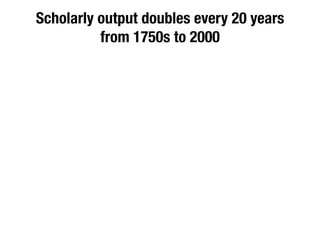
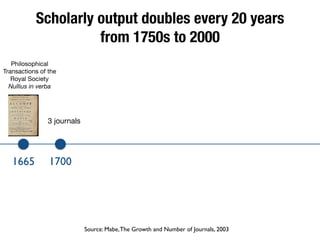
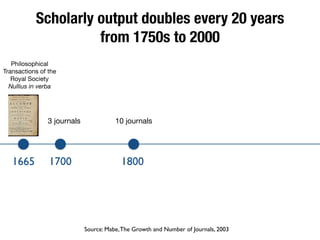
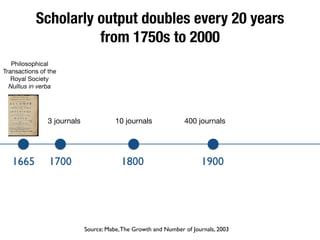
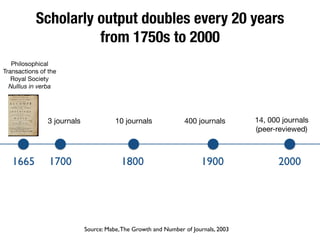
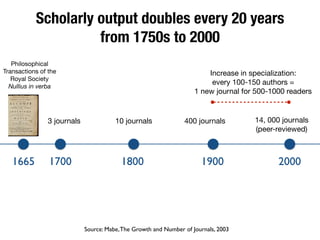
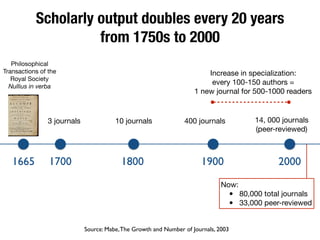
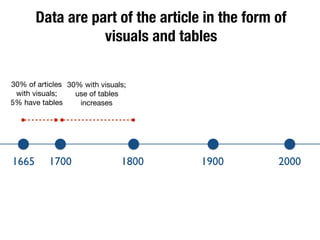
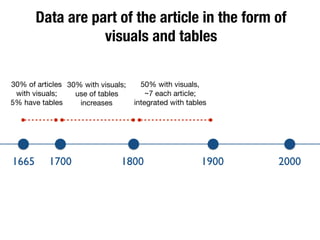
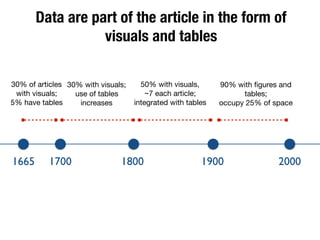
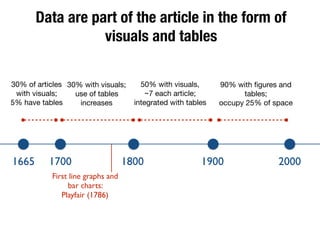
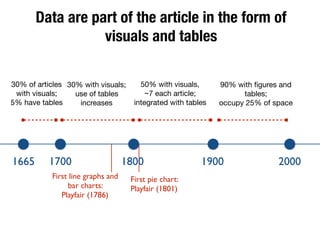
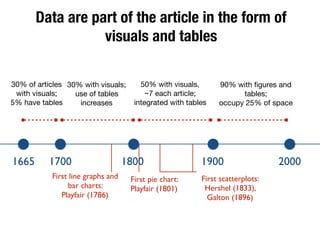
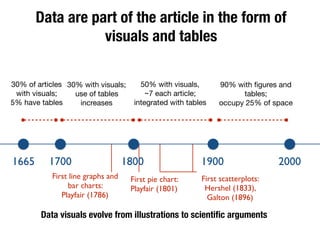
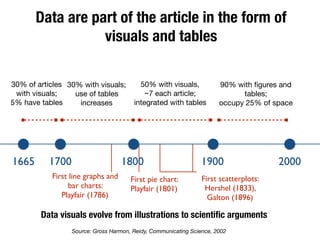
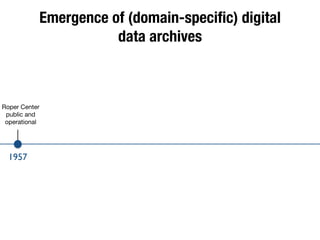
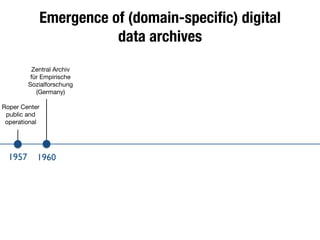
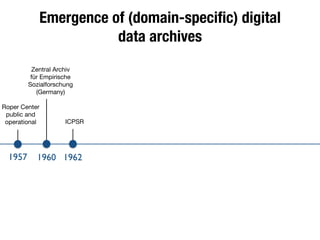
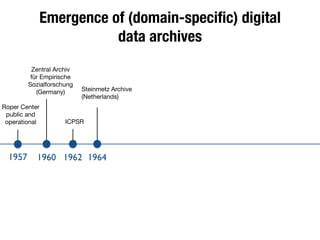
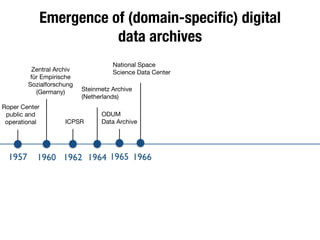
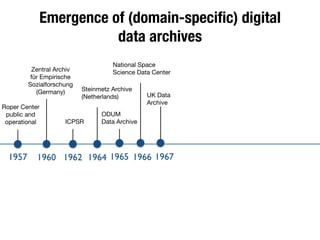
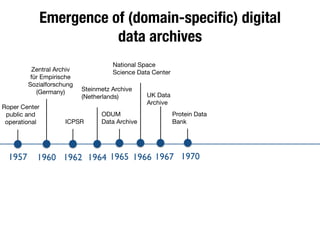
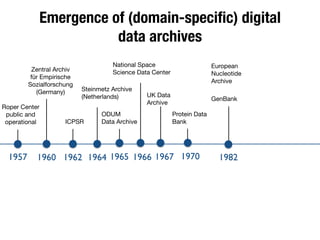
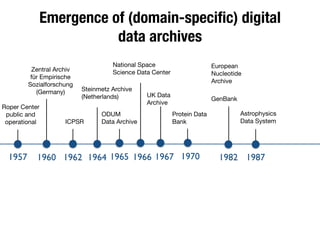
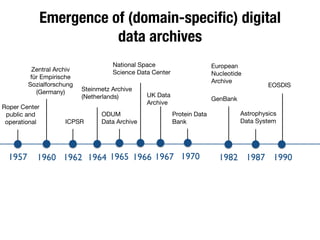
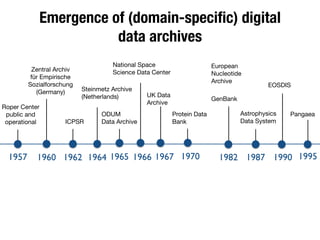
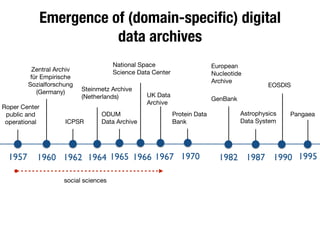
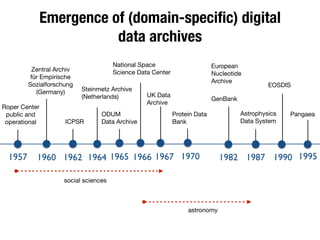
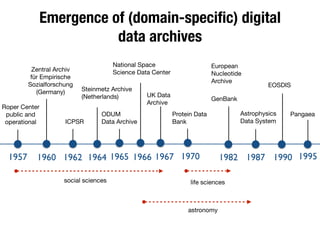
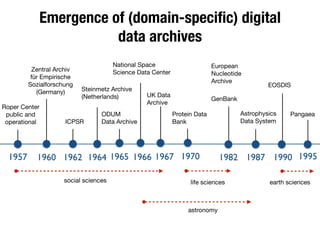
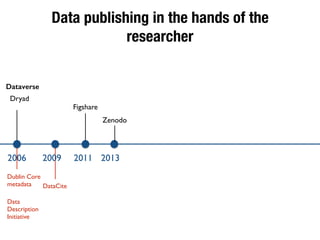
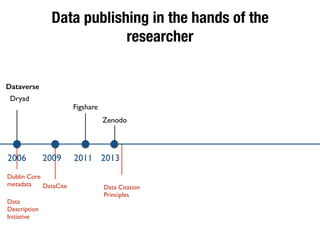
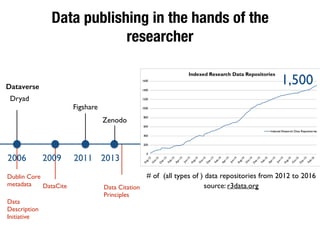
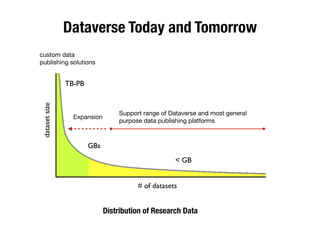
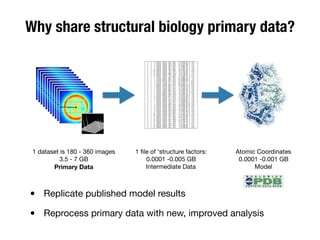
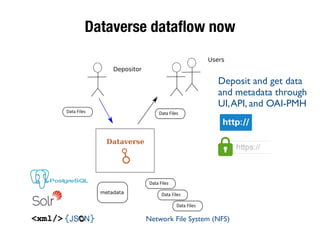
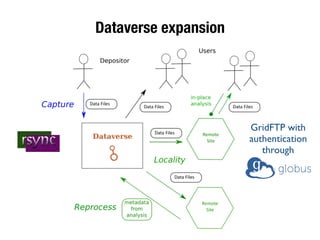
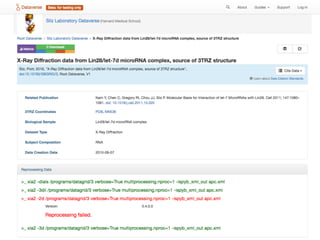
The document discusses the historical increase in scholarly output and the evolution of data visualization in scientific communication, noting that scholarly output has doubled approximately every 20 years from the 1750s to 2000. It highlights the emergence of digital data archives and data publishing as essential components for enhancing research communication, especially in the last decade. The document emphasizes the role of platforms like Dataverse in enabling researchers to control and disseminate their data effectively while fostering collaboration and defining best practices.
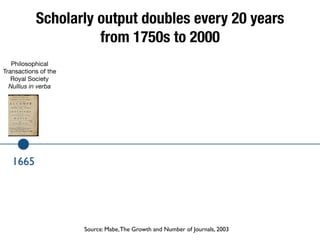
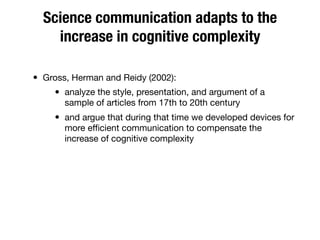
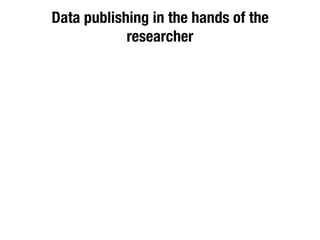
![“The
21st
of
April,
1665,
about
eight
in
the
morning,
I
bored
a
hole
in
the
body
of
a
fair
and
large
Birch,
and
put
in
a
Cork
with
a
Quill
in
the
middle;
aOer
a
Moment
or
two
it
[a
sap]
began
to
drop,
but
yet
very
soOly:
Some
three
Hours
aOer
I
returned¸
and
it
had
filled
a
Pint
Glass,
and
then
it
dropped
exceeding
fast,
viz.
every
Pulse
a
Drop:
This
Liquor
is
not
unpleasant
to
the
Taste,
and
not
thick
or
troubled;
yet
it
looks
as
though
some
few
drops
of
Milk
were
split
in
a
Bason
of
Fountain
Water.”
(Lister,
1697)
Schemaac
of
solar
and
lunar
eclipses
in
a
1665
paper
by
Hevelius
(Philosophical
Transacaons,
Vol
1)
Source:
Gross
Harmon,
Reidy,
Communica8ng
Science,
2002](https://image.slidesharecdn.com/seas-cscolloquium-mercecrosas-withanimation-161025224006/85/Making-Data-Accessible-104-320.jpg)


