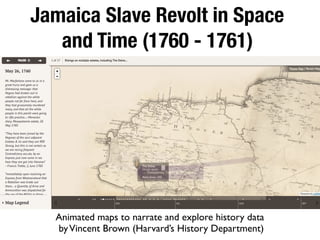
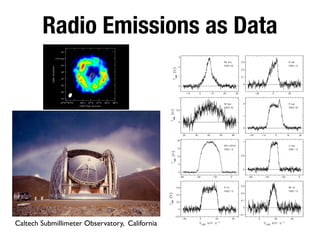
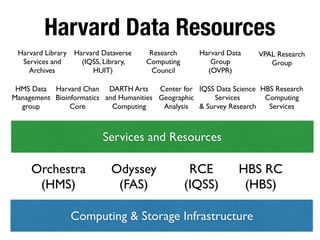
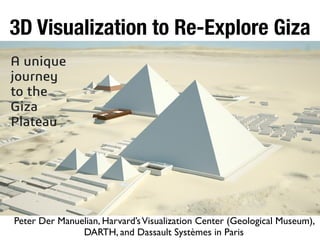
Managing Scholarly Research Output The Smithsonian Institution Experience: An...Martin Kalfatovic
Managing Scholarly Research Output The Smithsonian Institution Experience: An Introduction to Smithsonian Research Online. Martin R. Kalfatovic with Alvin Hutchinson and Richard Naples. Mpala Research Centre and Wildlife Foundation, Laikipia County, Kenya. 22 May 2017.
Managing Scholarly Research Output The Smithsonian Institution Experience: An...Martin Kalfatovic
Managing Scholarly Research Output The Smithsonian Institution Experience: An Introduction to Smithsonian Research Online. Martin R. Kalfatovic with Alvin Hutchinson and Richard Naples. American Reference Center, U.S. Embassy, Nairobi, Kenya. 19 May 2017.
A crowd of specimens: Digitising Collections at the Natural History Museum, L...ConnectingWithTheCrowd
Helen Hardy, Digital Collections Programme Manager and Dr John Tweddle, Head of the Angela Marmont Centre for UK Biodiversity. Connecting With The Crowd Conference, London 16 June 2017.
Module 5 - EN - Promoting data use III: Most frequent data analysis techniques Alberto González-Talaván
This presentation builds on experiences and presents the most frequently taught ecological niche modelling techniques, so that Node managers can organize successful training and dissemination sessions on this topic.
It was prepared by Anne Sophie Archambeau from GBIF France, with input from Dag Endresen from GBIF Norway.
RDA Fourth Plenary Keynote - Prof. Christine L. Borgman, Professor Presidential Chair in Information Studies at UCLA: "Data, Data, Everywhere, Nor Any Drop to Drink." Tuesday 23rd Sept 2014, Amsterdam, the Netherlands
https://rd-alliance.org/plenary-meetings/fourth-plenary/plenary4-programme.html
Spatio-‐temporal Sensor Integration, Analysis, Classification or Can Exascal...Joel Saltz
Presentation at Clusters, Clouds and Data for Scientific Computing 2014
Integrative analyses of large scale spatio-temporal datasets play increasingly important roles in many areas of science and engineering. Our recent work in this area is motivated by application scenarios involving complementary digital microscopy, radiology and “omic” analyses in cancer research. In these scenarios, the objective is to use a coordinated set of image analysis, feature extraction and machine learning methods to predict disease progression and to aid in targeting new therapies. I will describe tools and methods our group has developed for extraction, management, and analysis of features along with the systems software methods for optimizing execution on high end CPU/GPU platforms. Once having provided our current work as an introduction, I will then describe 1) related but much more ambitious exascale biomedical and non-biomedical use cases that also involve the complex interplay between multi-scale structure and molecular mechanism and 2) concepts and requirements for methods and tools that address these challenges.
Presentation given at the CBS (Central Bureau of Statistics) by CEDAR members on 06-11-2014 for the Studiemiddag "Digitalisering historische CBS-collectie" (digitisation of the CBS historical collection). All things on converting Excel spreadsheets to RDF Data Cube, harmonisation, and using Linked Data for standardizing statistical data on the Web.
Managing Scholarly Research Output The Smithsonian Institution Experience: An...Martin Kalfatovic
Managing Scholarly Research Output The Smithsonian Institution Experience: An Introduction to Smithsonian Research Online. Martin R. Kalfatovic with Alvin Hutchinson and Richard Naples. Mpala Research Centre and Wildlife Foundation, Laikipia County, Kenya. 22 May 2017.
Managing Scholarly Research Output The Smithsonian Institution Experience: An...Martin Kalfatovic
Managing Scholarly Research Output The Smithsonian Institution Experience: An Introduction to Smithsonian Research Online. Martin R. Kalfatovic with Alvin Hutchinson and Richard Naples. American Reference Center, U.S. Embassy, Nairobi, Kenya. 19 May 2017.
A crowd of specimens: Digitising Collections at the Natural History Museum, L...ConnectingWithTheCrowd
Helen Hardy, Digital Collections Programme Manager and Dr John Tweddle, Head of the Angela Marmont Centre for UK Biodiversity. Connecting With The Crowd Conference, London 16 June 2017.
Module 5 - EN - Promoting data use III: Most frequent data analysis techniques Alberto González-Talaván
This presentation builds on experiences and presents the most frequently taught ecological niche modelling techniques, so that Node managers can organize successful training and dissemination sessions on this topic.
It was prepared by Anne Sophie Archambeau from GBIF France, with input from Dag Endresen from GBIF Norway.
RDA Fourth Plenary Keynote - Prof. Christine L. Borgman, Professor Presidential Chair in Information Studies at UCLA: "Data, Data, Everywhere, Nor Any Drop to Drink." Tuesday 23rd Sept 2014, Amsterdam, the Netherlands
https://rd-alliance.org/plenary-meetings/fourth-plenary/plenary4-programme.html
Spatio-‐temporal Sensor Integration, Analysis, Classification or Can Exascal...Joel Saltz
Presentation at Clusters, Clouds and Data for Scientific Computing 2014
Integrative analyses of large scale spatio-temporal datasets play increasingly important roles in many areas of science and engineering. Our recent work in this area is motivated by application scenarios involving complementary digital microscopy, radiology and “omic” analyses in cancer research. In these scenarios, the objective is to use a coordinated set of image analysis, feature extraction and machine learning methods to predict disease progression and to aid in targeting new therapies. I will describe tools and methods our group has developed for extraction, management, and analysis of features along with the systems software methods for optimizing execution on high end CPU/GPU platforms. Once having provided our current work as an introduction, I will then describe 1) related but much more ambitious exascale biomedical and non-biomedical use cases that also involve the complex interplay between multi-scale structure and molecular mechanism and 2) concepts and requirements for methods and tools that address these challenges.
Presentation given at the CBS (Central Bureau of Statistics) by CEDAR members on 06-11-2014 for the Studiemiddag "Digitalisering historische CBS-collectie" (digitisation of the CBS historical collection). All things on converting Excel spreadsheets to RDF Data Cube, harmonisation, and using Linked Data for standardizing statistical data on the Web.
Introduction to Citizen Science and Scientific Crowdsourcing - Data Quality s...Muki Haklay
This is part of the course "introduction to citizen science and scientific crowdsourcing", which you can find at https://extendstore.ucl.ac.uk/product?catalog=UCLXICSSCJan17 . The lecture is dedicated to data management in citizen science, and this part is focusing on data quality
Talk for the workshop on the Future of the Commons, November 18, 2015: http://cendievents.infointl.com/CENDI_NFAIS_RDA_2015/
Slides distributed under under CC-by license: https://creativecommons.org/licenses/by/2.0/
In this talk we describe how the Fourth Paradigm for Data-Intensive Research is providing a framework for us to develop tools, technologies and platforms to support actionable science. We discuss applications that take advantage of cloud computing, particularly Microsoft Azure, to realise the potential for turning data into decisions, knowledge and understanding. http://www.fourthpardigm.org and http://www.azure4research.com
Big Social Data: The Spatial Turn in Big Data (Video available soon on YouTube)Rich Heimann
Big Social Data: The Spatial Turn in Big Data
By Richard Heimann & Abe Usher
University of Maryland Baltimore County Webinar Description:
The increased access to spatial data and overall improved application of spatial analytical methods present certain potential to social scientific research. This webinar is designed to focus on substantive social science research perspectives while exposing rewards involved in the application of geographic information systems (GIS), Big Data, and spatial analytics in their own research.
What is witnessed as the hype of Web 2.0 has worn off and the collaborative use of the Internet becomes a societal norm is an unprecedented explosion in the creation and analysis of geospatial data. Just as major governments are reducing their investments in location intelligence, individuals and non-government organizations are fueling a bonfire of innovation in the world of GIS data.
Traditional spatial analyses grew up in an era of sparse data and very weak computational power. Today, both of those circumstances are reversed and many of the old solutions are no longer suitable to answer todays questions.
"Big Social Data: The Spatial Turn in Big Data" reflects this change and combines two things which, until recently, engaged quite different groups of researchers and practitioners. Together, they require particular techniques and a sophisticated understanding of the special problems associated with spatial social data. Geographic Data Mining, or Geographic Knowledge Discovery, is not new, but is developing and changing rapidly as both more, and different, data becomes available, and people see new applications. The days of ‘Big Data’ require fresh thinking.
The webinar will highlight connections between spatial concepts and data availability. New emerging social media data will be promoted over traditional social science data, which better reflect some of the more recently developments in Big Data - most notably the socially critical exploration of such data.
Slides from keynote lecture by Andrew Prescott to the 7th Herrenhausen conference of the Volkswagen Foundation, 'Big Data in a Transdisciplinary Perspective'
Many of us nowadays invest significant amounts of time in sharing our activities and opinions with friends and family via social networking tools. However, despite the availability of many platforms for scientists to connect and share with their peers in the scientific community the majority do not make use of these tools, despite their promise and potential impact and influence on our future careers. We are being indexed and exposed on the internet via our publications, presentations and data. We also have many more ways to contribute to science, to annotate and curate data, to “publish” in new ways, and many of these activities are as part of a growing crowdsourcing network. This presentation will provide an overview of the various types of networking and collaborative sites available to scientists and ways to expose your scientific activities online. Many of these can ultimately contribute to the developing measures of you as a scientist as identified in the new world of alternative metrics. Participating offers a great opportunity to develop a scientific profile within the community and may ultimately be very beneficial, especially to scientists early in their career.
Knowledge – dynamics – landscape - navigation – what have interfaces to digit...Andrea Scharnhorst
When we google, search Wikipedia, and share information on Mendeley, we obviously deal with complex networks of information. But also traditional information spaces – the collections of libraries for instance – and their classification systems are evolving complex systems. This talk explores the possibilities to use concepts and methods from statistical physics to analyze information dynamics. We depart from information dynamics in scholarly communication, and point to current encounters between physics and scientometrics. We discuss more in-depth the evolution of category systems in libraries (Universal Decimal Classification) in comparison to on-line spaces (Wikipedia). The talk closes with an introduction into a new European network – the COST Action KnowEscape – in which information professionals, sociologists, computer scientists, physicists and digital humanities scholars in an unique alliance seek for knowledge maps to better navigate through large information spaces.
Talk on June 11, 2013 by Andrea Scharnhorst at the IMT in Lucca, Italy.
Presentation to CRC Mental Health Early Career Researcher Workshop, Melbourne 29.11.17 for @andsdata.
Workshop title: A by-product of scientific training: We're all a little bit biased.
A short review of the new initiatives related to research data management at Harvard University for the CRADLE workshop at IASSIST 2017 (http://www.iassist2017.org/).
Introduction to Citizen Science and Scientific Crowdsourcing - Data Quality s...Muki Haklay
This is part of the course "introduction to citizen science and scientific crowdsourcing", which you can find at https://extendstore.ucl.ac.uk/product?catalog=UCLXICSSCJan17 . The lecture is dedicated to data management in citizen science, and this part is focusing on data quality
Talk for the workshop on the Future of the Commons, November 18, 2015: http://cendievents.infointl.com/CENDI_NFAIS_RDA_2015/
Slides distributed under under CC-by license: https://creativecommons.org/licenses/by/2.0/
In this talk we describe how the Fourth Paradigm for Data-Intensive Research is providing a framework for us to develop tools, technologies and platforms to support actionable science. We discuss applications that take advantage of cloud computing, particularly Microsoft Azure, to realise the potential for turning data into decisions, knowledge and understanding. http://www.fourthpardigm.org and http://www.azure4research.com
Big Social Data: The Spatial Turn in Big Data (Video available soon on YouTube)Rich Heimann
Big Social Data: The Spatial Turn in Big Data
By Richard Heimann & Abe Usher
University of Maryland Baltimore County Webinar Description:
The increased access to spatial data and overall improved application of spatial analytical methods present certain potential to social scientific research. This webinar is designed to focus on substantive social science research perspectives while exposing rewards involved in the application of geographic information systems (GIS), Big Data, and spatial analytics in their own research.
What is witnessed as the hype of Web 2.0 has worn off and the collaborative use of the Internet becomes a societal norm is an unprecedented explosion in the creation and analysis of geospatial data. Just as major governments are reducing their investments in location intelligence, individuals and non-government organizations are fueling a bonfire of innovation in the world of GIS data.
Traditional spatial analyses grew up in an era of sparse data and very weak computational power. Today, both of those circumstances are reversed and many of the old solutions are no longer suitable to answer todays questions.
"Big Social Data: The Spatial Turn in Big Data" reflects this change and combines two things which, until recently, engaged quite different groups of researchers and practitioners. Together, they require particular techniques and a sophisticated understanding of the special problems associated with spatial social data. Geographic Data Mining, or Geographic Knowledge Discovery, is not new, but is developing and changing rapidly as both more, and different, data becomes available, and people see new applications. The days of ‘Big Data’ require fresh thinking.
The webinar will highlight connections between spatial concepts and data availability. New emerging social media data will be promoted over traditional social science data, which better reflect some of the more recently developments in Big Data - most notably the socially critical exploration of such data.
Slides from keynote lecture by Andrew Prescott to the 7th Herrenhausen conference of the Volkswagen Foundation, 'Big Data in a Transdisciplinary Perspective'
Many of us nowadays invest significant amounts of time in sharing our activities and opinions with friends and family via social networking tools. However, despite the availability of many platforms for scientists to connect and share with their peers in the scientific community the majority do not make use of these tools, despite their promise and potential impact and influence on our future careers. We are being indexed and exposed on the internet via our publications, presentations and data. We also have many more ways to contribute to science, to annotate and curate data, to “publish” in new ways, and many of these activities are as part of a growing crowdsourcing network. This presentation will provide an overview of the various types of networking and collaborative sites available to scientists and ways to expose your scientific activities online. Many of these can ultimately contribute to the developing measures of you as a scientist as identified in the new world of alternative metrics. Participating offers a great opportunity to develop a scientific profile within the community and may ultimately be very beneficial, especially to scientists early in their career.
Knowledge – dynamics – landscape - navigation – what have interfaces to digit...Andrea Scharnhorst
When we google, search Wikipedia, and share information on Mendeley, we obviously deal with complex networks of information. But also traditional information spaces – the collections of libraries for instance – and their classification systems are evolving complex systems. This talk explores the possibilities to use concepts and methods from statistical physics to analyze information dynamics. We depart from information dynamics in scholarly communication, and point to current encounters between physics and scientometrics. We discuss more in-depth the evolution of category systems in libraries (Universal Decimal Classification) in comparison to on-line spaces (Wikipedia). The talk closes with an introduction into a new European network – the COST Action KnowEscape – in which information professionals, sociologists, computer scientists, physicists and digital humanities scholars in an unique alliance seek for knowledge maps to better navigate through large information spaces.
Talk on June 11, 2013 by Andrea Scharnhorst at the IMT in Lucca, Italy.
Presentation to CRC Mental Health Early Career Researcher Workshop, Melbourne 29.11.17 for @andsdata.
Workshop title: A by-product of scientific training: We're all a little bit biased.
Similar to The Data Lifecycle (Harvard DataFest) (20)
A short review of the new initiatives related to research data management at Harvard University for the CRADLE workshop at IASSIST 2017 (http://www.iassist2017.org/).
Cloud Dataverse: A Data repository platform for an OpenStack CloudMerce Crosas
In the last 10 years, the Dataverse project has been a leader in open-source repository software for sharing and archiving research data. Dataverse has an active, growing community of developers and users, with 22 installations of the software around the world. The Harvard Dataverse repository alone hosts 70,000 datasets, 330,000 data files, with contributions from more than 500 institutions.
Cloud Dataverse combines Dataverse and OpenStack by storing datasets in OpenStack’s Swift Object storage and replicating datasets from Dataverse repositories world-wide to the cloud(s) -- offering enormous value to both the Dataverse and OpenStack communities. It provides Dataverse users the ability to host larger datasets and efficiently compute on data from around the world using OpenStack’s compute services. It provides OpenStack users with a repository system that is much richer than Amazon’s Public Datasets service.
Presentation for the workshop on "6 Reasons Fake News is the End of the World as we know it" at Harvard University, organized by the Center for Research on Computation and Society https://crcs.seas.harvard.edu/event/fakenews
Dataverse, Cloud Dataverse, and DataTagsMerce Crosas
Talk given at Two Sigma:
The Dataverse project, developed at Harvard's Institute for Quantitative Social Science since 2006, is a widely used software platform to share and archive data for research. There are currently more than 20 Dataverse repository installations worldwide, with the Harvard Dataverse repository alone hosting more than 60,000 datasets. Dataverse provides incentives to researchers to share their data, giving them credit through data citation and control over terms of use and access. In this talk, I'll discuss the Dataverse project, as well as related projects such as DataTags to share sensitive data and Cloud Dataverse to share Big Data.
FAIR Data Management and FAIR Data SharingMerce Crosas
Presentation at the Critical Perspective on the Practice of Digiral Archeology symposium: http://archaeology.harvard.edu/critical-perspectives-practice-digital-archaeology
Presentation at the MOC Workshop, at Boston University.
Cloud Dataverse will be a new service for accessing and processing public data sets in a the Massachusetts Open Cloud (MOC). It is based on Dataverse, a popular software framework for sharing, archiving, and analyzing research data. Cloud Dataverse extends Dataverse to replicate datasets from institution repositories to a cloud-based repository and store their data files in Swift, making data processing faster for in-situ application running in the cloud.
Cloud Dataverse is a collaborative effort between two open source projects: Massachusetts Open Cloud (MOC) and Dataverse. The Dataversesoftware is being developed at Harvard's Institute for Quantitative Social Science (IQSS) with contributors worldwide providing 21 Dataverse installations. The Harvard Dataverse installation alone hosts more than 60,000 datasets from 300 institutions by 15,000 data authors. The MOC is a collaboration between higher education (BU, NEU, Harvard, MIT and UMass), government, and industry. Its mission is to create a self-sustaining at-scale public cloud based on the Open Cloud eXchange model.
Since modern science began, data have been a critical part of the scientific enterprise, not only for conducting science but also for communicating and validating scientific results. From the beginning, it was clear that for the scientific community to continually verify scientific results, the underlying data had to be made accessible. But that has not been, and is still not, always the case. In recent years however, public data repositories have grown significantly, making many research data sets easily accessible to others. The Dataverse project, an open-source software for building repositories to share research data (such as the Harvard Dataverse), has played an important role in making this happen, by giving incentives to researchers to share their own data. In this talk, I will discuss how we got here, and introduce current projects that extend Dataverse to address the next challenges in sharing research data. In particular, I'll present a project that, through integrating Dataverse with remote computing sites, makes large-scale structural biology data widely accessible and helps validate previous results.
Presentation for Harvard's ABCD Technology in Education group:
The Institute for Quantitative Social Science (IQSS) is a unique entity at Harvard - it combines research, software development, and specialized services to provide innovative solutions to research and scholarship problems at Harvard and beyond. I will talk about the software projects that IQSS is currently working on (Dataverse, Zelig, Consilience, and OpenScholar), including the research and development processes, the benefits provided to the Harvard community, and the impacts on research and scholarship.
The DataTags System: Sharing Sensitive Data with ConfidenceMerce Crosas
This talk was part of a session at the Research Data Alliance (RDA) 8th Plenary on Privacy Implications of Research Data Sets, during International Data Week 2016:
https://rd-alliance.org/rda-8th-plenary-joint-meeting-ig-domain-repositories-wg-rdaniso-privacy-implications-research-data
Slides in Merce Crosas site:
http://scholar.harvard.edu/mercecrosas/presentations/datatags-system-sharing-sensitive-data-confidence
Open Source Tools Facilitating Sharing/Protecting Privacy: Dataverse and Data...Merce Crosas
Presentation for the NFAIS Webinar series: Open Data Fostering Open Science: Meeting Researchers' Needs
http://www.nfais.org/index.php?option=com_mc&view=mc&mcid=72&eventId=508850&orgId=nfais
The Rise of Data Publishing in the Digital World (and how Dataverse and DataT...Merce Crosas
Presentation at the National Library of Medicine, in a Symposium organized by the National Data Stewardship Residency, funded by the Library of Congress and the Institute of Museum and Library Services, on "Digital Frenemies: Closing the Gap in Born-Digital and Made-Digital Curation”.
https://ndsr2016.wordpress.com/
A very Brief History of Communicating ScienceMerce Crosas
Mercè Crosas (IQSS, HarvardUniversity) @mercecrosas
An introduction to Force2016 panel on Communicating Science with Steven Pinker, César Hidalgo, and Christie Nicholson
Data Citation Implementation at DataverseMerce Crosas
Presentation at the Data Citation Implementation Pilot Workshop in Boston, February 3rd, 2016.
https://www.force11.org/group/data-citation-implementation-pilot-dcip/pilot-project-kick-workshop
Data Publishing at Harvard's Research Data Access SymposiumMerce Crosas
Data Publishing: The research community needs reliable, standard ways to make the data produced by scientific research available to the community, while giving credit to data authors. As a result, a new form of scholarly publication is emerging: data publishing. Data publishing - or making data reusable, citable, and accessible for long periods - is more than simply providing a link to a data file or posting the data to the researcher’s web site. We will discuss best practices, including the use of persistent identifiers and full data citations, the importance of metadata, the choice between public data and restricted data with terms of use, the workflows for collaboration and review before data release, and the role of trusted archival repositories. The Harvard Dataverse repository (and the Dataverse open-source software) provides a solution for data publishing, making it easy for researchers to follow these best practices, while satisfying data management requirements and incentivizing the sharing of research data.
Levelwise PageRank with Loop-Based Dead End Handling Strategy : SHORT REPORT ...Subhajit Sahu
Abstract — Levelwise PageRank is an alternative method of PageRank computation which decomposes the input graph into a directed acyclic block-graph of strongly connected components, and processes them in topological order, one level at a time. This enables calculation for ranks in a distributed fashion without per-iteration communication, unlike the standard method where all vertices are processed in each iteration. It however comes with a precondition of the absence of dead ends in the input graph. Here, the native non-distributed performance of Levelwise PageRank was compared against Monolithic PageRank on a CPU as well as a GPU. To ensure a fair comparison, Monolithic PageRank was also performed on a graph where vertices were split by components. Results indicate that Levelwise PageRank is about as fast as Monolithic PageRank on the CPU, but quite a bit slower on the GPU. Slowdown on the GPU is likely caused by a large submission of small workloads, and expected to be non-issue when the computation is performed on massive graphs.
Chatty Kathy - UNC Bootcamp Final Project Presentation - Final Version - 5.23...John Andrews
SlideShare Description for "Chatty Kathy - UNC Bootcamp Final Project Presentation"
Title: Chatty Kathy: Enhancing Physical Activity Among Older Adults
Description:
Discover how Chatty Kathy, an innovative project developed at the UNC Bootcamp, aims to tackle the challenge of low physical activity among older adults. Our AI-driven solution uses peer interaction to boost and sustain exercise levels, significantly improving health outcomes. This presentation covers our problem statement, the rationale behind Chatty Kathy, synthetic data and persona creation, model performance metrics, a visual demonstration of the project, and potential future developments. Join us for an insightful Q&A session to explore the potential of this groundbreaking project.
Project Team: Jay Requarth, Jana Avery, John Andrews, Dr. Dick Davis II, Nee Buntoum, Nam Yeongjin & Mat Nicholas
Enhanced Enterprise Intelligence with your personal AI Data Copilot.pdfGetInData
Recently we have observed the rise of open-source Large Language Models (LLMs) that are community-driven or developed by the AI market leaders, such as Meta (Llama3), Databricks (DBRX) and Snowflake (Arctic). On the other hand, there is a growth in interest in specialized, carefully fine-tuned yet relatively small models that can efficiently assist programmers in day-to-day tasks. Finally, Retrieval-Augmented Generation (RAG) architectures have gained a lot of traction as the preferred approach for LLMs context and prompt augmentation for building conversational SQL data copilots, code copilots and chatbots.
In this presentation, we will show how we built upon these three concepts a robust Data Copilot that can help to democratize access to company data assets and boost performance of everyone working with data platforms.
Why do we need yet another (open-source ) Copilot?
How can we build one?
Architecture and evaluation
Analysis insight about a Flyball dog competition team's performanceroli9797
Insight of my analysis about a Flyball dog competition team's last year performance. Find more: https://github.com/rolandnagy-ds/flyball_race_analysis/tree/main
Adjusting primitives for graph : SHORT REPORT / NOTESSubhajit Sahu
Graph algorithms, like PageRank Compressed Sparse Row (CSR) is an adjacency-list based graph representation that is
Multiply with different modes (map)
1. Performance of sequential execution based vs OpenMP based vector multiply.
2. Comparing various launch configs for CUDA based vector multiply.
Sum with different storage types (reduce)
1. Performance of vector element sum using float vs bfloat16 as the storage type.
Sum with different modes (reduce)
1. Performance of sequential execution based vs OpenMP based vector element sum.
2. Performance of memcpy vs in-place based CUDA based vector element sum.
3. Comparing various launch configs for CUDA based vector element sum (memcpy).
4. Comparing various launch configs for CUDA based vector element sum (in-place).
Sum with in-place strategies of CUDA mode (reduce)
1. Comparing various launch configs for CUDA based vector element sum (in-place).
06-04-2024 - NYC Tech Week - Discussion on Vector Databases, Unstructured Data and AI
Round table discussion of vector databases, unstructured data, ai, big data, real-time, robots and Milvus.
A lively discussion with NJ Gen AI Meetup Lead, Prasad and Procure.FYI's Co-Found
2. Data
Facts that can be analyzed or used in an effort to
gain knowledge or make decisions; information.
Latin Datum “Something Given”
(The American Heritage Dictionary)
3. Museum of Fine Arts
The Art of the Ancient World
Friday, January 13, 2017, 7pm
5. Archeological Finds as Data
The Giza Archive
and catalogue:
• 21,000 finds
• 3,000 photos
• 3000 tomb and
monument
records
• 3,000 diary pages
• 7,000 maps
• books,
manuscripts
• metadata
6. 3D Visualization to Re-Explore Giza
Peter Der Manuelian, Harvard’sVisualization Center (Geological Museum),
DARTH, and Dassault Systèmes in Paris
7. Books as Data
Harvard Cultural
Observatory (Aiden,
Michel, SEAS) + Google:
• 5 million digitized books
(from130 million total)
• From year1500 to 2008
• Optical Character
Recognition (OCR)
• Quantify unstructured
text to n-gram count
matrix
9. Historical events as Data
my ab POSITION Places Notes Terrain Notes ID TYPE NAME DATE STEP VALUE UNITS TEXT LAT1 LON1 LAT2 LON2 PATH CERTAINTY
Needs static event
map Needs static event map 4/6/1760 0
4/7/1760 0
18.3648, -76.8852
Frontier misplaced
to NW 1 Conspiracy Frontier 4/7/1760 1 5 Rebel conspirators 18.3648 -76.8852 1
18.3542, -76.8990
Trinity misplaced to
NW 1 Rebels Trinity 4/7/1760 2 100 Rebel force 18.3542 -76.899 1
4/8/1760 0
Fixed
18.3542, -76.8990
to Ft. Haldane
Still glitchy; start
should be from
Trinity 1 Rebels Ft. Haldane 4/8/1760 1 100 Rebel force 18.3542 -76.899 18.3776 -76.8905 1
Fixed database fixed? 1 Clash Ft. Haldane 4/8/1760 2 100 Rebel force 18.3776 -76.8905 1
18.3542, -76.8990
Trinity misplaced to
NW 1 Rebels Trinity 4/8/1760 3 100 Rebel force 18.3776 -76.8905 18.3542 -76.899 1
18.3223, -76.8875
Ballard's Valley
misplaced to NW
To extent possible, movement
should follow roads (dotted line) 1 Rebels Ballard's Valley 4/8/1760 4 400 Rebel force 18.3542 -76.899 18.3223 -76.8875
[[18.3545,
-76.8976],[18.3521,
-76.8964],[18.3485,
-76.8971],[18.3446,
-76.8964],[18.3402,
-76.8974],[18.3389,
-76.8952],[18.3368,
-76.8933],[18.3368,
-76.8907],[18.3355,
-76.8888],[18.3340,
-76.8866],[18.3324,
-76.8844],[18.3291,
-76.8832],[18.3260,
-76.8846],[18.3224,
-76.8866]] 1
18.3223, -76.8875
Moving clash; Tab
is wrong
To extent possible, movement
should follow roads (dotted line) 1 Clash Ballard's Valley 4/8/1760 5 400 Rebel force
More than 12
whites, 30 non-
whites killed 18.3223 -76.8875 1
18.3223, -76.8875
to Esher
Rebels should
move from
Ballard's Valley to
Esher
To extent possible, movement
should follow roads (dotted line) 1 Rebels Esher 4/8/1760 6 18.3223 -76.8875 18.2809 -76.8675
[[18.3223,
-76.8875],
[18.3198,
-76.8859],
[18.3164,
-76.8866],
[18.3144,
-76.8863],
[18.3125,
-76.8888],
[18.3105,
-76.8925],
[18.3060,
-76.8933],
[18.2998,
-76.8955],
[18.2972,
-76.8991],
[18.2937,
-76.9000],
[18.2908,
-76.8971],
[18.2890,
-76.8928],
[18.2858,
-76.8906],
[18.2807,
-76.8906],
[18.2750,
-76.8882],
[18.2709,
-76.8851],
[18.2704,
-76.8822],
[18.2703,
-76.8773],
[18.2722,
-76.8736],
[18.2783,
-76.8703],
[18.2809,
-76.8675]] 1
To extent possible, movement
should follow roads (dotted line) 1 Clash Esher 4/8/1760 7 5 whites killed 18.2809 -76.8675 1
18.3223, -76.8875
Eliminate
movement; Militia
appear at single
point, Ballard's
Valley
To extent possible, movement
should follow roads (dotted line) 2 Militia Ballard's Valley 4/8/1760 8 18.3223 -76.8875 0
Esher to 18.3050,
-76.8882
Starting pt is
Esher
To extent possible, movement
should follow roads (dotted line) 1 Rebels Whitehall 4/8/1760 9 400 Rebel force 18.2809 -76.8675 18.305 -76.8882
[[18.2809,
-76.8675],
[18.2792,
-76.8694],
[18.2766,
-76.8720],
[18.2740,
-76.8736],
[18.2708,
-76.8796],
[18.2706,
-76.8839],
[18.2809,
-76.8906],
[18.2885,
-76.8921],
[18.2908,
-76.8964],
[18.2919,
-76.8995],
[18.2952,
-76.8995],
[18.2981,
-76.8976],
[18.3032,
-76.8937],[18.305,
-76.8882]] 1
Geospatial coordinates Time
10. Jamaica Slave Revolt in Space
and Time (1760 - 1761)
Animated maps to narrate and explore history data
byVincent Brown (Harvard’s History Department)
11. Polls as Data
2016 Election Data:
• 100s scientific polls
• Mixed models and sample
frames
• interviewer-administered
telephone polls
• interactive-voice-response polls
• probability-based web polls
• good quality non-probability based
web polls
• Inference and forecasting
13. Video as Data
Video in developmental
psychology:
• 143 hours of infant-
perspective scenes,
collected from 34
infants aged 1
month to 2 years
• Coding and
annotations
Fausey, C.M., Smith, L.B. & Jayaraman, S. (2015). From faces to hands: Changing
visual input in the first two years. Databrary
14. Pollution measurements as Data
Combine data from
diverse sources:
• 3000 air pollution
monitors
• 1800 power plants SO2
emissions
• claims data from 60 M
Medicare beneficiaries
• air pollution trajectories
based on weather
models
Zigler, Dominici,Wang, Kim, Choirat (Harvard Chan School of Public Health)
15. Your Genome as Data
Measurement of Single-
Nucleotide
Polymorphisms (SNPs)
with Sequencer
instrument
16. Genome Wide Association Study
Comparing genomes from individuals with
(cases) and without disease (controls)
Genetic variants more often found in individuals with constrictions in small blood vessels
(GWAS,Wikipedia)
18. Yes, there is a Higgs Boson!
Likelihoods as result
of comparing LHC
observations with
predictions from
particle physics
Standard Model
Measurements of Higgs boson production and couplings in diboson final states with the ATLAS
detector at the LHC (Atlas Collaboration, 2013, with 2923 authors).
Acknowledgment Kyle Cranmer (NYU)
(but is it the one we expected?)
20. Temperature, Mass, and Distance
derived from Stellar Molecular Lines
Crosas, Menten, Physical Parameters of the IRC+10216 Circumstellar Envelope (ApJ, 1997)
Monte Carlo simulations of radiative transfer compare observations
with predictions from physical laws
21. raw or primary
data
order, transform,
and analyze them
Catalog
Classify
Visualize
Quantify
Summarize
Geo reference
Inference
Missing data
Forecast
Causal Inference
Coding
Annotations
Associations
Likelihoods
Compare with theory
Humanities
Social Sciences
Health and
Life Sciences
Physical Sciences
gain knowledge,
make decisions
Learn about
the whole
from a part.
Tell a story.
Make a
prediction.
Ultimately
explain.
22. raw or primary
data
order, transform,
and analyze them
gain knowledge,
make decisions
• Replication*: Independent scientific experiments to validate
findings
• Reproducibility*: Calculation of quantitative results by
others using original datasets and methods
(Stodden, Leisch, Peng, Implementing Reproducible Research, 2014)
* Replication and reproducibility definitions vary across disciplines
“Nullius inVerba”
(1665, the Royal Society motto and origin of Philosophical Transactions)
rigorous, scientific approach
verify, converge, expand
23. “Answering even a simple scientific question requires
lots of choices that can shape the results”
“When possible, make
data, methods, and code
open to verify”
“Science/research
might be imperfect, but
is self-correcting”
“It’s not unreliable, but
more challenging that
we give it credit for”
25. Harvard Data Resources
Computing & Storage Infrastructure
Services and Resources
Orchestra
(HMS)
Odyssey
(FAS)
RCE
(IQSS)
HBS RC
(HBS)
HMS Data
Management
group
Harvard Chan
Bioinformatics
Core
IQSS Data Science
Services
& Survey Research
Center for
Geographic
Analysis
DARTH Arts
and Humanities
Computing
Harvard Library
Services and
Archives
Research
Computing
Council
Harvard Data
Group
(OVPR)
Harvard Dataverse
(IQSS, Library,
HUIT)
VPAL Research
Group
HBS Research
Computing
Services
26. DataFest
Data Concepts
Project Planning a Data
Science Workflows
Processing and
Analyzing Data*
Dissemination
Plan how to
address your
research question
Address it!
Share your
results, data, code
with others
*Does not include handling sensitive data
Tuesday,January17Wednesday,January18 Follow your sessions
using SCHED