Downloaded 17 times


![Clinical Lung Imaging Lung Imaging Clinical
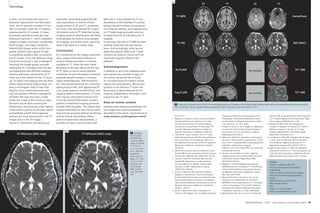
MRI of the Lung –
ready … get set … go!
J. Biederer1; C. Hintze1; M. Fabel1; P. M. Jakob2; W. Horger3; J. Graessner3; B.D. Bolster, Jr.3; M. Heller1
1University Hospital Schleswig-Holstein, Campus Kiel, Department of Diagnostic Radiology, Kiel, Germany
2 University of Wuerzburg, Department of Experimental Physics 5
and Magnetic Resonance Bavaria e.V., Wuerzburg, Germany
3 Siemens AG, Healthcare
Introduction
Magnetic resonance imaging (MRI) of
the lung is a powerful evolving tool for
scientific and clinical application. The
key technique for MRI of lung morphol-ogy
is based on resonant high-frequency
signal of protons in tissues and liquids,
so-called Proton- or 1H-MRI. Empowered
by recent technical advances, MRI has
challenged its well-known limitations as
defined by the low proton density in
the lung and the fast signal decay due to
susceptibility artifacts at air-tissue inter-faces.
The new modality in chest imag-ing
is much appreciated, even in spite of
the excellent performance of modern
multiple row detector computed tomo-graphy
(CT) scanners and the far lower
price of X-ray. Being superior to X-ray
and matching CT in detection of nodular
and infiltrative lung disease, offering
additional functional imaging capacities
and all this without radiation exposure
to the patient, lung MRI has become
a valuable method for examinations in
children and during pregnancy, for young
patients with diseases which warrant
frequent follow-up examinations or for
any other application that would need
to avoid radiation exposure, such as
scientific studies, commercial clinical
trials (therapy control) or assessment
of patients for legal medical opinions.
Clinical method
Fast sequences, preferably for breath-hold
imaging with reasonably high spa-
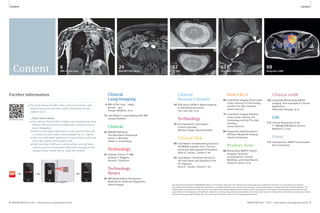
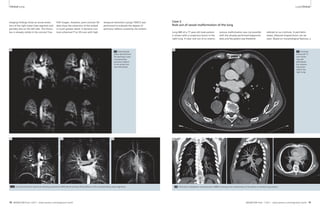
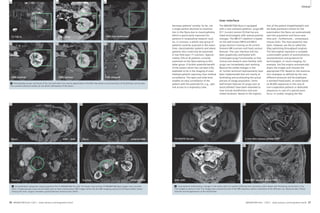
Table 1: Sequences for lung MRI
Sequence Key pathology Respiration Spatial Temporal 1.5T 3T
manoeuvre resolution resolution
VIBE pulmonary nodules breathhold high low + +
HASTE infiltrates breathhold low high + +
TrueFISP pulmonary embolism free breathing moderate high + (–)
STIR or lymph nodes multiple breathholds moderate low + +
T2 BLADE fs bone metastases
T2 BLADE nodules and masses multiple breathholds moderate moderate + +
T2 BLADE rt* masses free breathing moderate-high low + +
T2 TSE rt*
DWI nodules and masses multiple breathholds low low + +
TWIST perfusion deficit breathhold low high ++ +
fl 3D embolism AVM breathhold high low + ++
VIBE HASTE TrueFISP STIR T2 BLADE
1A 1B 1C 1D 1E
1F 1G 1H 1I 1J 1K
T2 BLADE rt T2 TSE rt DWI VIBE TWIST fl3D
1 Available sequences for chest imaging. For details see table 1.
tial resolution and short echo time (TE),
able to receive as much lung signal as
possible within the short interval before
signal decay are a technical challenge
for both, hardware and sequence design
[1]. Combining fast breathhold acquisi-tions
with parallel imaging (iPAT = inte-grated
Parallel Acquisition Techniques),
high temporal resolution MR angiogra-phy
(TWIST = time-resolved angiography
with stochastic trajectories) rotating
phase encoding (BLADE) and Navigator
technology (PACE = prospective acquisi-tion
correction), lung MRI has become a
fairly robust technique for broad clinical
application [2]. Nowadays, the Siemens
MAGNETOM user can select from a
‘buffet’ of protocols that have been
optimized for imaging lung diseases
(Fig. 1). A quick summary of the specific
properties of the sequences is listed in
Table 1. Suggested complete push-button
protocols for specific pathologies are
arranged in a protocol list at the scanner
and are practically ready to go. Figure
2A shows the improved protocol tree
with syngo MR D11D. Figure 2B gives a
list of protocols that are implemented
with software version syngo MR B17.
The packages cover different aspects of
lung pathology, from general purpose,
to specific sequence combinations for
imaging thoracic masses and high
resolution angiography, to functional
imaging with dynamic first pass lung
perfusion imaging. The rationale for
the protocol suggestion was to combine
different sequence techniques to cover
different weighting (T1, T2, balanced
T1/T2), to appreciate the particular
strengths of different techniques, to
cover all planes in at least one acquisi-tion
and to have diagnostic quality in
at least 3/5 series in the worst case
(e.g. uncooperative patient). Room times
from 15 minutes for a basic protocol,
20 minutes for a contrast-enhanced
study, to up to 30 minutes for a compre-hensive
study including perfusion
imaging, angiography and post-contrast
volumetric imaging are adjusted to the
needs of clinical workflow. Alternatives
for patients who have difficulties holding
their breath are offered. Free breathing
real time imaging with TrueFISP and
navigator-triggered acquisitions with
BLADE T2-TSE allow for excellent image
quality even in non-compliant patients.
For practical reasons, it is not needed to
use ECG-triggering and the non-contrast
enhanced basic protocol covers most
clinical questions. Robustness against
cardiac pulsation and respiratory motion
is achieved by short acquisition time
and (multi-)breathhold-imaging or respi-ratory
triggering.
*rt = respiratory triggered
6 MAGNETOM Flash 1/2011 · www.siemens.com/magnetom-world MAGNETOM Flash · 1/2011 · www.siemens.com/magnetom-world 7](https://image.slidesharecdn.com/magnetomflash46-00090326-140821154645-phpapp01/85/ISMRM-Edition-Issue-46-5-320.jpg)
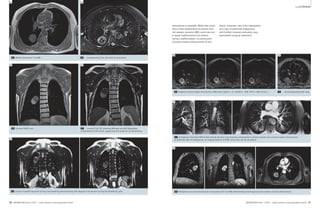
![Clinical Lung Imaging Lung Imaging Clinical
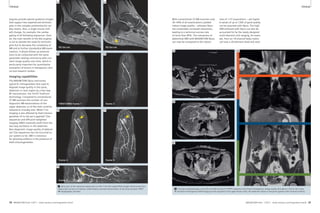
3A 3B
1 2 3 4 5
3A Selection of sequences for a ‘General-
Routine’ protocol from the list offered in
Fig. 1 and Tab. 1.
1: T1w VIBE, 2: T2w HASTE, 3: TrueFISP,
4: STIR or T2 BLADE fs, 5: T2 BLADE
In-room time 15 minutes 3B Detail of the protocol tree for general lung examinations.
4A 4B
4 Coronal multi-breathhold T2 BLADE acquisition in a patient with a large lung cancer in the left upper lobe and
mediastinal lymph node metastases.
‘General’ – the lung imaging
protocol for general purposes
The first branch of the protocol tree
contains a package for general purposes
(Fig. 3). It will be used for most lung
pathologies and large parts of it are inte-grated
into the other protocol branches.
The non-contrast-enhanced ’General
Routine’ protocol (in-room time 15 min)
comprises a coronal T2-weighted HASTE
(T2w single-shot half-Fourier TSE)
sequence with a high sensitivity for infil-trates
and a transversal VIBE (T1w
3D-GRE) sequence with a high sensitivity
for small nodular lesions (in particular
the contrast-enhanced, fat saturated
VIBE). Both are acquired in a single
breathhold. This is followed by a coronal
steady-state free precession sequence
(TrueFISP) in free breathing. This
sequence adds functional information
on pulmonary motion during the respi-ratory
cycle and heart function. Size,
shape and patency of the central pulmo-nary
vessels can be assessed. This part
of the protocol is highly sensitive for
central pulmonary embolism and gross
cardiac or respiratory dysfunction [3].
A further advantage is the excellent
robustness to motion. Despite potential
susceptibility and off resonance artifacts
the morphologic quality in lung imaging
challenges the image quality of other
parts of the protocol, e.g. of the VIBE
sequence. A motion-compensated coro-nal
BLADE (multi-breathhold T2w TSE) is
added to improve depiction of masses
with chest wall invasion and mediastinal
pathology such as masses, lymph nodes
or cysts (Fig. 4).
The protocol variant ‘Respiratory
Mechanics’ includes an additional coro-nal
series to be placed on top of the dia-phragm
and acquired during instructed
breathing with a temporal resolution
of 3 images per second. This can be used
for specific questions such as diaphrag-matic
palsy or lung tumor motion, e.g.
to detect attachment and infiltration of
a lesion to the chest wall. A final multi-breathhold
transversal fat-saturated T2w
TSE visualizes enlarged lymph nodes and
skeletal lesions.
2A
2A Protocol trees for chest imaging in the Exam Explorer window.
2B
2B Chest imaging protocols as already installed with syngo MR B17.
The protocol variation ‘Uncooperative’
(to be used for patients who have diffi-culties
holding their breath) comprises
respiration-triggered versions of the
T2-weighted TSE sequences (BLADE).
Their application increases the total
in-room time by approx. 10 minutes.
This non-contrast enhanced ‘General-
Routine’ study covers the majority of
clinical indications: Pneumonia, atelec-tasis,
pulmonary nodules and masses,
mediastinal masses (lymphoma, goiter,
cyst, thymoma), phrenic nerve palsy,
cystic fibrosis, tuberculosis, interstitial
lung disease, acute pulmonary embolism.
Detection rates for pulmonary infiltrates
with the basic protocol match CT and
make MRI a valuable alternative in par-ticular
for children, young patients and
pregnant women. The sensitivity for
lung nodules reaches 80–90% for lesions
>4 mm (100% for >8 mm). Both capaci-ties
are appreciated in follow-up studies
of cystic fibrosis patients using dedicated
scores for the extent of disease. In lung
cancer patients, MRI contributes to stag-ing
and atelectasis. Administration of
contrast material contributes to detect
tumor necrosis, chest wall or mediastinal
invasion and pleural reaction/carcinosis.
In many cases the further assessment
of an unclear pulmonary or mediastinal
mass, a pleural effusion of unclear origin
or pulmonary embolism will warrant
further contrast enhanced protocol ele-ments.
This is covered with the protocol
branch ‘Thoracic Mass’ which comprises
the basic protocol plus additional con-trast-
enhanced fat-saturated breathhold-
VIBE sequences (3D GRE) in transverse
and coronal orientations. To cut down
on imaging time, the transverse fat-sat-
8 MAGNETOM Flash 1/2011 · www.siemens.com/magnetom-world MAGNETOM Flash · 1/2011 · www.siemens.com/magnetom-world 9](https://image.slidesharecdn.com/magnetomflash46-00090326-140821154645-phpapp01/85/ISMRM-Edition-Issue-46-6-320.jpg)
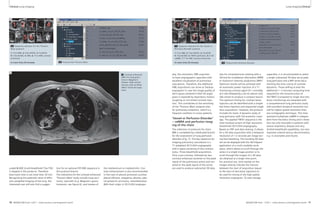
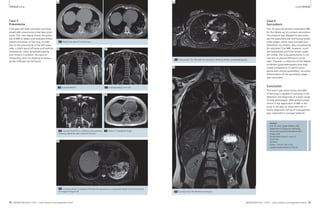
![Clinical Lung Imaging Lung Imaging Clinical
8B Protocol
tree ‘AVM-Embolism’.
8A 8B
1
4 2 3
1 2 3 4
10A
6 7 8
5
9
10A Sequence selection for the ‘Central
Mass’ protocol.
1: T1w VIBE, 2: T2w HASTE, 3: TrueFISP,
4: T2w STIR, 5: T2w BLADE, 6: DWI,
7: TWIST perfusion, 8: fl 3D ceMRA,
9: T1w VIBE contrast enhanced
In-room time 30 minutes
8A Sequence selection for the
‘AVM-Embolism’ protocol.
1: TrueFISP, 2: TWIST perfusion,
3: fl 3D ceMRA, 4: T1w VIBE contrast
enhanced
in-room time 15 minutes
9A 9B ule during the day. Nevertheless, this
The indications covered with the ‘Vessel
or Perfusion Disorder’ protocol include
acute and chronic pulmonary embolism
(PE), arterio-venous (AV) malformation
(e.g. Osler‘s disease), lung sequestration,
pulmonary arterial aneurysm, abnormal-ities
of pulmonary venous drainage and
any other pathology of lung vasculature.
Specific indications for the TWIST perfu-sion
appreciate the fact that this is the
only part of the protocol which indirectly
9 Two cases of
acute pulmonary
embolism. On
the left a case
with massive
embolism and
large thrombi
detected with
the TrueFISP
series, on the
right a small
embolus within
a segmental ves-sel,
in this case
detected with
the VIBE.
short examination provides comprehen-sive
information on pulmonary embo-lism
combining perfusion imaging with
the diagnostic scope of a scintigraphy
and lung vessel angiography comparable
to CT scanning (Fig. 9). An important
point is to start the examination with
TrueFISP non-contrast enhanced series.
In case of severe embolism the diagnosis
can be made within the first 60 seconds
of the examination with the option to
immediately stop imaging at that time
and to proceed to intensive treatment
without any time loss compared to CT
scanning.
‘Central Mass’ – have it all!
‘Central Mass’ is the most comprehen-sive
package of the protocol tree, con-taining
elements of all the aforemen-tioned
branches. It accounts for vessel
involvement by central lung or mediasti-nal
tumors with possible consequences
for lung perfusion. This includes
T2-weighted fat-saturated BLADE
sequences as well as DWI. Typically, it
would be used for the diagnosis of cen-tral
masses with infiltration into the pul-monary
arteries or aorta. ‘Central Mass’
is also a ‘have it all’ protocol for all cases
in which one would like to cover any
possible aspect with comprehensive
imaging – however, since this takes
approximately 30 minutes in-room-time,
for daily routine and the majority of indi-cations
it would be practicable to use
selective protocols.
10B
Protocol adaptations
for 3 Tesla
Originally, lung MRI protocols were
developed for 1.5 Tesla systems. The
majority of available publications are
based on work with this field strength.
Since high performance 3 Tesla scanners
have become the benchmark on the
clinical stage, serious effort was
invested into transferring lung MRI tech-nology
to the higher field strength. Ini-tially,
it was discussed that increased
susceptibility artifacts would make lung
imaging even more difficult on these
systems. However, systematic experi-mental
work and application fine tuning
have paved the road to the successful
introduction of lung imaging into the
high field world [4, 5]. In general, pro-ton
MRI of the lung is based on the
effect that most relevant pathologies
have intense signal and give optimum
contrast against the black background of
lung tissue. Consequently, transfer of
the protocols to a 3T system has even
improved the lesion to background con-trast
in infiltrative as well as solid lung
lesions for all FLASH and TSE sequence
types. In particular, lung nodule detec-tion
with the VIBE sequence as well as
the detection of infiltrates with HASTE
and STIR is improved on 3T images. This
opens the perspective to invest the
higher signal into higher spatial resolu-tion
or even faster image acquisition
schemes. Contrast-enhanced studies
after i.v. injection reach equal quality
visualizes defects or absence of lung
parenchyma due to emphysema or pneu-mothorax.
Furthermore, functional lung
perfusion impairment due to hypoventi-lation
and hypoxic vasoconstriction can
be easily detected (air-trapping in bron-chiolitis,
mucous impaction in cystic fibro-sis).
At this point, MRI includes specific
functional information that would be
difficult to obtain with CT.
However, conditions such as acute pul-monary
embolism are an emergency.
This requires immediate interaction and
will not allow for typical scheduling lead
times for an MR scanner. An abbreviated
version of the protocol was prepared
for this purpose (Fig. 8): It is limited to
four sequences focusing on lung vessel
imaging and lung perfusion. This can
be accomplished within 15 minutes in-room-
time which is considered accept-able
to be squeezed into a full MR sched-and
10B Protocol
tree ‘Central
Mass’.
with optimized technology first pass
perfusion studies can be performed in a
similar fashion [6]. Changes of image
quality with transfer of the aforemen-tioned
sequence concept to 3T are
therefore acceptable or even positive for
most sequence types.
The exception concerns TrueFISP
images, which show significant motion-and
flow-related artifacts at the higher
field strength. Delineation of vessel
walls and other structures is still good,
but lesion/background contrast does not
improve. In combination, the effects
result in an inhomogeneous signal of
the pulmonary artery trunk and the
large lobar vessels. Therefore, exclusion
of severe pulmonary embolism with a
quick free breathing TrueFISP acquisition
on a 3T system is not favorable. To fill this
gap in the protocol, a respiration-trig-gered
SPACE-STIR sequence was adjusted
for the visualization of central pulmo-nary
vessels without contrast injection.
The triggered acquisition scheme pro-duces
images of central mediastinal ves-sels
with bright signal within 4-5 min
and can be used on 1.5T as well as 3T.
Due to triggering, the acquisition is
robust even in uncooperative patients.
The respiration-triggered SPACE-STIR
sequence might therefore replace the
free breathing TrueFISP throughout the
whole protocol tree, although sensitivity
and specificity for pulmonary emboli
are subject to ongoing patient studies
(Fig. 12).
12 MAGNETOM Flash 1/2011 · www.siemens.com/magnetom-world MAGNETOM Flash · 1/2011 · www.siemens.com/magnetom-world 13](https://image.slidesharecdn.com/magnetomflash46-00090326-140821154645-phpapp01/85/ISMRM-Edition-Issue-46-8-320.jpg)
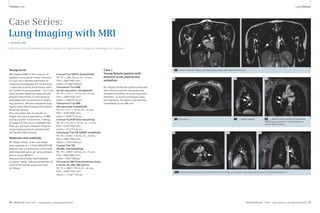
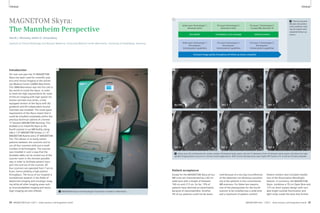
![Lung Imaging Clinical
13A 13B
13 Lung cancer patient with a tumor in the left upper lobe, adjacent atelectasis and pleural effusion. (A) Self-navigated coronal 3D FLASH of
the posterior thorax, free-breathing. (B) Coronal radial TSE image of the same patient at carina level, free-breathing.
matrix : 256 x 320 x 44, FOV 370 x 450
x 220 mm3, resolution 1.4 x 1.4 x 5 mm3,
total acquisition time 375 s (Fig. 13).
In the same trend, Fourier decomposi-tion
ventilation-perfusion scanning is
being developed as a robust technology
for regional assessment of lung function
with a non-contrast enhanced free
breathing acquisition scheme. Periodic
changes of parenchyma signal with
inspiration depth (highest signal with
lowest pulmonary air content in expira-tion)
and heart action (lowest signal
with maximum blood flow in systole)
will be evaluated separately to produce
ventilation and perfusion maps with
comparable quality to a V/Q SPECT
without the use of contrast media or
radiation exposure to the patient [7].
Just these two examples indicate the
dynamic development in the field of lung
MRI and its bright future perspectives.
In conclusion, lung MRI has made it from
a niche technology to the doorsteps of
clinical routine imaging. On MAGNETOM
Aera and MAGNETOM Skyra lung proto-cols
are ready to go! For key clinical
questions lung MRI not only matches
X-ray and CT, it offers additional func-tional
imaging capacities. The protocol
tree offers solutions for tricky problems
of daily routine and makes MRI more
than a good option for pediatrics and
science. Dedicated parts of the protocol
are fairly robust accounting for respira-tory
motion and heart action even in
uncooperative patients. Experience with
this young technology, e.g. in compari-son
with CT, is growing rapidly in an
increasing number of centers world-wide.
The perspectives for further devel-opments
are excellent and the degrees
of freedom to adapt the suggested
protocols for the users own purposes
are large. Get ready … get set … go!
References
1 Puderbach M, Hintze C, Ley S, Eichinger M,
Kauczor HU, Biederer J (2007) MR Imaging of the
Chest. A practical approach at 1.5 T. European
Journal of Radiology Eur J Radiol. 64:345-355.
2 Biederer J, Puderbach M, Hintze C (2006) A Prac-tical
Approach to Lung MRI at 1.5 T. Magnetom
Flash 2/2006:38-43 (Siemens MR Customer
Magazine, Siemens AG, München).
3 Kluge A, Gerriets T, Muller C, Ekinci O,
Neumann T, Dill T, et al. [Thoracic real-time MRI:
experience from 2200 examinations in acute
and ill-defined thoracic diseases]. Rofo 2005;
177(11):1513-21.
4 Fink C, Puderbach M, Biederer J, Fabel M, Dietrich
O, Kauczor HU, Reiser M, Schönberg S (2007)
Lung MRI at 1.5T and 3T: Observer preference
study and lesion contrast using five different
pulse sequences. Investigative Radiology 42:
377-383.
5 Fabel M, Wintersperger BJ, Dietrich O, Eichinger
M, Fink C, Puderbach M, Kauczor HU, Schoenberg
SO, Biederer J (2009) MRI of respiratory dynam-ics
with 2D steady-state free-precession and 2D
gradient echo sequences at 1.5 and 3 Tesla: an
observer preference study. European Radiology
19:391-399.
6 Attenberger UI, Ingrisch M, Dietrich O, Herrmann
K, Nikolaou K, Reiser MF, u. a. (2009) Time-resolved
3D pulmonary perfusion MRI: compari-son
of different k-space acquisition strategies
at 1.5 and 3 T. Invest Radiol. 44:525-531.
7 Bauman, G., Puderbach, M., Deimling, M.,
Jellus, V., Chefd hotel, C., Dinkel, J., Hintze, C.,
Kauczor, H., und Schad, L. R. (2009) Magn
Reson Med 62, 656-664.
Contact
Prof. Dr. med. Jürgen Biederer, MD
Department of Diagnostic Radiology
University Hospital Schleswig-Holstein,
Campus Kiel
Arnold-Heller-Street 3, Haus 23
24105 Kiel
Germany
Phone: + 49 431-597-3153
juergen.biederer@rad.uni-kiel.de
11
12A 12B
Future perspectives
A quick glance at the current investiga-tions
on proton MRI of lung pathology
illustrates the trend towards further
improvement in robustness and repro-ducibility
of image quality. Free-breath-ing
self-navigated sequence designs,
radial k-space methods including ultra-short-
echo-time imaging and dynamic
as well as quantitative lung imaging
protocols for improved anatomical and
functional lung assessment are currently
under investigation.
A consortium of medical physics and
radiology departments at Würzburg, Kiel,
Heidelberg and Mannheim supported
by the German Research Foundation
(Deutsche Forschungsgemeinschaft;
DFG) is currently on the way to develop-ing
2D- and 3D imaging protocols based
on the Siemens MAGNETOM Avanto
platform for high-resolution lung MRI.
One key sequence for 3D-MRI of the
lung with full volume coverage is a self-navigated
T1-weighted 3D FLASH with
quasi-random k-space ordering. Under
free-breathing condition five to seven
full 3D acquisitions are acquired using
additionally sampled non-spatially
encoded DC-signals at the center of
k-space as navigator. This approach is
11 Coronal multi
breathhold T2w
BLADE; healthy
volunteer, 3T
MAGNETOM Verio.
12 Coronal
respiration
triggered SPACE
STIR acquisition
in a 67-year-old
man, using a
1.5T MAGNETOM
Avanto (left).
30-year-old
healthy volunteer
using a 3T
MAGNETOM Skyra
(right).
rather time efficient, since it does do not
require separate RF excitations, and the
DC-signal at the center of k-space con-tains
sufficient information to reliably
detect motion. Therefore, there are dou-ble
benefits: Almost motion-free parallel
acquisition of multiple breathing phases
will either allow for detail motion analy-sis
or for morphologic imaging without
patient compliance. A key modification
necessary for self-navigation was an
extra data acquisition immediately after
each imaging echo. Typical imaging
parameters for the 3D-flash technique
are: TE 1.2 msec, TR 3.8 msec, 7º,
14 MAGNETOM Flash 1/2011 · www.siemens.com/magnetom-world MAGNETOM Flash · 1/2011 · www.siemens.com/magnetom-world 15](https://image.slidesharecdn.com/magnetomflash46-00090326-140821154645-phpapp01/85/ISMRM-Edition-Issue-46-9-320.jpg)
![Technology Technology
1 2
1 The NYU 7 Tesla scanner. 2 Sagittal image of the ankle of a healthy adult subject.
how a standard 3T clinical neuro imag-ing
protocol can be translated to 7T,
illustrating both advantages and chal-lenges
of ultra-high-field imaging, and
presenting the opportunity to obtain
familiar image contrasts while also explor-ing
higher resolution and new contrast
mechanisms in a single 7T scan session.
The musculoskeletal system has become
another highly fruitful area of 7T appli-cation,
and we begin our catalogue of
images there, proceeding from foot to
head. Body imaging at 7T (e.g. targeting
the heart, abdomen, or pelvis) continues
to present unique challenges at 7T.
However, 7T body imaging has been the
subject of intensive recent attention,
with striking examples provided and cre-ative
approaches undertaken by various
ultra-high-field research groups. As men-tioned
earlier, parallel transmission and
other related methods are currently under
investigation to mitigate the particularly
substantial B1 inhomogeneities observed
over large fields-of-view in the torso,
and also to control SAR. Meanwhile
robust imaging of selected body areas
such as the breast may already be
obtained at 7T with conventional single
channel excitation.
Note high-resolution depiction of cartilage and trabecular bone.
(Fat-suppressed 3D FLASH, 0.23 x 0.23 x 1 mm3, TR/TE 26/5.1 ms,
60 partitions, acquisition time 6:58 min, custom-designed
transmit-receive extremity coil array with 8 receive elements.)
At our institution, the past year or two
has seen a surge of clinical interest in our
7T scanner, as clinical colleagues in our
Department of Radiology and elsewhere
have partnered with our basic research-ers
to probe anatomical details and patho-logic
processes for which key informa-tion
has proven to be elusive at lower
field strength. The backlog and hours of
use of our 7T system have both increased
markedly, and it has become an increas-ingly
commonplace occurrence to find a
radiologist at the console. The images
that follow, all obtained on the Siemens
MAGNETOM whole-body 7T scanner at
the Center for Biomedical Imaging at
NYU School of Medicine (Fig. 1), illustrate
some of the multifaceted clinical prom-ise
of 7T MRI. These images, which we
have sorted by body region and, when
appropriate, disease process, are intended
to indicate the image quality which may
now be achieved at 7T with modern RF
coil arrays and pulse sequences. The
examples shown here represent only a
subset of in vivo 7T scans at our center,
and an even smaller subset of the work
being done at a growing number of
Siemens 7T sites around the world.
Ankle
Figure 2 shows a sagittal image of the
ankle obtained at 0.23 x 0.23 mm2
in-plane resolution in a healthy adult
subject using a custom-designed trans-mit-
receive extremity coil array [1]. Note
the high-resolution depiction both of
cartilage and of trabecular bone in this
image. Although no particular pathology
is evident in this example, the ability to
resolve cartilage and bone structure at
this level becomes a powerful asset for
the detection and characterization of dis-ease
processes like those in the examples
to follow.
Knee
Osteoarthritis
Figures 3 and 4 compare 7T scans of
healthy adult subjects with correspond-ing
scans of patients with radiographi-cally
documented osteoarthritis. Each of
these images was obtained using a
28-element 7T knee coil array developed
by Quality Electrodynamics (QED), LLC
[2] and expected to be available com-
Towards Clinical 7T MRI
Graham C. Wiggins, D Phil; Daniel K. Sodickson, MD, PhD
Center for Biomedical Imaging, Department of Radiology, New York University Langone
Medical Center, New York, NY, USA
Introduction
Many researchers in the field of ultra-high-
field magnetic resonance have
become accustomed to bracing them-selves
for an oft-repeated question. This
question may arise during lulls in con-versation
with clinical colleagues, or
during interviews with interested visitors
from the press or the lay public, or, more
delicate still, during reviews of our appli-cations
for research funding. The ques-tion
is brief, and to the point: ‘When will
7 Tesla scanners be ready for clinical
use?’ Each of us has his or her own vari-ant
on a standard answer to this ques-tion,
citing particular populations or
disease processes in which we have
obtained extraordinarily promising
images, and outlining the technical hur-dles
which are gradually falling behind
us as research advances. This twofold
answer actually encapsulates two dis-tinct
strains of 7T research, each of
which has an important part to play in
defining the eventual clinical role of 7T
MR. The first involves identification of
unique information available only at
ultra-high field strength, enabled for
example by extremely high spatial and
spectral resolution or by contrast mech-anisms
which are enhanced as field
strength increases. The potential to
access this unique information helped
to motivate the original development
of commercial 7T scanners, and fueled
a great sense of enthusiasm as the first
whole-body 7T systems arrived on the
scene and the first jaw-dropping images
began to emerge from those systems.
This initial period of exuberant discovery
was followed by an equally fascinating
but also laborious period of extended
basic development, during which 7T
research teams began to grapple with
the fact that not only the potential infor-mation
content but also the routine oper-ations
of 7T scanners differed from what
we had come to expect with lower-field
scanners. Coils and pulse sequences
required careful redesign and optimiza-tion,
artifacts only hinted at in low-field
settings became critical determinants of
image quality at 7T, and new constraints
on sequence types and parameters
changed both the workflow and the con-tent
of day-to-day imaging protocols. In
the past several years, a growing cadre
of high-field researchers has risen to
these challenges, seeking to identify the
novel RF structures, calibration proce-dures,
and spin manipulations that can
eke the best performance out of 7T
scanners. The goal of this second strain
of research, occurring in parallel with
the first, is to replicate some of the
breadth and routine image quality of
low-field scans, overcoming any and all
practical obstacles along the way. Such
nominally replicative research has actu-ally
spurred a remarkable range of tech-nological
and methodological innova-tion:
witness the rise of parallel trans-mission
techniques, reported in previous
editions of this magazine, which have
become a common component in many
7T research programs but which have
already begun to have an impact on
lower field strengths. Perhaps of equal
importance, however, is the fact that
research aimed at achieving high image
quality across multiple examination
types and body regions addresses an
important requirement for what might
be considered an ideal clinical 7T imag-ing
platform: the ability to provide
unique clinically-relevant information for
a variety of disease processes without
sacrificing traditional clinical image con-tent
in routine examinations. A 7T scan-ner
with this ability need not be rele-gated
to research tool or niche diagnos-tic
device, but can take its place as a
valuable component of the day-to-day
clinical arsenal. This article reports on
recent developments in the twofold pur-suit
of unique information content and
routine usability at 7T, drawing exam-ples
from imaging experience at our
institution. The clinical transformation
of 7T scanning is by no means complete,
but the picture that has begun to
emerge is striking.
Unique clinical potential:
A gallery of pathology-targeted
7T images from toe to head
The principal advantages of ultra-high
field strength for MR imaging are
a) increased signal-to-noise-ratio (SNR),
which can be used to increase spatial
resolution, to shorten scan time, and/or
to enable imaging of low-sensitivity
nuclei other than hydrogen; and
b) enhanced contrast mechanisms such
as those based on susceptibility-related
effects. The corresponding challenges
associated with 7T MRI include increased
inhomogeneity of the RF transmit and
the B0 fields (which result in increased
artifacts in various classes of pulse
sequence) and increased RF energy
deposition into tissue, as quantified by
specific absorption rate (SAR), which can
limit the range of sequence parameters
which may safely be employed. 7T MRI
of the brain has now become fairly rou-tine,
with the availability of reliable high-performance
head coils, and high qual-ity
images in a variety of contrasts can
be obtained. We will demonstrate later
32 MAGNETOM Flash 1/2011 · www.siemens.com/magnetom-world MAGNETOM Flash · 1/2011 · www.siemens.com/magnetom-world 33](https://image.slidesharecdn.com/magnetomflash46-00090326-140821154645-phpapp01/85/ISMRM-Edition-Issue-46-18-320.jpg)
![Technology Technology
mercially in the near future. The 0.23 x
0.23 mm2 in-plane spatial resolution of
the sagittal images in Figure 3 is sufficient
for direct visual appreciation of the dif-fusely
thinned and irregular cartilage
surface in the osteoarthritic patient. The
images in Figure 4, on the other hand,
are targeted to microscopic changes in
cartilage structure and function. In addi-tion
to anatomical images and T2 maps,
maps of apparent diffusion constant
(ADC) and fractional anistropy (FA) are
shown, derived from line-scan diffusion
acquisitions. The decreased FA in the car-tilage
of subjects with osteoarthritis is
consistent with structural damage to the
collagen network. The increased ADC, on
the other hand, may be shown to result
from reduced proteoglycan content.
Figure 5 illustrates the potential value
of 7T scanning for a complementary
evaluation of proteoglycan content, and
therefore of cartilage function. These
images represent various slices through
3D volumetric sodium concentration
maps encompassing the whole knee in
a healthy subject as compared with a
patient with osteoarthritis (OA). The
enhanced SNR available at 7T enabled
whole-knee acquisitions at 2 mm isotro-pic
resolution in less than 15 minutes.
Such acquisitions would not be possible
at lower field strengths, given inherently
low MR sensitivity to sodium nuclei.
Through appropriate calibration, sodium
images were converted into quantitative
Healthy subject (average [Na] ~ 240-280 mM in 5 healthy subjects)
5B 5C 5D
Patient with OA (average [Na] ~ 180-240 mM in 5 patients)
5A
sodium concentrations, which may be
seen to be generally decreased in the
osteoarthritic as compared with the
healthy knee cartilage. Indeed, the aver-age
sodium concentration across the
knee cartilage in 5 patients with OA was
noticeably lower than that in a group of
5 healthy controls. This change reflects a
loss of proteoglycans, the removal of
whose net negative charge results in a
corresponding loss of positively-charged
sodium ions to preserve charge balance.
5E 5F 5G 5H
5 7T sodium imaging of cartilage in a healthy subject (top) and a patient with osteoarthritis (bottom). 7T field strength enabled whole-knee
3D volumetric sodium concentration maps at comparatively high resolution in less than 15 minutes. Note reductions in average sodium
concentration in arthritic versus healthy cartilage, both in the individual knees shown and in ensembles of 5 patients and 5 controls.
(Undersampled 3D radial pulse sequence, TR/TE 80/0.2 ms, 2.0 x 2.0 x 2.0 mm3, single-tuned quadrature sodium coil custom-designed in
collaboration with Rapid Biomedical, GmbH. Images courtesy of Ravi Regatte, Ph.D., Department of Radiology, NYULMC, USA.)
3 The high spatial reso-lution
available at 7T
enables visualization of
the diffusely thinned
irregular cartilage sur-face
in a patient with
osteoarthritis (right), as
compared with an age-matched
healthy subject
(left). (Fat-suppressed 3D
FLASH, TR/TE 26/5.1 ms,
0.23 x 0.23 x 1 mm3, 60
partitions, acquisition
time 6:58 min, transmit-receive
7T knee coil array
with 28 receive elements
from QED. Images cour-tesy
of Gregory Chang,
M.D., Department of
Radiology, NYULMC,
USA).
3A
55-year-old male – Healthy
Normal thickness
Smooth surface
51-year-old male – Osteoarthritis
Diffusely thinned
Irregular surface
3B
Healthy Osteoarthritis
Anatomical image T2 (ms) Anatomical image T2 (ms)
4A
4B
0 35 0 35
ADC (10-3mm2/s) FA ADC (10-3mm2/s) FA
4C 4D
4E 4F
4G 4H
0 2.5 0 1 0 2.5 0 1
4 Apparent diffusion constant (ADC) and fractional anisotropy (FA) maps derived from line-scan diffusion acquisitions (bottom row) juxtaposed
to anatomical images and T2 maps in the knees of a healthy adult subject (left) and a patient with osteoarthritis (right). Increased ADC and
decreased FA are seen in diseased tissue, reflecting microscopic changes in the fiber structure of the cartilage. (Line Scan Diffusion Tensor
Imaging sequence: TE/TR/TReff 46/180/2890 ms, 0.6 x 0.6 x 2 mm3, 5 slices, b-values 5, 450 s/mm2, 6 directions, fat-saturation, acquisition time
14:00 min; Anatomical images: T2*-weighted fat-saturated GRE, TE/TR 9.2/40 ms, 0.5 x 0.5 x 0.5 mm2, acquisition time 10:00 min; T2-mapping
acquisitions: multi-slice 2D multi-echo fat-saturated sequence with stimulated echo suppression, TE/TR 16/3500 ms, 0.6 x 0.6 x 2 mm3, 5 slices, echo
train length 8, acquisition time 13:35 min. QED 28-element 7T knee array used in all cases. Images courtesy of Jose Raya, Ph.D., NYULMC, USA.)
34 MAGNETOM Flash 1/2011 · www.siemens.com/magnetom-world MAGNETOM Flash · 1/2011 · www.siemens.com/magnetom-world 35
350
300
250
200
150
100
50
0
350
300
250
200
150
100
50
0](https://image.slidesharecdn.com/magnetomflash46-00090326-140821154645-phpapp01/85/ISMRM-Edition-Issue-46-19-320.jpg)
![Technology Technology
Osteoporosis
In Figure 6, osteoporotic changes in
trabecular bone structure may be appre-ciated
directly from axial 7T images,
rather than being probed indirectly
through projection-based densitometry.
This enables assessment not only
of bone density but also of bone quality
[3, 4]. The image of the osteoporotic
patient shows fewer and more
widely-separated dark trabeculae with
larger marrow spaces between them.
This structure reflects a reduced bone
strength and a correspondingly
increased fracture risk. In fact, it is
believed that bone density alone
accounts for only 50–60% of the
fracture risk in osteoporotic patients,
with the remaining risk attributable
to bone quality [3]. Thus, 7T imaging
has the potential to improve our ability
to assess bone strength and clinical
fracture risk.
6 Images of the distal femur
of a healthy subject (left) and
a patient with osteoporosis
(right). Note the reduction in
density of trabecular bone
structure in the patient as
compared with the control
(for example, in the circled
regions of interest). (3D
FLASH, TR/TE 20/5.1ms, 0.23
x 0.23 x 1.0 mm3, 80 parti-tions,
acquisition time 7:09
min, QED 28-element knee
coil array. Images courtesy of
Gregory Chang, M.D., Depart-ment
of Radiology, NYULMC,
USA.)
6A 6B
55-year-old female – Healthy 76-year-old female – Osteoporosis
Wrist
Carpal Tunnel Syndrome
In collaboration with interested sur-geons
at our institution, we have begun
to study patients with Carpal Tunnel
Syndrome at 7T. The resulting high-reso-lution
depiction of structures surround-ing
and running through the carpal tun-nel,
as exemplified in Figures 7 and 8,
will enable definitive diagnosis, as well
as helping to define surgical approaches
and allowing the creation of detailed
anatomical atlases in the presence and
the absence of pathology.
7 Images from a 0.33 mm3
isotropic 3D gradient-echo
acquisition in a patient with
Carpal Tunnel Syndrome.
The red lines in the top right
image indicate the image
plane geometry of the bottom
two images. The anatomy
within the carpal tunnel is
clearly delineated, and pro-nounced
swelling of the
median nerve may be appreci-ated.
(3D FLASH, TR/TE 40/3.2
ms, 0.33 x 0.33 x 0.33 mm3,
128 partitions, acquisition
time 7:10 min, custom-built
8-element 7T extremity coil
array. Images obtained as
part of a collaboration with
Dr. David Chiu, Department of
Surgery, NYULMC, USA.)
8 2D spin-echo
images of a
patient with Car-pal
Tunnel Syn-drome.
Individual
fascicles of the
inflamed median
nerve can be
tracked even
through the con-striction
at the
carpal tunnel.
(2D TSE, TR/TE
5500/87 ms,
0.2 x 0.2 x 1 mm3,
13 slices,
Turbo Factor 13,
acqui-sition time
3:35 min, custom-built
8-element
7T extremity coil
array. Images
obtained as part
of a collaboration
with Dr. David
Chiu, Department
of Surgery,
NYULMC, USA.)
7A 7B
7C 7D
8A
8B
8C
36 MAGNETOM Flash 1/2011 · www.siemens.com/magnetom-world MAGNETOM Flash · 1/2011 · www.siemens.com/magnetom-world 37](https://image.slidesharecdn.com/magnetomflash46-00090326-140821154645-phpapp01/85/ISMRM-Edition-Issue-46-20-320.jpg)
![Technology Technology
11A 11B 11C
3T
7T QED 7T NYU
11 Comparison of 3T (left, In Vivo Corp. 4-element receive coil array) and 7T breast images (middle: QED 16-element coil array; right: NYU custom-designed
2-element coil array). 7T images have significantly higher SNR for the same image resolution and total acquisition time. (3D GRE with Fat
Saturation, TR/TE 4.37/1.92 ms, 0.6 x 0.6 x 0.6 mm3, 208 partitions, acquisition time 4:28 min. Images courtesy of Ryan Brown, Ph.D., NYULMC, USA.)
Thoracic Spine
Cavernoma
Figure 9 documents the case of a
19-year-old patient whose cavernous
angioma at thoracic spinal level T5 was
discovered incidentally on a 1.5T MR
scan at another institution following a
sporting accident. Subsequent 3T imag-ing
was also performed in an attempt to
determine the feasibility and advisability
of surgery for this otherwise asymptom-atic
young man, but image quality was
insufficient to define the detailed inter-nal
structure of the lesion and the sur-rounding
spinal cord. The family came
to our center in the hope that 7T imag-ing
could further inform their decision
and guide a potential surgical approach.
A team of physicists, RF engineers, tech-nologists,
neuroradiologists, and spinal
surgeons was mobilized to address this
challenging question. Figure 9 shows
sagittal images at two magnifications
highlighting the lesion. Using a custom-built
8-channel transmit-receive 7T spine
array [5] and optimized gradient-echo
and spin-echo pulse sequences, nearby
cord structure could be defined with
unprecedented detail. Unfortunately,
residual blood products in the vascular
lesion resulted in susceptibility-related
signal voids in the immediate vicinity of
the lesion, preventing ideal delineation.
Work is now underway to apply suscepti-bility-
insensitive approaches for further
improved visualization. This example
highlights both the promise and some of
the ongoing practical challenges associ-ated
with clinical 7T studies.
Cervical Spine
Figure 10, on the other hand, shows
the exquisite delineation of spinal cord
substructure which may be achieved
at 7T in regions not subject to high sus-ceptibility
gradients. In these images,
obtained with a 4-element transmit-receive
C-spine coil array from Rapid Bio-medical,
GmbH, excellent spatial detail is
observed, differentiating gray/white mat-ter
tissue, dorsal and ventral nerve roots,
denticulate ligaments, dura mater, pia
mater, and rostral-caudal blood vessels.
Breast
Figure 11 compares breast images
obtained in the same healthy adult
subject at 3T and at 7T. Substantial
increases in SNR are evident for the
same spatial resolution and total acquisi-tion
time in the 7T images. 3T images
were acquired using a commercially-available
4-element receive-only 3T
breast array from In Vivo Corp. 7T
images were acquired both with a com-mercial
transmit-receive breast coil array
with 16 receive elements from QED and
with a custom-designed 2-element
transmit-receive breast array developed
at our Center. Our custom-designed 7T
coil array has also been used to charac-terize
the distribution of T1 and T2 values
and B0 field distribution in healthy breast
tissue [6], in preparation for clinical
studies to come. Some further develop-ment
and pulse sequence optimization
is called for to reap the full benefits of
7T SNR enhancements, but 7T imaging
may be expected to shift favorably the
balance of spatial and temporal resolu-tion
which is so crucial for characteriza-tion
of breast cancer.
9 Sagittal 7T images
(left, full field-of-view; right,
close-up of boxed area) of the
spine of a 19 year-old male
with a cavernous angioma at
T5 discovered incidentally on
earlier lower-field MR scans.
Imaging at 7T improved
spatial resolution and lesion
visualization as compared
with 1.5T and 3T scans,
though certain details are still
obscured by susceptibility
artifacts from residual blood
products. (2D TSE 0.55 x 0.55
x 1.5 mm3, TR/TE 6000/10 ms,
11 slices, acquisition time
4:55 min, custom-built trans-mit-
receive 7T spine array
with 8 receive elements.)
10A 10B
10C
10D
C1
C2
C3
10 High spatial resolution enables noninvasive visualization of spinal cord structure with unprecedented detail. (2D gradient echo, 0.18 x 0.18 x
3.0 mm3, TR/TE 500/4.91 ms, 5 slices, 4 element transmit-receive C-spine array from Rapid Biomedical GmbH. Images courtesy of Eric Sigmund, Ph.D.,
Department of Radiology, NYULMC, USA.)
9
38 MAGNETOM Flash 1/2011 · www.siemens.com/magnetom-world MAGNETOM Flash · 1/2011 · www.siemens.com/magnetom-world 39](https://image.slidesharecdn.com/magnetomflash46-00090326-140821154645-phpapp01/85/ISMRM-Edition-Issue-46-21-320.jpg)
![Technology Technology
Brain
For neurological applications, the high
intrinsic SNR and the correspondingly
high achievable spatial resolution at 7T
may be used to resolve brain structures
which have until now eluded direct visu-alization
with MR. Susceptibility- or
T2*-weighted images in particular can
provide extraordinarily high levels of
anatomical detail, in addition to afford-ing
striking tissue contrast, some of
whose precise physical sources are still
being investigated. At NYU we have
begun to scan volunteers with a variety
of known brain diseases to begin explor-ing
what new clinically- and biologically-relevant
information may be found at 7T.
Tuberous sclerosis
Recently, a collaboration has arisen
between basic researchers, pediatric
neuroradiologists, pediatric neurosur-geons,
and epileptologists at our institu-tion,
aimed at investigating the biologi-cal
substrate of tuberous sclerosis, a
group of genetic disorders with a spec-trum
of symptoms including potentially
intractable seizures. Figure 12 shows
images from a patient with tuberous
sclerosis. This patient was imaged first
with a high resolution T1-weighted
MPRAGE sequence and then with a 3D
FLAIR sequence. The high isotropic spa-tial
resolution of these images allows
visualization not only of tubers (like the
one indicated by red arrows in the fig-ure),
but also of subtle signs of cortical
dysplasia (blue arrow).
13
MPRAGE FLAIR Control
12 Depiction of
cortical tuber (red
arrows) at 7T with
0.8 mm isotropic
MPRAGE (left) and
1 mm isotropic
SPACE FLAIR (right).
A thin ribbon of grey
matter can be seen
tracking in towards
the ventricle in an
axial view (bottom
left, blue arrow) –
an example of corti-cal
dysplasia. The
tuber is hyperin-tense
in the FLAIR
images (right).
(MPRAGE, 0.8 x 0.8
x 0.8 mm3, TR/ TE
2250/3.8 ms, TI
1100 ms, acquisi-tion
time 5:30 min;
SPACE-FLAIR, 1.0 x
1.0 x 1.0 mm3,
TR/ TE 8000/380 ms,
TI 2100 ms, 160
partitions, acquisi-tion
time 9:39 min.
Nova Medical Inc
single-element
transmit 24-element
receive 7T close-fit-ting
brain array.)
as these is now being contemplated to
identify prodromal individuals at risk
of developing schizophrenia, in time to
initiate preventive treatment before
development of chronic life-altering
mental illness. Considering the early age
of onset of schizophrenia (typically in
the late teens to early 20s), prevention
has significant social and economic con-sequences.
13 T2*-weighted
GRE images of a
normal control
(left) and a
schizophrenic
patient (right).
Notice the
smooth regular
contour of the
inferior border of
the hippocampus
and the well-defined
dentate
granule cell layer
in the control, as
compared to the
ridged appear-ance
of the infe-rior
border and
poor visibility of
the dentate layer
in the patient
(arrows). Note
also the high
contrast in the
basal ganglia and
in small blood
vessels through-out
the brain.
(T2*-weighted 2D
gradient-echo
sequence, TR/TE
944/25 ms,
0.232 × 0.232
×1.0 mm3, 17
slices, acquisition
time 14:00 min.
Nova Medical Inc
24-element 7T
head array.
Images courtesy
of Oded Gonen,
Ph.D., NYULMC,
USA.)
12A 12B
12C 12D
Schizophrenia
Another collaboration between the
Departments of Psychiatry and Radiol-ogy
at our institution resulted in the
recent publication of 7T images of the
human hippocampus in vivo [7], with
spatial resolution sufficient to visualize
directly such small but important struc-tures
as the dentate granule cell layer,
which is known to be a locus of neural
stem cells. Figure 13 extends this work,
showing a direct comparison of coronal
and sagittal images between a schizo-phrenic
patient and a healthy control.
The smooth regular contour of the infe-rior
border of the hippocampus and the
well-defined dentate granule cell layer
in the healthy subject may be compared
to the ridged appearance of the inferior
border and general poor visibility of the
dentate layer in the patient. Note that
the dentate granule cell layer cannot be
seen in images taken at lower magnetic
field strengths. The use of images such
Patient
40 MAGNETOM Flash 1/2011 · www.siemens.com/magnetom-world MAGNETOM Flash · 1/2011 · www.siemens.com/magnetom-world 41](https://image.slidesharecdn.com/magnetomflash46-00090326-140821154645-phpapp01/85/ISMRM-Edition-Issue-46-22-320.jpg)
![Technology Technology
216 v
243 v 270 v
297 v 324 v 351 v
14 In-house-developed ‘B1 Scout’, which applies a non-selective preparation pulse of different magnitudes before a TurboFLASH readout.
The preparation pulse corresponds to 90 degrees flip at the transmitter reference voltage listed below each image. Black areas represent regions
where the preparation pulse achieved a 90 degree excitation. With a transmitter reference of 270 volts we achieve the prescribed flip angle at
the center of the head. (TR/TE 2000/1.3 ms, BW 2000, flip angle 8°, 4.7 x 4.7 x 8 mm3, acquisition time 0:12 min.)
T1-weighted MPRAGE, axial HemoFLASH,
axial Diffusion, and possibly also sagittal
FLAIR. Imaging with this 3T protocol is
typically performed using the standard
Siemens 12-channel Matrix head coil. At
7T we use what has become our work-horse
off parameters in the various imaging
sequences to address issues of inhomo-geneity
Capturing routine clinical 14
information:
Towards a general purpose clinical 7T
neuroimaging protocol
Despite the extraordinary image quality
available for selected applications, as
evidenced by the examples provided ear-lier
in this article, potential clinical
enthusiasm for 7T imaging has been hin-dered
by concerns about its ability to
support the range of sequence types and
provide the range of image contrasts
used for routine clinical evaluations at
lower field strengths. In this section, we
demonstrate that, with appropriate RF
coils and pulse sequence modifications,
7T can in fact provide image quality at
least equivalent to that available at 3T
for a typical clinical neuroimaging proto-col.
We have developed a set of proto-cols
at 7T which aim to match or exceed
the image quality and coverage of the
standard 3T clinical protocol within the
same total scan time. This makes it pos-sible
to obtain a set of images which cor-respond
closely to familiar 3T scans, but
also to take advantage of the unique
benefits of 7T through increased resolu-tion
or through adding on to the proto-col
specific scans of interest such as
T2*-weighted GRE, very high resolution
MP2RAGE, or Time-of-Flight angiogra-phy,
obtaining precisely co-registered
images in a single scan session. We have
chosen certain strategies for optimiza-tion
of the 7T protocols, but make no
claim that these are the optimum
sequences for the purpose and offer
them primarily as an example and a
starting point for others.
While there are particular sequences
which routinely produce superior results
at 7T than at lower field strength, for
maximum diagnostic power the clinician
would like to have images of the whole
brain in a number of standard contrasts
and formats. A typical 3T clinical brain
protocol at NYU includes axial
T2-weighted TSE, axial FLAIR, axial
7T head coil array – a single-ele-ment
transmit, 24-element receive head
array from Nova Medical, Inc (the same
coil used to obtain the images in Figures
12–13). Note that Nova Medical has also
developed a 32-element head array of
similar design for use at 7T, and this
array is available as part of the Siemens
7T coil portfolio. Both 7T arrays have
very close-fitting geometries, which
gives them an advantage in SNR com-pared
to the larger Matrix coil, above
and beyond the SNR increase due solely
to the increased magnetic field strength.
Our image comparisons, therefore,
should not be taken as a strict study of
field-strength-related behavior, but
rather as an investigation into whether
we can use available equipment at 7T to
match or exceed the accepted clinical
standard at 3T. One additional caveat
regarding presentation of the images to
follow involves image intensity normal-ization,
which we have used in most
cases to remove the variation in bright-ness
caused by the sensitivity profiles of
the receive array. At lower field strength,
the body coil can be used as a relatively
uniform reference to determine the bias
field, but there is no clear uniform refer-ence
at 7T. While there is a 2D normal-ization
filter on the scanner, it is not
always able to correct for steep intensity
gradients near the receive elements, and
it is not appropriate for 3D scans. There-fore,
for this article we have processed
7T images with an off-line intensity nor-malization
algorithm provided with the
Firevoxel software, a data analysis tool
developed by researchers at NYU [8].
For the interested reader, detailed scan
parameters for 3T and 7T protocols will
be provided in an online supplement to
this article (see URL reference at the
end). By leveraging the increased SNR
at 7T and by carefully calibrating the
required transmit power, we can trade
and SAR. To this end, one addi-tion
we have made to the standard 3T
protocol is an in-house-developed ‘B1
scout,’ which uses a nonselective prepa-ration
pulse and a TurboFLASH readout
to determine what scanner transmitter
calibration voltage will produce a 90
degree flip in the center of the head [9].
The standard scanner transmitter cali-bration
routine can provide widely vary-ing
estimates of the transmitter calibra-tion
voltage, depending on head
placement relative to isocenter and
other issues. We set the transmitter cali-bration
by hand to an expected value
based on previous scans (in this case to
270 volts) and then run our B1 Scout,
which acquires a series of 6 images with
different preparation pulses (Fig. 14).
The RF voltage for the nominally 90
degree preparation pulse is varied from
80% of the value corresponding to the
current transmitter calibration value up
to 130% in 10% steps, and the entire
series is obtained in 10 seconds. When
this series is analyzed with the Mean
Curve task card we see that the center of
the head reaches a 90 degree flip angle
when the transmitter calibration voltage
is 270. Looking at the series of B1 Scout
images we can also see that more
peripheral regions of the brain do not
receive the prescribed excitation even
with 130% of the manually entered
transmitter calibration voltage. This is
the familiar B1
+ inhomogeneity problem,
and we keep this in mind as we optimize
our acquisitions during the scan session.
After acquisition of localizers and the B1
scout, the first clinical sequence we run
at 7T is a 3D MPRAGE with a sagittal
slice prescription (adjusted to match the
head orientation as seen in the initial
3-plane localizers). The sagittal orienta-tion
and 3D nature of this first scan facil-itates
slice prescriptions for subsequent
scans based on anatomical landmarks in
the brain such as the anterior commis-sure
– posterior commissure (AC-PC)
line. Given that MPRAGE is a low SAR
sequence, and that we know the trans-mitter
reference voltage needed to reach
the target flip angle in peripheral brain
regions is higher than for central
regions, we open the adjustments task
card before running the scan and set
the transmitter reference voltage to 375
for this scan. For comparison to the
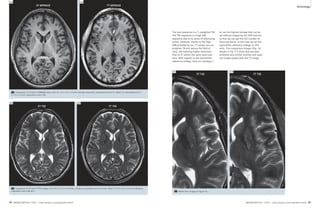
3T standard, we reformat the scan into
1 mm thick axial planes, as shown in
figure 15. Even with the higher resolu-tion
at 7T the SNR clearly exceeds that
of the 3T image, and lengthening the
inversion time (TI) to 1100 ms maintains
good grey-white contrast. The 7T image
clearly depicts thin perivascular spaces
in the white matter which are lost in
the noise in the 3T image. It should be
noted, however, that while the MPRAGE
sequence produces high quality
T1-weighted images at 7T, there are
some issues such as loss of contrast
immediately superior to the nasal and
auditory sinuses (due to B0 variation)
and in the inferior temporal lobes and
inferior cerebellum (due to weak RF
transmit field in these regions). These
artifacts may be reduced through
sequence modifications [10, 11] but we
have used the standard (“product”)
sequence here.
42 MAGNETOM Flash 1/2011 · www.siemens.com/magnetom-world MAGNETOM Flash · 1/2011 · www.siemens.com/magnetom-world 43](https://image.slidesharecdn.com/magnetomflash46-00090326-140821154645-phpapp01/85/ISMRM-Edition-Issue-46-23-320.jpg)
![Technology Technology
Standard FLAIR sequences are difficult to
utilize at 7T because their inversion
pulse and multiple refocusing pulses
result in very high SAR. We have
achieved similar image contrast to 3T
FLAIR images with 2D sequences, but
only with a limited number of slices in
the standard scan time due to SAR
restrictions. However, a Siemens works
in progress (WIP) sequence is available
based on the 3D SPACE sequence which
provides FLAIR-like contrast. We run this
at 1 mm isotropic resolution, and the
scan time is roughly equivalent to the
combined time taken for axial and sagit-tal
FLAIR scans at 3T. The isotropic 7T
data set can then be reformatted into
any plane. With this set of parameters
we are able to boost the transmitter ref-erence
voltage again without exceeding
the SAR limits, in this case to 350 volts.
We compare 3T images with correspond-ing
7T reformats in Figures 18–19. There
are some differences in the contrast and
image quality between the 3T and 7T
scans, but with this new sequence we
can add FLAIR contrast to our standard
protocol at 7T. We have not yet evaluated
whether the two approaches yield equiv-alent
diagnostic information about brain
lesions, but the 7T SPACE-FLAIR is a pow-erful
addition to the array of sequences
which can be run routinely at 7T.
HemoFLASH is a 2D FLASH sequence
with a relatively long TE to create low
signal in regions of high susceptibility,
such as where there are blood products
from hemorrhage or microbleeds. At 3T
a TE of 20 ms is used, with a slice thick-ness
of 5 mm. Given that T2 in the brain
is shorter at 7T than at 3T, we reduce TE
to 15 ms, and also reduce the slice thick-
ness to 3 mm to reduce signal dropout
over the nasal sinus due to through-plane
dephasing. Since FLASH is a low
SAR sequence, we leave the transmitter
reference voltage at 350. We achieved
similar image contrast at higher resolu-tion
in the same total scan time as com-pared
to 3T (Fig. 20), though there is
still some signal dropout over the nasal
sinus at this level of the brain. Further
sequence optimization might reduce
the sensitivity to susceptibility to a level
more similar to 3T if desired.
Diffusion-weighted sequences are espe-cially
challenging at 7T. They are particu-larly
susceptible to distortions due to B0
variations, which are larger at 7T than at
3T even with diligent shimming, and the
shorter T2 at 7T leads to loss of signal
because of the long readout time. Vari-ous
strategies can be employed to over-come
these issues, such as using higher
acceleration rates with parallel imaging,
and using thinner slices. We have
reduced the matrix size and increased
the acceleration compared to the 3T pro-tocol,
resulting in a lower in-plane reso-lution,
and have reduced the slice thick-ness
18A 18B 19B
19A
3T Axial FLAIR 3T Sagittal FLAIR
through-plane dephasing. SAR con-straints
more than 22 slices with the nominal
270 volt transmitter reference. The
7T diffusion images shown in figure 21
are not of equal quality to those that
are routinely obtained at 3T. That said,
substantial research efforts have been
devoted to diffusion imaging at 7T, and
specialized sequences may well be able
to achieve improved results [12–15].
7T SPACE-FLAIR 7T SPACE-FLAIR
18 Comparison of 3T and 7T FLAIR images. Left: 3T axial FLAIR, 0.7 x 0.7 x 5.0 mm3, 30 slices, acquisition time 3:02 min. Right: 7T SPACE-FLAIR (3D),
1.0 x 1.0 x 1.0 mm3, 160 sagittal slices, axial reformat, acquisition time 7:22 min.
to 3 mm from 5 mm to reduce
prevented us from obtaining
19 Comparison
of 3T and 7T
FLAIR images.
Left: 3T sagittal
FLAIR, 1.3 x 0.9 x
5.0 mm3, 30
slices, acquisition
time 4:03 min.
Right: 7T SPACE-FLAIR
(3D), 1.0 x
1.0 x 1.0 mm3,
160 sagittal
slices, native sag-ittal
image from
the same dataset
as for figure 18,
acquisition time
7:22 min.
20 Comparison
of 3T and 7T
HemoFLASH
images. Left: 3T,
1.1 x 0.7 x 5.0
mm3, 30 slices,
acquisition time
2:35 min. Right:
7T, 0.7 x 0.7 x
3.0 mm3, 45
slices, acquisition
time 2:38 min.
3T HemoFLASH
7T HemoFLASH
20B
20A
46 MAGNETOM Flash 1/2011 · www.siemens.com/magnetom-world MAGNETOM Flash · 1/2011 · www.siemens.com/magnetom-world 47](https://image.slidesharecdn.com/magnetomflash46-00090326-140821154645-phpapp01/85/ISMRM-Edition-Issue-46-25-320.jpg)
![2
Technology Neuro Neuro Technology
MRI-Based Pattern
Recognition Methods for
Dementia Diagnostics
Stefan Klöppel, MD1; Richard Frackowiak, MD2
1Freiburg Brain Imaging, University Hospital Freiburg, Germany
2Centre Hospitalier Universitaire Vaudois, Lausanne, Switzerland
It is estimated that the number of
people that will suffer from dementia
by 2020 will be more than 40 million,
with an increasingly higher proportion
coming from developing countries [8].
Historically, brain imaging with CT or
MRI has largely been used to rule out
alternative and especially structural
causes of the dementia syndrome. This
approach is consistent with established
diagnostic consensus criteria such as
those published by the NINCDS-ADRDA
[14]. Recently, there has been a realisa-tion
that MRI may add positive predictive
value to a diagnosis of Alzheimer’s dis-ease
(AD) [9]. Several studies demon-strate
that using MRI to evaluate atrophy
of temporal lobe structures can contrib-ute
to diagnostic accuracy [2, 22], but
these findings have yet to be applied
to routine clinical radiological practice,
let alone in the general practice or
internal medicine setting [22]. Recent
developments in machine-learning anal-ysis
methods and their application to
neuroimaging [4–7, 10, 11, 13, 15,
18–21] are very encouraging in relation
to the levels of diagnostic accuracy
achievable in individual patients. These
multivariate methods promise fully-automated,
standard PC-based clinical
decisions, unaffected by individual neu-roradiological
expertise which strongly
affects diagnostic accuracy (Fig. 1). They
are sufficiently sensitive to successfully
separate those with mild cognitive
impairment (MCI [16]) from the cogni-tively
normal [3] or identify those cogni-tively
normal subjects who will convert
to MCI [4]. So far, computational anat-omy
has been used to characterise dif-ferences
between the brains of patients
and normal age-matched volunteers at
the group level. What is needed in the
clinical setting is a diagnostic method
applicable to each and every individual.
Multivariate classification methods such
as linear support vector machines (SVM)
integrate information from the whole
brain. In the context of machine learn-ing,
individual MR images are treated as
points located in a high dimensional
space. Figure 2 illustrates this procedure
in an imaginary two-dimensional space:
In this example the two groups to be
classified are represented by circles and
triangles. It can be seen that the groups
cannot be separated on the basis of val-ues
along one dimension only and that
only a combination of the two leads to
adequate separation. The space used for
classifying image data is of much higher
dimension; the total number of dimen-sions
is determined by the numbers of
voxels in each MR image. Related meth-ods
have been introduced to aid in
breast cancer screening where they are
applied to 2D X-rays and are now part of
the diagnostic workup. With the advent
of faster computer hardware, an accu-rate
spatial transformation of the indi-vidual
scan to a standard template is
possible within minutes.
Image processing pipeline
To apply classification methods success-fully
it is critical to extract relevant
information from the MRI-scan. Figure 3
magnifies the hippocampus area in
0,00 25,00 50,00 75,00
100,00
90,00
80,00
70,00
60,00
Experience
Percentage of dementia cases
Accuracy
1 Shows an increasing accuracy of radiologists more experienced in the diagnosis of dementia [10].
1
3 The hippocampus
region is displayed in
two example cases
before (top row) and
after (bottom row)
image processing.
Volume anterior hippocampus
Volume posterior hippocampus
Alzheimer’s
disease
2 Concept of multivariate classification methods in a 2D example.
3A 3B
3C 3D
healthy
controls
50 MAGNETOM Flash 1/2011 · www.siemens.com/magnetom-world MAGNETOM Flash · 1/2011 · www.siemens.com/magnetom-world 51](https://image.slidesharecdn.com/magnetomflash46-00090326-140821154645-phpapp01/85/ISMRM-Edition-Issue-46-27-320.jpg)
![Technology Neuro Neuro Technology
two example cases. An observer with
some experience may well be able to
identify the more atrophic medial tem-poral
lobe areas in figure 3C. Looking
at the same images from the feature
extraction perspective, it becomes
obvious that there are substantial differ-ences
between both images, (e.g.
regarding brightness, anatomy of the
ventricles or differences in non-brain
structures) that are unrelated to the
diagnostic problem. Those are therefore
a source of noise.
the local GM volume and the reduced
brightness in figure 3C can easily be
identified by an automated method.
Applying the support vector machine
In practical terms, a linear kernel matrix
is created from normalised GM seg-mented
images. To this end, each MRI
scan undergoes a pair-wise multiplica-tion
with all other scans. Each element
in the kernel matrix is therefore a dot
product of two images. Intuitively, the
kernel matrix can be viewed as a similar-ity
measure among subjects belonging
to a characterised group. Each scan is
effectively treated as coordinate in a
high dimensional space and the location
is determined by the intensity value at
each voxel. The images do not span the
whole high dimensional space, but
rather cluster in subspaces containing
images that are very similar. This is one
reason why image normalization into a
standard space is an important prepro-cessing
step. Good spatial normalization
will tighten clustering and reduce
dimensionality.
The use of a support vector machine
(SVM) for image classification is an
example of a linear discrimination. In
the basic model it is a binary classifier,
which means it divides the space into
which the MR images are distributed
into two classes by identifying a separat-ing
hyper-plane. In a simple two dimen-sional
space, the boundary is repre-sented
by a line, but is called a
hyperplane in higher dimensional space.
Fisher’s linear discriminate analysis or
linear perceptrons can both identify lin-ear
discriminant hyperplanes. However,
the motivation behind using an SVM is
that it uses the principle of ‘structural
risk minimization’, which aims to find a
hyperplane that maximizes the distance
between training classes (see Figure 2).
Intuitively, it can be seen that the opti-mal
separating hyperplane (OSH) pro-duced
by an SVM is defined by those
voxels that are closest to the separating
boundary between them, i.e., the voxels
that are most ambiguous. These voxels
are called the ‘support vectors’. Voxels
Several strategies exist to reduce noise
and extract relevant information. Most
include a segmentation into grey matter
(GM), white matter (WM) and cerebro-spinal
fluid (CSF) followed by a spatial
normalisation of the GM segment to a
template. A separate ‘modulation’ step
[1] ensures that the overall amount of
each tissue class remains constant after
normalization. The bottom row in figure
3 depicts the same two cases as the top
row but after applying the preprocessing
steps. The brightness of a voxel now codes
that are further away from a separating
boundary are distinctively different,
hence are not used to calculate the OSH.
This fact suggests that adding more images
to a training set will have little effect on an
OSH if they are distant from it.
After training, an OSH contains learned
differences between classes – in our
case, AD and control images. That infor-mation
is then used to assign any new
image to its appropriate class (leave-one-
out method). This procedure itera-tively
leaves successive images out of
training for subsequent class assignation
until each had been used in this way.
This validation procedure ensures that a
trained SVM can generalize and be used
on scans that have never been presented
to the SVM algorithm previously.
Clinical applications
We have recently shown that mild to
moderately affected individuals with AD
and controls can be correctly assigned to
their respective group with an accuracy
of 95% and a sensitivity of 100%, even
when scans come from different scan-ners
to those used to generate the dis-criminant
model that differentiates the
categories [11]. A similar accuracy was
found when diagnosing two forms of
dementia, AD and fronto-temporal lobar
degeneration (FTLD), using such com-puter-
based analyses [11]. This perfor-mance
compares well to that achieved
by experienced neuroradiologists [10]
(see figure 4). Our preliminary analysis
indicates that around 20 subjects per
diagnostic group are required to achieve
reasonably good performance [12].
Roadmap for future
developments
These results have a number of implica-tions
that suggest a general adoption of
computer-assisted methods for MRI
scan-based dementia diagnosis should
be seriously considered. The most
important of these are:
a) improving diagnosis in places where
trained neuroradiologists or cognitive
neurologists are scarce;
b) increasing speed of diagnosis without
compromising accuracy by eschewing
lengthy specialist investigations; and
c) recruitment of clinically-homogeneous
patient populations for pharmacologi-cal
trials. The following steps should be
taken before wide application:
1. Establishment of precise classifica-tion
techniques with well-estab-lished
test criteria such as sensitivity
and specificity values for each dis-ease
and the question under study.
2. Creation of a large database with
cases from a high number of disor-ders
diagnosed with certainty.
3. Further optimisation of the ability to
combine data from different scan-ners.
Despite encouraging results,
scanner differences have effects on
imaging [17] and should be corrected
if possible.
4. Comparison of present gold stan-dard
methods for MRI-based classifi-cation
methods and examination of
combinations of methods.
5. Conclusion as to whether classifi-cation
methods are capable of
creating new gold standards, given
limited resources.
6. Implementation of all required
image processing steps on the MRI
console to facilitate integration into
the clinical workflow.
Accuracy [%]
Radiologist
SVM
AD vs. controls AD vs. FTLD
100,00
90,00
80,00
70,00
60,00
4 Diagnostic accuracy of radiologists compared to an SVM when separating Alzheimer’s Disease
(AD) from either healthy controls or cases with fronto-temporal lobar degeneration (FTLD).
4
References
1 Ashburner J, Friston KJ (2000) Voxel-based mor-phometry–
the methods. Neuroimage 11:805-821.
2 Barnes J et al. (2004) Differentiating AD from aging
using semiautomated measurement of hippo-campal
atrophy rates. Neuroimage 23:574-581.
3 Davatzikos C et al. (2008) Detection of prodromal
Alzheimer's disease via pattern classification of
magnetic resonance imaging. Neurobiol Aging
29:514-523.
4 Davatzikos C et al. (2009) Longitudinal progres-sion
of Alzheimer's-like patterns of atrophy in
normal older adults: the SPARE-AD index. Brain
132:2026-2035.
5 Duchesnay E et al. (2007) Classification based on
cortical folding patterns. IEEE Trans Med Imaging
26:553-565.
6 Fan Y et al. (2006) Diagnosis of Brain Abnormality
Using both Structural and Functional MR Images.
Conf Proc IEEE Eng Med Biol Soc 1:1044-1047.
7 Fan Y et al. (2007) Multivariate examination
of brain abnormality using both structural and
functional MRI. Neuroimage 36:1189-1199.
8 Ferri CP et al. (2005) Global prevalence of
dementia: a Delphi consensus study. Lancet
366:2112-2117.
9 Fox NC, Schott JM (2004) Imaging cerebral
atrophy: normal ageing to Alzheimer's disease.
Lancet 363:392-394.
10 Klöppel S et al. (2008a) Accuracy of dementia dia-gnosis:
a direct comparison between radiologists
and a computerized method. Brain 131:2969-2974.
11 Klöppel S et al. (2008b) Automatic classification
of MR scans in Alzheimer's disease. Brain
131:681-689.
12 Klöppel S et al. (2009) A plea for confidence
intervals and consideration of generalizability in
diagnostic studies. Brain 132:e102.
13 Lerch JP et al. (2008) Automated cortical thickness
measurements from MRI can accurately separate
Alzheimer's patients from normal elderly controls.
Neurobiol Aging 29:23-30.
14 McKhann G et al. (1984) Clinical diagnosis of
Alzheimer's disease: report of the NINCDS-ADRDA
Work Group under the auspices of Department of
Health and Human Services Task Force on
Alzheimer's Disease. Neurology 34:939-944.
15 Mourao-Miranda J et al. (2005) Classifying brain
states and determining the discriminating
activation patterns: Support Vector Machine on
functional MRI data. Neuroimage 28:980-995.
16 Petersen RC et al. (2001) Current concepts in mild
cognitive impairment. Arch Neurol 58:1985-1992.
17 Stonnington CM et al. (2008) Interpreting scan
data acquired from multiple scanners: a study with
Alzheimer's disease. Neuroimage 39:1180-1185.
18 Teipel SJ et al. (2007a) Multivariate deformation-based
analysis of brain atrophy to predict Alz-heimer's
disease in mild cognitive impairment.
Neuroimage 38:13-24.
19 Teipel SJ et al. (2007b) Multivariate network
analysis of fiber tract integrity in Alzheimer's
disease. Neuroimage 34:985-995.
20 Vemuri P et al. (2008a) Alzheimer's disease
diagnosis in individual subjects using structural
MR images: Validation studies. Neuroimage
39:1186-1197.
21 Vemuri P et al. (2008b) Antemortem MRI based
Structural Abnormality iNDex (STAND)-scores
correlate with postmortem Braak neurofibrillary
tangle stage. Neuroimage 42:559-567.
22 Wahlund LO et al. (2005) Evidence-based
evaluation of magnetic resonance imaging as a
diagnostic tool in dementia workup. Top Magn
Reson Imaging 16:427-437.
Contact
Stefan Klöppel, MD
Brain Imaging
Freiburg University
Breisacher Str. 64
79106 Freiburg
Germany
Email:
stefan.kloeppel@uniklinik-freiburg.de
52 MAGNETOM Flash 1/2011 · www.siemens.com/magnetom-world MAGNETOM Flash · 1/2011 · www.siemens.com/magnetom-world 53](https://image.slidesharecdn.com/magnetomflash46-00090326-140821154645-phpapp01/85/ISMRM-Edition-Issue-46-28-320.jpg)
![Clinical Woman’s Health
2B 2C
2 Breast MR images of a 49-year-old woman with cysts containing proteinaceous fluid. 2A: STIR with TR/TE/TI 4200/93/230, 2B: SPAIR with TR/TE
4000/86, 2C: T1-weighted gradient echo image TR/TE 4.9/1.9.
same scheme of inversion recovery
although it has a different T1 value. This
leads to an intrinsically low signal-to-noise
ratio as opposed to SPAIR which
leaves the water signal undisturbed. We
illustrate this with the following case of
breast cysts with short T1.
Pictorial illustration
A 49-year-old patient was selected for
high-risk screening in MRI. No prior
mammogram or ultrasound of the
breasts was performed for the patient.
Physical examination found no palpable
mass in either breast.
MRI was performed on a 3T scanner
(MAGNETOM Verio, Siemens Erlangen,
Germany). The system was equipped
with an open 8-channel breast array coil.
The examination protocol consisted of
three steps. The first involved STIR /
SPAIR. In the second step, dynamic con-trast-
media enhanced 3D T1-weighted
gradient echo images were collected.
MRI of the breasts demonstrated two cir-cumscribed
oval masses at the 12
o’clock position in the left breast. These
two oval masses were isointense to
hypointense on the STIR images (Fig. 2A),
but hyperintense on SPAIR images
(Fig. 2B). Figure 2C shows a pre-contrast
T1-weighted image for reference.
In the axial subtracted images, these
oval masses demonstrated rim enhance-ment.
They probably represent inflamed
cysts containing proteinaceous fluid or
cysts complicated by hemorrhage.
Discussion
Simple breast cysts are round or oval
with sharp margins. Simple cysts have
very high T2 signal and display no inter-nal
enhancement with contrast. Breast
cysts with proteinaceous content may
demonstrate high signal on T1-weighted
images with corresponding lower signal
on T2-weighted images. In inflamed
cysts, enhancement may occur in the tis-sue
around the cyst. This may appear as
a mass with rim enhancement on sub-tracted
images.
When water is bound to a hydrophilic
macromolecule such as a protein, it
forms a hydration layer. This lowers the
motional frequencies of water which
results in shortening of T1. As a point of
reference, proteinaceous fluid has a T1
that is between that of fat (with shortest
T1) and bulk water (with longest T1) [2].
The MR signal characteristics are
thought to correlate with protein con-tent
or hemorrhage within the cysts.
There are several reports concerning the
relationship between cyst protein con-centration
and signal intensity on
T1-weighted MR images [3]. This is sup-ported
by the similarity to CT [4]. An
almost linear relationship is reported
between protein content and the attenu-ation
value of cyst fluid. The attenuation
can be in the range of that of soft tissue
and thus mimic a tissue mass.
How do T1 changes affect the STIR
image contrast?
Any other tissue with a T1 similar to that
of lipids then also appears strongly
attenuated (Fig 1A). This inconsistency
may confuse the unwary when looking
at the same tissue in a different way,
e.g. on T1-weighted MRI.
On the other hand, STIR is insensitive to
B0 inhomogeneity, and thus potentially
permits larger fields-of-view when com-pared
to conventional fat suppressed
images and also has the ability to scan
off-center; SPAIR may not work well in
regions with reduced homogeneity, e.g.
due to proximity to clips or generally
susceptibility changes [5]. But as shown
in this exemplary case, SPAIR should be
used in cases where water-based tissue
lesions may have a T1 similar to that of
lipids, because the non-selective scheme
of STIR can provide misleading results.
STIR versus SPAIR in Breast Imaging:
a Case-Based Discussion
Yien Sien Lee, MD; Choon Kuang Low, BSc; Helmut Rumpel, PhD
Department of Diagnostic Radiology, Singapore General Hospital, Singapore
Purpose
The purpose of this article is to illustrate
the varying appearances of breast cysts
for different inversion recovery imaging
sequences such as STIR and SPAIR.
It illustrates a specific pitfall in interpre-tation
of inversion recovery techniques
(for lipid void) in breast MR imaging. It
includes schematic and pictorial illustra-tions
to describe this pitfall, with imag-ing
from a clinical case.
Introduction
Standard breast MR protocols, e.g. for
screening of high-risk patients, encompass
methods for water-lipid separation [1].
To optimally assess the water compo-nent
in fibroglandular tissue, fat sup-pression
scans based on T1 relaxation
values are commonly used, namely STIR
(short TI inversion recovery) (Fig. 1A) or
SPAIR (spectral selection attenuated
inversion recovery) (Fig. 1B). Both
sequences embody an inversion recov-ery
scheme and acquire the image data
after a time delay (called inversion time
TI), when the longitudinal magnetiza-tion
of the signal from lipids is zero.
What is the difference between STIR
and SPAIR?
The inversion-recovery (IR) technique
STIR is chemically non-selective, but spa-tially
selective, i.e. the inversion pulse
affects all tissues, but only for the
respective slice. SPAIR in contrast is
chemically selective, but spatially non-selective,
i.e. only the fatty tissue is
inverted, but this applies to the whole
volume of all slices. Consequently, the
frequency of inversion pulses for each
slice is much higher for SPAIR (TR / num-ber
of slices). The steady-state magneti-zation
of fatty tissue is consequently
lower, resulting in a shorter TI for zero
crossing of the fat magnetization.
What are the strengths and weak-nesses
of STIR and SPAIR?
A significant but detrimental feature of
STIR is that the water signal follows the
Preparation Evolution Detection
water
Any fast-imaging sequence,
TI e.g. fast-spin-echo
lipid
Diagram of STIR consisting of three time periods, namely the preparation period (non-selective
inversion), the evolution period (T1 recovery), and the detection period. Note that any
1A
1A
other tissue (dashed line) with a T1 similar to that of lipids (solid line) is nulling likewise.
Preparation Evolution Detection
Any fast-imaging sequence,
TI e.g. fast-spin-echo
water lipid
Diagram of SPAIR. The spectral selective inversion pre-pulse is set on the lipid frequency, leav-ing
any other tissue unaffected (dashed line) during both the preparation and the evolution period.
References
1 Kuhl CK. Concepts for Differential Diagnosis in
Breast MR Imaging, MRI Clinics 2006; 305-328.
2 Rakow-Penner R, Daniel B, Yu H, Sawyer-Glover
A, Glover GH. Relaxation times of breast tissue
at 1.5T and 3T measured using IDEAL. JMRI
2005; 23: 87-91.
3 Hayashi Y, Tachibana O, Muramatsu N, et al.
Rathke. Cleft cyst: MR and biomedical analysis of
cyst content. J Comput Assist Tomogr 1999; 23:
34–38.
4 Stafford-Johnson DB, Helvie MA, Hilborn MD,
Wilson TE, Goodsitt MM, Bude RO. CT attenua-tion
of fluid in breast cysts. Acad Radiol. 1998;
5: 423-6.
5 Bley TA, Wieben O, François CJ, Brittain JH,
Reeder SB. Fat and Water Magnetic Resonance
Imaging. JMRI 2010; 31: 4-18.
Contact
Helmut Rumpel, PhD
Department of Diagnostic Radiology
Singapore General Hospital
Outram Rd
Singapore 169608
Phone (65)63266774
helmut.rumpel@sgh.com.sg
2A
1B
1B
54 MAGNETOM Flash 1/2011 · www.siemens.com/magnetom-world MAGNETOM Flash · 1/2011 · www.siemens.com/magnetom-world 55](https://image.slidesharecdn.com/magnetomflash46-00090326-140821154645-phpapp01/85/ISMRM-Edition-Issue-46-29-320.jpg)
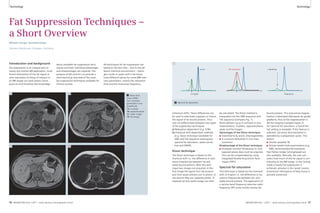
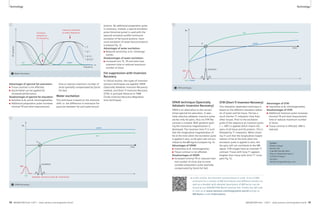
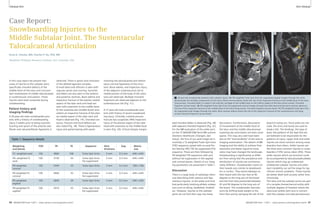
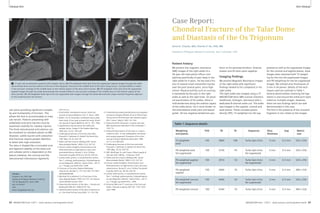
![Clinical MSK MSK Clinical
2A 2B
2 Coronal images of the ankle. 2A: PD-weighted image which shows the chondral fragment on the talar dome (long arrow). 2B: Fat suppressed
PD-weighted TSE image which again demonstrates the chondral fragment (long arrow). The increased signal in the body of the talus (arrowhead)
is consistent with edema in the bone marrow as a result of the repetitive irritation caused by the chondral fragment.
References
1 Sijbrandij ES, van Gils APG et al Posttraumatic
Subchondral Bone Contusions and Fractures
of the Talotibial Joint: Occurrence of “Kissing”
Lesions. AJR 2000; 175: 1707-1710.
2 Magee TH, Ginson GW Usefulness of MR Imaging
in the detection of talar dome injuries. AJR
1998; 170: 1227-1230.
3 Karasick D, Schweitzer ME Pictorial Essay The Os
trigonum Syndrome: Imaging Features AJR
1996: 166: 125-129.
4 Grogan DP, Walling AK et al Anatomy of the os
trigonum J Pediatr Orthop 1990: 10:618-622
5 Hedrick MR, McBryde AM Posterior ankle
impingement Foot Ankle 1994; 15: 2-8.
Contact
Charles P. Ho, PhD, MD
Steadman Philippon Research Institute
181 W. Meadow Dr. Suite 1000
Vail, CO 81657
USA
Karen.briggs@sprivail.org
1A 1B
1 Sagittal images of the ankle. 1A: PD-weighted sagittal image which shows the chondral fragment on the talar dome (long arrow) and the
diastased os trigonum (short arrow). 1B: Fat suppressed PD-weighted TSE image which again demonstrates the chondral fragment (long arrow)
and the diastased os trigonum (short arrow). The increased signal in the body of the talus (arrowhead) is consistent with edema in the bone
marrow as a result of the repetitive irritation caused by instability and ongoing motion of the chondral fragment.
displayed in Figures 1 and 2. The chon-dral
fragment is particularly well delin-eated
by the contrast provided by the
effusion surrounding the fragment and
the extensive prominent underlying
bone edema in the ankle joint and talar
dome areas. The chondral fragment
measures approximately 3–4 mm and is
seen along the mid talar dome. There is
underlying osseous irregularity, surround-ing
chondral focal fissuring. Extensive
prominent increased signal is noted in
the talar dome and the body which may
be reactive stress-related edema and/or
contusion and possible ongoing motion/
instability of the fragment. The adjacent
tibial plafond demonstrates chondral
thinning and fissuring to bone (Grade IV
– Outerbridge). Cortical irregularity, scle-rosis
and remodeling are also noted. The
presence of increased signal in the body
of the talus on the fat suppressed Turbo
Spin Echo images (Figs. 1B and 2B) sig-nifies
the presence of bone edema which
is most likely due to the irritation of the
chondral fragment which is located at a
has not been established [1] osteochon-dral
fractures do need to be treated.
Of the 146 ankles imaged in the series
analyzed by Sijbrandij et al., it was found
that bone contusion occurred in the tib-ial
plafond while osteochondral fractures
occurred more commonly in the talar
dome. They conclude that the opposing
lesions occur due to impaction of the
talus on the tibia. In this case, however
the lack of bone contusion in the plafond
suggests that the plafond injury is chronic
with resolution of the edema. The
presence of the talar edema with the
osteochondral fracture of the talar
dome suggests that ongoing local
movement and instability of the osteo-chondral
fragment could be producing
a localized bone injury and consequent
stress related edema.
Sijbrandij also opined that the explana-tions
for the higher occurrence of the
subchondral fractures in the talus rather
in the plafond is most likely due to the
fact that the osteochondral lesions are
more commonly observed on convex
strategic point trapped at the mid weight
bearing portion of the talar dome.
The second is the separation and poste-rior
tilting of the os trigonum. The os
trigonum appears diastased by approxi-mately
3 mm from the lateral tubercle of
the posterior process with high signal
widening of the synchondrosis. This is
most likely related to injury and chronic
separation at the synchondrosis. The
findings of the diastased os trigonum
are visualized on the sagittal images
seen in Figures 1A and B.
Discussion
1. Chondral or osteochondral fracture of
the talar dome: Ligamentous injuries of
the ankle are among some of the most
common sports related injuries involving
the ankle. When the pain becomes chronic
or persistent, associated osteochondral
contusion or fracture should be consid-ered.
Opposing lesions which involve
the plafond and the adjacent talar dome
as in this patient should be sought. While
the clinical significance of bone contusion
surfaces with preferentially sparing of
the concave surfaces.
2. Os trigonum injury: The os trigonum
is believed to be analogous to a second-ary
ossification center being formed from
a cartilaginous extension of the poste-rior
portion of the talus [2, 3]. It appears
between 7–13 years of age, fusing with
the posterior process of the talus within
1 year of appearance. In 7–14% patients
it remains as a separate ossicle – often
present bilaterally. A cartilaginous
synchondrosis develops in this region in
those adults where it remains separate.
A painful os trigonum may be due either
from an acute injury or, as likely in this
case from a chronic repetitive micro-trauma
and resulting chronic diastasis
of the synchondrosis [4]. The proximity
of the flexor hallucis long tendon is a
feature of which one has to be mindful
since pressure from the diastased os
trigonum can lead to tenosynovitis.
When the involvement of the flexor
hallucis tendon becomes chronic and
there is degeneration/tendinosis and
fibrosis of the tendon between the
medial and lateral tubercles of the talus,
there can be reduced flexion of the
great toe.
64 MAGNETOM Flash 1/2011 · www.siemens.com/magnetom-world MAGNETOM Flash · 1/2011 · www.siemens.com/magnetom-world 65](https://image.slidesharecdn.com/magnetomflash46-00090326-140821154645-phpapp01/85/ISMRM-Edition-Issue-46-34-320.jpg)
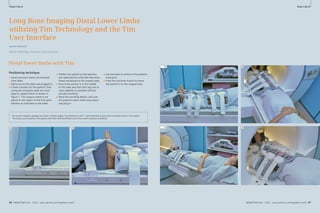
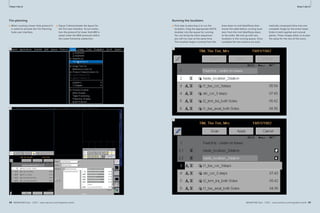
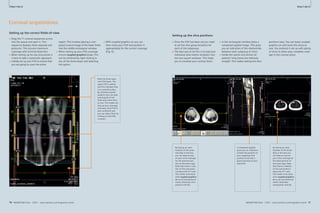
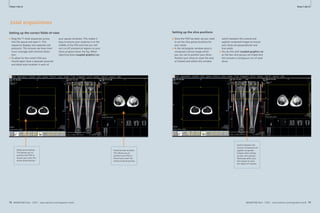
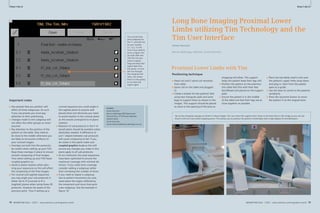
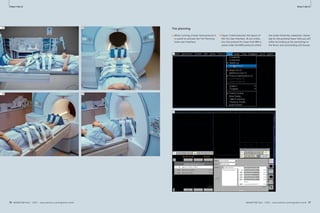
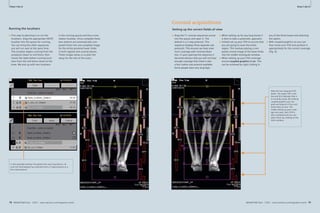
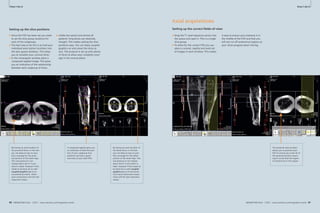
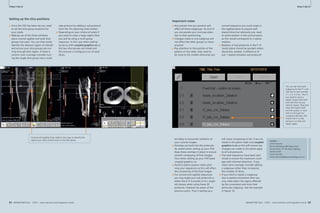
![Clinical Cardiovascular
Frequently Asked Questions:
Diffusion-Weighted Imaging (DWI)
Joachim Graessner, Dipl. Ing.
Siemens Healthcare, Hamburg, Germany
RF
ADC
Gdiff
Gr
Gp
84 MAGNETOM Flash 1/2011 · www.siemens.com/magnetom-world
Cardiovascular Clinical
b0, b500, b1000 b0, b1000
MAGNETOM Flash · 1/2011 · www.siemens.com/magnetom-world 85
the contrast in pathogenic regions.
Shown below are examples of three
b-values: b 0, b 500, and b 1000 s/mm2.
The proper b-value has approximately
80% of the reciprocal ADC value of nor-mal
background tissue. Keep in mind
that higher b-values may pronounce
lesions even more at the price of poor
SNR due to longer TEs and increased
susceptibility. This can be compensated
by increasing averages, which result in
longer scan times. Changing the b-value
immediately influences other parame-ters
like minimal TE, slice thickness and
FOV as well as maximum matrix at a
given optimal bandwidth. Furthermore
anisotropy of tissues, like white matter,
also influences the choice [2].
Why are a minimum of three direc-tions
measured for each high b-value?
Diffusion may be different in all three
dimensions, like in white matter. Fibers
exhibit longer free path in the longitudi-nal
direction than perpendicular to it.
The ADC images are therefore different
depending on the sensitizing direction.
This information is collected by applying
diffusion gradients in all three dimensions.
For example, in the case of commissures,
diffusion is severely limited perpendicu-lar
to the fibers due to the surrounding
myelin layer. In contrast, there are few or
no limitations along the fibers.
Anisotropy may have a strong effect
on measurement results. To measure
the diffusion strength independent of
anisotropy, diffusion images of different
orientation are measured and averaged.
Why should I measure three b-values
for a DWI protocol when two would be
enough for calculating ADC?
While two b-values are sufficient for cre-ating
an ADC image, the selection of three
b-values (b 0, b 500, b 1000) delivers a
more accurate calculation of the ADC val-ues.
The lower SNR of the b 1000 images
introduces a higher standard deviation of
the ADC which is partially compensated
by the median value of b500.
Here is an example of two ADC images,
the first acquired with three b-values
and the second with two b-values.
What is a trace image?
The ‘trace image’ displays the geometric
averaging of all three directional mea-surements,
resulting in trace-weighted
images. It suppresses to some extent
anisotropy information and focuses on
differences in signal attenuation. Like
the ADC map, the trace-weighted map
shows the strength of the diffusion and
not its orientation.
Why do we need ADC images, and
what does the ‘A’ in ADC stand for?
In addition to diffusion contrast, diffu-
Background
MR diffusion-weighted imaging (DWI)
has ceased to be used only in brain appli-cations
for several years. The utilization
of whole body DWI is becoming a stan-dard
application in routine imaging.
Whole body DWI has become as valuable
as T2 contrast in tumor imaging and it
allows to characterize tissue properties.
Due to the more frequent use of DWI,
questions are often asked with regard to
the background, application, and inter-pretation
of whole body DWI and its cal-culated
Apparent Diffusion Coefficient
(ADC) images.
The following will answer some of these
questions.
What is diffusion?
Molecular diffusion is the random move-ment
of molecules – in our case water
(H2O) – within tissues propelled by ther-mal
energy. The contribution of intra- and
extra-cellular (interstitial) movement to the
total diffusion is still under investigation.
How is MR sensitizing the tissue for
diffusion effects?
Within the spin echo preparation period
of an EPI sequence, two strong gradient
pulses are played out around the 180°
pulse. The first pulse dephases the mag-netization
of moving and static spins
and the second pulse rephases only static
spins 100% while moving i.e. diffusing
spins acquire non-zero phase dispersion,
resulting in a stronger signal dampening
of tissues with fast diffusion compared
to tissues with slow diffusion. Free water
experiences the strongest signal attenu-ation
at higher b-values.
What does the b-value mean?
The b-value identifies the measure-
· 1/2011 · www.siemens.com/magnetom-world How-I-do-it
2A 2B 2C
2A b = 0. No diffusion weighting, low-reso-lution
T2 image.
2B b = 500. Intermediately diffusion-weighted
image.
2C b = 1000. Strongly diffusion-weighted
image.
ment's sensitivity to diffusion and
determines the strength and duration of
the diffusion gradients. It combines the
following physical factors into one
b-value and is measured in s/mm² [1].
b = 2G2 2(Δ– /3)
The signal ratio diffusion-weighted to
non diffusion-weighted signal is:
■ S0 – signal intensity without the
diffusion weighting
■ S – diffusion-weighted signal
■ – gyromagnetic ratio
■ G – amplitude of the two diffusion
gradient pulses
■ – duration of the pulses
■ Δ – time between the two pulses
■ D – diffusion coefficient is a measure
of the strength (velocity) of diffusion
in tissue. The stronger the diffusion,
the greater the diffusion coefficient,
i.e. the ADC in our in vivo case.
If you choose the b-value the reciprocal
magnitude of the expected ADC (D) in
the focus tissue you make the exponent
of the exponential function being ‘-1’.
This means your signal S is reduced to
about 37% of its initial value S0.
What is the optimum b-value?
A b-value of zero delivers a T2-weighted
EPI image for anatomical reference. The
b-values should attenuate the healthy
background tissue more than the lesion
at a level so that the intensity differences
are about a factor of two at a comfort-able
signal-to-noise ratio (SNR) level i.e.
there is signal left in the highest b-value
image.
In the range of clinically-relevant b-val-ues
(up to approximately 1,000), then
the greater the b-value, the stronger
the diffusion weighting and the higher
S
S0
= e- 2G2 2(Δ- /3)D = e-bD
3A 3B
3A ADC calculated from 3 b-values ( 0, 500,
1000).
3B ADC calculated from 2 b-values (0, 1000).
G
Δ
1 Sequence diagram of an EPI diffusion-weighted sequence illustrating the physical quantities
of the b-value.
1
How-I-do-it](https://image.slidesharecdn.com/magnetomflash46-00090326-140821154645-phpapp01/85/ISMRM-Edition-Issue-46-44-320.jpg)
![Clinical Cardiovascular
4A 4B
4A b1000 image; infarct is brighter than nor-mal
tissue.
86 MAGNETOM Flash 1/2011 · www.siemens.com/magnetom-world
Cardiovascular Clinical
References
1 Le Bihan D, Breton E, Lallemand D, Grenier P,
Cabanis E, Laval-Jeantet M (1986). MR imaging
of intravoxel incoherent motions; application to
diffusion and Perfusion in neurologic disorders.
Radiology. 161: 401-407.
2 Kingsley PB, Monahan WG (2004) Selection
of the Optimum b Factor for Diffusion-Weighted
Magnetic Resonance Imaging Assessment of
Ischemic Stroke. MRM 51: 996-1001.
3 Provenzale JM, Engelter ST, Petrella JR, Smith JS,
MacFall JA (1998). Use of MR Exponential
Diffusion-Weighted Images to eradicate T2
“Shine-Through” Effect. AJR. 172:537-539.
4 Padhani AR, Liu G, Mu-Koh D, Chenevert TL,
Thoeny HC, Takahara T, Dzik-Jurasz A, Ross BD,
Van Cauteren M, Collins D, Hammoud DA,
Rustin GJS, Taouli B, Choyke PL (2009). Diffu-sion-
Weighted Magnetic Resonance Imaging
as a Cancer Biomarker: Consensus and
Recommendations. NEOPLASIA.11 (2): 102-125.
5 de Bazelaire CMJ, Duhamel GD, Rofsky NM,
Alsop DC (2004).MR Imaging Relaxation Times
of Abdominal and Pelvic Tissues in Vivo at 3.0 T.
Radiology 230: 652-659.
6 Hagmann P, Jonasson L, Maeder P, Thiran JP,
Van Wedeen J, Meuli R (2006). Understanding
Diffusion MR Imaging Techniques: From Scalar
Diffusion-weighted Imaging to Diffusion Tensor
Imaging and Beyond. Radiographics 26: 205-223.
MAGNETOM Flash · 1/2011 · www.siemens.com/magnetom-world 87
· 1/2011 · www.siemens.com/magnetom-world How-I-do-it
sion images also have an overlaying T2
contrast. In regions with long T2, this
can simulate reduced diffusion (‘T2
Shine-Through’). These portions of the
signal can be eliminated by calculating
a pure diffusion coefficient.
The ‘A’ stands for apparent because we do
not measure the pure diffusion coefficient
(D or DC). In living tissue the diffusion
process is superimposed by capillary
pseudo diffusion and gross motion to
which the MR measurement is also
very sensitive.
How is the ADC calculated?
Having measured a set of at least 2 dif-ferent
b-value images (e.g., b 0 and b
1000 s/mm²) the system calculates pixel
by pixel the ADC by linear regression.
The ADC pixel values together form the
ADC map. On a half logarithmic scale, the
signal decay delivers a straight tilted line
whose slope provides the ADC. The
faster the signal decay the steeper the
slope and the higher the ADC.
The Diffusion image (b 1000) below dis-plays
reduced diffusion as hyperintense
(brighter pixels); in contrast the ADC map
displays it as hypointense (darker pixels).
Why are some lesions typically
brighter than the background brain
tissue on the higher b-value image
and darker on the ADC map?
Due to the nature of certain lesions
and their missing perfusion, the cells
swell and hinder a normal diffusion; i.e.,
4B ADC Image; infarct appears darker than
normal tissue.
spicuous. The calculation of the tissue
ADC can be more accurate when start-ing
with even higher b-values like 100 or
200 to omit the contribution of flow and
micro vascular effects. Low b-values
more often serve as anatomical reference.
In software level syngo MR D11A and
above you can delimit the b-values for
ADC calculation on the body diffusion
application card of the protocol.
Why do liver diffusion-weighted
images look darker on 3T than 1.5T?
The T2 and T2* relaxations times for
liver tissue, and other tissues as well, are
considerably shorter as the field strength
increases The overall signal is therefore
diminished at 3T, even at lower b-values,
due to the relatively long echo times (TE)
used in DWI [5].
Which new DWI features are intro-duced
with software version syngo
MR D11A for MAGNETOM Aera and
Skyra?
There is a new ‘body diffusion’ applica-tion
card with many new applications:
■ diffusion scheme monopolar/bipolar
■ start ADC calculation for b > = …
■ exponential ADC; no T2 shine-through
■ invert gray scale (“PET-like” image)
■ calculated image of artificial b-values
plus
■ choice of dynamic field correction
■ improved fat saturation schemes
What should I know when scanning
liquids in phantoms with DWI
sequences?
Firstly, the liquids should not move in
the phantom bottle. Flowing liquid in
the phantom would cause artificially
strong diffusion and results in low inten-sity
DWI images with inaccurately long
ADC values.
Secondly, the diffusion coefficient is also
strongly temperature dependent. Pure
water has a diffusion coefficient of about
3 *10-3 mm²/s (exactly: 2.96) at body
temperature of 37 °C (98.6 °F). Water of
0 °C (32 °F) has a diffusion coefficient
of 1.12 * 10-3 mm²/s. This could serve as
a standard for different machines.
Additional reading
In addition to the comprehensive Siemens
applications guide, “Diffusion/Perfusion
Imaging”, there is literature [6] available
which covers neuro and body diffusion.
(Listed according to year of publication):
Derek K. Jones: Diffusion MRI: Theory,
Methods, and Applications; Oxford Uni-versity
Press
Bachir Taouli: Extra-Cranial Applications
of Diffusion-Weighted MRI; Cambridge
University Press
Dow-Mu Koh: Diffusion-Weighted MR
Imaging: Applications in the Body; Springer
Heidi Johansen-Berg: Diffusion MRI:
From Quantitative Measurement to
In-Vivo Neuroanatomy; Academic Press
Contact
Joachim Graessner, Dipl. Ing.
Siemens Healthcare
GER H IM BM MR
Lindenplatz 2
20099 Hamburg
Germany
joachim.graessner@siemens.com
5
5 b50 image of normal liver at 3T.
6
6 syngo body-diffusion card in software version syngo MR D11A.
the mean free path is shorter. Water
molecules cannot move as far in the dam-aged
tissue as in normal tissue. As a
result, the ADC is lower and appears darker
than the surrounding normal tissue.
Which benefit does the calculation
of an exponential map deliver?
The exponential map or image is calcu-lated
by dividing the maximal b-value
diffusion-weighted image by the b0
image. Mathematically the exponential
map displays the negative exponential
of the ADC; it is a synthetic diffusion-weighted
image without T2 ‘shine-through’
effect.
The contrast behaviour is similar to
the high b-value image [3].
How do I get the ADC value out of my
ADC image and what is the right unit?
Place a region of interest (ROI) on the
ADC map and record the mean value in
that ROI. A value of 850 intensity points
is to be interpreted as 0.85 10-3 mm²/s.
This is valid for software versions since
syngo MR B13. Systems with A-level
software (e.g., syngo MR A30) and syngo
MR B11, a mean value of 85 delivers the
result above.
There are many publications on DWI
and ADC. But why are there so many
different unit and digits used for
ADCs?
Currently, there is no consensus about
applied units in DWI. You will find all
4C
4C Exponential-Map
of the following units which are equal
(syngo MR B13).
A mean intensity of 1000 is equal to:
1.0*μm²/ms or intensity times 10-3
1.0*10-3 mm²/s or intensity times 10-6
1.0*10-5 cm²/s or intensity times 10-8
1.0*10-9 m²/s or intensity times 10-12
Also found:
1000*10-6 mm²/s
1000*μm²/s
Why does the ADC have a unit of an
area/time although diffusion occurs
in all three dimensions?
By definition, the diffusion coefficient
is defined as the product of 1/3 times
medial velocity times mean free path:
D = 1/3*v’* l
The unit is an area per time.
Why is there a lack of standardization
for the choice of b-values in whole
body DWI?
As a relatively new application body DWI
is on its way to become a technique with
recommended b-values and measurement
conditions. See cited reference [4] for
further information.
Why do most body and liver DWI
protocols start with b-value 50 s/mm²?
The selection of a low b-value larger
than zero provides suppression of large
vessels which makes lesions more con-
How-I-do-it](https://image.slidesharecdn.com/magnetomflash46-00090326-140821154645-phpapp01/85/ISMRM-Edition-Issue-46-45-320.jpg)
![Product News Product News
Whole-Body MR/PET Hybrid Imaging:
Technical Considerations,
Clinical Workfl ow, and Initial Results
Harald H. Quick, PhD1; Ralf Ladebeck, PhD2; Jens-Christoph Georgi, PhD2
1Institute of Medical Physics (IMP), Friedrich-Alexander University Erlangen-Nürnberg, Erlangen, Germany
2Siemens AG Healthcare Sector, Erlangen, Germany
MR/PET – Advent of a new
hybrid imaging modality
These days we are eyewitnesses to an
exciting new hybrid imaging modality to
enter the clinical arena, namely simulta-neous
whole-body MR/PET imaging.
Envisioning the combination of the
excellent soft tissue contrast, high spa-tial
and temporal resolution, and func-tional
tissue parameters that MR pro-vides
with the high sensitivity of PET,
different technical approaches have
been pursued by researchers and by the
industry to work on the integration of
two formerly ‘non-integrable’ imaging
modalities. With the recent introduction
of the Biograph mMR, Siemens has
launched a 3.0 Tesla whole-body MR
hybrid system that hosts in its isocenter
a fully integrated PET detector and that
with its 60 cm patient bore enables
whole-body simultaneous MR/PET
imaging.
Researchers, radiologists, and nuclear
medicine physicians have been waiting
and actively been working on the advent
of this hybrid imaging modality for a
long time [1–3]. A detailed overview
about the pre-clinical developments, the
rationale to combine MR and PET as
well as the steps which were necessary
for integrating these imaging modalities
to allow simultaneous scanning can
be found in the article by Beyer et al.
‘MR/PET – Hybrid Imaging for the Next
Decade’, published in the supplement
of issue 3/2010, RSNA edition of
MAGNETOM Flash. Now that whole-body
MR/PET has entered clinical practice,
we have a starting point to evaluate the
full clinical potential of the modality, to
research for and to validate new imaging
applications, and to ultimately establish
this imaging modality in early diagnosis
of oncologic, neurologic, cardiologic,
and many more diseases.
As more and more research and clinical
sites come on board during the months
and years ahead, let’s take a first look
into the technology and explore what
specifics such an integrated MR/PET
hybrid system brings with it. We will
then also explore the workflow of a
MR/PET whole-body hybrid exam and
present first image examples from
clinical findings.
Technical integration of MR
and PET
The Biograph mMR hybrid imaging
system fully integrates the MR and the
PET imaging modality into one imaging
system. In order to ensure such a high
level of integration, we have to over-come
numerous physical and technical
preconditions and challenges. The
potential physical interactions of both
modalities in both directions – PET on
MRI and MRI on PET – are manifold. Full
integration of a PET system into an MRI
environment requires technical solutions
for three groups of potential electro-magnetic
interaction:
1) the strong static magnetic B0-field for
spin alignment,
2) the electromagnetic changing fields
of the gradient system (Gxyz) for spa-tial
signal encoding, and
3) the radiofrequency (RF) B1-field for
MR signal excitation and MR signal
readout.
LSO array
Avalanche Photo
Diodes (APD)
Integrated
Cooling Channels
Crystals
3x3 APD array
9-Channel preamplifier
ASIC board
9-Channel driver board
1 Pet detector assembly for mMR. 64 Lutetium Oxyorthosilicate (LSO) crystals form one block that transforms 511 keV gamma quanta into
light flashes. Light events in the LSO crystals are detected by a 3x3 array of avalanche photo diodes (ADP). 9-channel preamplifiers and driver
boards as well as integrated water cooling completes each detector block. This detector assembly is characterized by its small size, can be
designed free of magnetic components, and performs in strong magnetic fields. 56 such blocks form one detector ring, 8 rings form the PET
detector assembly in the Biograph mMR that spans a longitudinal field-of-view (FOV) of 25.8 cm.
1
PET hardware and PET signals must not
be disturbed by any of these fields.
Equally, for full and unlimited MRI sys-tem
performance, PET must not disturb
any of these electromagnetic MR fields
and signals.
Numerous technical solutions were thus
required for PET integration into an MRI
system. The most important key technol-ogy
enabler was the development of
detectors and photo diodes that are able
to detect the 511 keV PET gamma
quanta following an annihilation event
inside of a strong magnetic field. What
worked well in established PET and in
hybrid PET/CT systems in the form of
scintillation crystal blocks read out by
photomultiplier tubes (PMT), had to be
replaced for the MR/PET integration
since the PMTs are very susceptible to
magnetic fields. The current detector
solution for simultaneous MR/PET is a
combination of Lutetium Oxyorthosili-cate
(LSO) crystals and Avalanche Photo
Diodes (APD) able to detect gamma
quanta even inside strong magnetic
fields and convert the detected events
from scintillation light to electrical sig-nals
(Fig. 1A) [4]. Another advantage of
the combination LSO crystal and APD
diodes compared to PMT is that they do
not require as much space and thus can
be integrated inside of an MRI bore. Sie-mens’
70 cm magnet bore technology is
clearly another precondition to integrate
the PET detectors inside the limited
space of an MRI system and at the same
time to leave enough space to eventu-ally
k The QR code is your direct link to Thomas Beyer's article on resolution.
the history of combining PET with MRI, the rationale to do so
and challenges which had to be overcome. You will also find
end up with an inner whole-body
the article at www.siemens.com/magnetom-world
bore diameter of 60 cm – as has been
clinical standard for MRI magnet bore
diameter in the past. In the Biograph
mMR hybrid system, 56 LSO-APD detec-tor
blocks, each with a block area of
32 x 32 mm2, are aligned circumferen-tially
to form one PET detector ring.
8 rings form the full PET detector unit,
spanning a length of 25.8 cm in z-direc-tion
(for comparison: conventional/
standard PET-CT systems have an axial
field-of-view (FOV) of less than 20 cm
and high-end PET-CT systems nowadays
have a FOV of approximately 22 cm).
Each LSO crystal, which are put together
to form than the LSO-APD block, has a
size of 4 x 4 x 20 mm3 which is the finest
crystal dimension in the market for
clinical PET systems; the crystal size has
a direct impact on the achievable PET
88 MAGNETOM Flash 1/2011 · www.siemens.com/magnetom-world MAGNETOM Flash · 1/2011 · www.siemens.com/magnetom-world 89](https://image.slidesharecdn.com/magnetomflash46-00090326-140821154645-phpapp01/85/ISMRM-Edition-Issue-46-46-320.jpg)
![Product News Product News
Magnet cryostat
MR
PET
Air/Vacuum
Magnet shielding coil
Primary magnet coil
Gradient coil
PET detector
RF body coil
2 Schematic drawing and photograph showing the integration of the PET detectors in the MR hardware structure of the Biograph mMR. From the
inside to the outside: RF body coil, PET detector, gradient coil assembly, primary magnet coil, and magnet shielding coil. The latter two magnet coil
assemblies are contained in the helium filled magnet cryostat. The MR/PET integration as shown requires that the PET detector works within strong
static and dynamic magnetic fields, and does not disturb any of the associated electromagnetic MR fields. The PET detector must not disturb the static
B0-field, the gradient fields nor the RF transmission and reception. Additionally, in this configuration the RF body coil needs to be designed ‘PET trans-parent’
towards MR and PET signal detection
with no signal disturbances in either
direction. A technical precondition to
fulfill these requirements is that the RF
body coil should be ‘PET transparent’
such that gamma quanta emitted by the
patient are not attenuated by the RF
body hardware. An additional conse-quence
is that the PET detectors need to
be non-magnetic and ‘gradient transpar-ent’
in order to not distort the linearity
of the fast switching gradient fields.
The PET detectors require stable temper-atures
over time of around 20°C temper-ature,
which has been achieved by
implementing water cooling into the
APDs (Fig. 1). Analog electrical signals
and water cooling are conducted from
the PET detector in the isocenter of the
magnet bore to the back end of the MR/
PET system. All PET detector electronics
are hermetically shielded by copper ele-ments
in order not to emit RF signals
that potentially could disturb the weak
MR RF signals or contribute to increased
with little attenuation of gamma quanta.
3A 3B
3C
3 System integration testing: RF noise check. Images in (A) show results of an RF noise detection routine in MR imaging that was acquired while
the PET detector unit was simultaneously activated. In this noise check, the RF receivers of the MR system are stepped through a frequency range of
±250 kHz around the Larmor center frequency in intervals of 10 kHz. The panel in (A) shows a selection of 4x4 images, each representing a frequency
range of 10 kHz. The individual noise images here show neither increased noise nor any other discrete enhancement. Zoom-in (B). This result of the
RF noise check indicates uncompromised shielding of the electronic PET components over the whole receiver bandwidths of the MR system. Just to
demonstrate the effect of disturbing RF noise, image (C) shows a single measurement disturbed by a discrete RF signal (vertical stripe on the right
side of the image) that has been provoked by opening the two doors of the RF cabin during measurement.
2
How has the integration of the PET
detector unit into the MR environment
been performed technically? Seen from
the perspective of the signals emitting
patient, the hardware layer structure
of the hybrid system is as follows: The
innermost layer in the magnet bore is
formed by the signal transmitting and
receiving RF body coil with its RF shield,
shielding the RF coil towards the other
structures in the bore. The PET detector
rings are located behind the RF coil and
its RF shield. The layer behind the PET
detector unit is formed by the gradient
coil assembly encompassing gradient
coils for spatial MR signal encoding in all
three dimensions of the scanner coordi-nate
system. The outer layer structure is
formed by the magnet cryostat contain-ing
the liquid helium for magnet cooling
as well as the superconducting magnet
winding producing the 3.0 Tesla static
magnetic B0-field (Fig. 2). The individual
hardware components as well as the
whole hardware assembly are optimized
overall RF noise, leading to decreased
signal-to-noise-ratio (SNR) in MRI mea-surements.
With regard to potential
interaction with the three groups of
electromagnetic fields in an MRI sur-rounding,
all components of the PET
detector and electronics must be abso-lutely
non-magnetic, must be absolutely
RF shielded and must be optimized to
eliminate susceptibility to eddy currents.
Eddy currents potentially interact with
the strong and fast switching magnetic
gradient fields for spatial MR signal
encoding. When switching gradient
fields, according to Lorentz’ induction
law, eddy currents are induced into
neighboring electrically conducting
structures. Unwanted eddy currents thus
counteract the effect of fast switching
linear gradient fields, potentially leading
to reduced rise times, reduced ampli-tudes,
and reduced gradient linearities,
resulting in an overall reduced gradient
performance and non-linear geometrical
distortions in MR imaging.
System integration testing
Early system integration testing of the
Biograph mMR hybrid MR/PET system
has been performed at the Institute of
Medical Physics (IMP), University of
Erlangen, Germany, in close collabora-tion
with Siemens Healthcare, Erlangen,
Germany. Successful system integration
needs to be explored and verified in
numerous systematic technical and
phantom testing experiments. This
requires testing in both directions to
answer the following questions: Is PET
performance influenced by the MR? Is
MR performance influenced by the PET?
MR testing encompasses testing for
potential interactions with RF, B0, and
Gxyz, and related artifacts. PET testing
encompasses testing for count rates,
detector performance, signal homoge-neity,
and artifacts [5].
Figure 3 shows RF noise testing – a rou-tine
system performance test in MRI. In
this test, the RF receiver chain is set to a
high receiver gain and then stepped in
steps of 10 kHz through a varying band-width
ranging from -250 kHz to +250
kHz around the Larmor center frequency
of the 3.0 Tesla MR system. This is per-formed
twice: Once with PET switched
off, and again with the PET hardware
switched on. Thus subtle differences in
the overall noise level or discrete RF
noise frequencies with/without PET can
be detected.
Static magnetic B0-field homogeneity
testing encompasses measurements of
the static magnetic field homogeneity
with/without PET detectors inside of the
system. The difference between both
measurements can be visualized and
evaluated in B0 difference field maps in
three spatial dimensions. Thus subtle
differences in the B0 static magnetic
field homogeneity can be detected and
displayed within ppm accuracy. In the
Biograph mMR system the magnetic field
homogeneity is specified with ≤6 ppm
standard deviation Vrms (volume root-mean
square) over an elliptical volume
of 50 cm diameter in the x-y-plane
and 45 cm in z-direction. In system inte-gration
testing the measurements with/
without PET detector installed did not
reveal any influence of the PET detector
on the B0-field homogeneity of the MR
system.
Also the gradient system performance
with its parameters amplitude (mT/m),
slew rate (T/m/s) and overall linearity
has to be evaluated twice with/without
PET detectors to determine possible vari-ations
from the gradient systems specifi-cations.
Measurements have confirmed
that the gradient systems performance
in the Biograph mMR system is in the
specifications – 45 mT/m maximum
amplitude for all three gradient axes,
200 T/m/s maximum slew rate, and thus
compares well to a system without PET
integrated in the magnet bore. This is a
major precondition to take full advan-tage
of numerous whole-body imaging
90 MAGNETOM Flash 1/2011 · www.siemens.com/magnetom-world MAGNETOM Flash · 1/2011 · www.siemens.com/magnetom-world 91](https://image.slidesharecdn.com/magnetomflash46-00090326-140821154645-phpapp01/85/ISMRM-Edition-Issue-46-47-320.jpg)
![Product News Product News
sequences providing anatomical and
functional tissue information simultane-ously
with a combined data acquisition
with PET: Diffusion-weighted imaging
(DWI), diffusion tensor imaging (DTI),
arterial spin labeling (ASL), functional MRI
(fMRI), MR spectroscopy, time-of-flight
angiography (TOF-MRA), dynamic cardiac
acquisitions, etc., to name only a few.
Finally the PET systems performance has
also to be tested for the potential influ-ences
of the strong magnetic field by
gradient fields, or by RF interactions.
Such testing performed according to
NEMA standards [5] twice outside and
inside of the MRI system and during
system integration testing did not reveal
any deviations from the PET performance
without MRI surrounding.
Siting specifi cs
With this new hybrid imaging systems
generation, combining the non-radiat-ing
imaging modality MRI with the
nuclear medicine imaging modality PET,
a couple of technical and logistical par-ticularities
have to be considered when
it comes to siting of such a hybrid sys-tem.
The high degree of system integra-tion
in case of the Biograph mMR helps
to reduce the space that is required for
system installation. This holds true for
the scanner room as well as for the tech-nical
equipment room. The installation
only requires a minimum of 33 m2 of
installation space for the scanner, elec-tronics
and console room. Figure 4
shows the Biograph mMR installation at
the Institute of Medical Physics (IMP),
University of Erlangen, Germany. When
compared to the installation of a con-ventional
standalone MR system, the
MR/PET hybrid system does not require
additional space in the scanner room
and only requires one additional cabinet
in the technical equipment room (Fig. 5).
Water cooling infrastructure is shared for
both the gradient system and for the PET
detectors. The additional cabinet in the
technical equipment room contains the
PET electronics and computers for signal
processing and image reconstruction,
respectively. Another requirement for
the MR/PET hybrid system installation is
a second filter panel in the RF cabin to
feed the PET signals and associated
cables through the wall between the
system room and the technical equip-ment
room. During the MR/PET systems
installation at the Institute of Medical
Physics, University of Erlangen, a second
RF shielded door was installed in the
RF cabin. Although not a necessity, this
installation at the IMP enables a patient
to be brought directly from the ‘active
waiting’ controlled area into the scanner
room which then becomes a temporal
control area and thus not affecting the
operator room with radiation at any
time. Thus personnel, researchers and
potential visitors can stay in the operator
room while switching patients in the
scanner room.
RF coils and associated attenu-ation
correction
Like its MR-only siblings, the Biograph
mMR MR/PET hybrid system is equipped
with a full set of RF coils and associated
RF architecture – the well established
4 The Biograph mMR system installation at the Institute of Medical Physics, University of Erlangen.
Both imaging modalities – MR and PET – are fully integrated into one MR/PET hybrid system.
5 Schematic showing the compact siting of the Biograph mMR system and its hardware compo-nents.
In comparison to an MR-only installation, the MR/PET installation adds only another filter
panel and one extra cabinet for the PET electronics to the installation site.
Tim technology (Tim, Total imaging
matrix, Siemens Healthcare). The Tim
RF system provides seamless coverage
of the patient’s body with integrated
surface coils from head to toe (Fig. 6).
The coils are each equipped with multi-ple
RF coil channels providing a high coil
element density for high SNR gain as
well as parallel imaging capabilities with
high acceleration factors in three spatial
dimensions. While this integrated RF
surface coil concept today is well estab-lished
in MRI, its use in a combined MR/
PET hybrid imaging system is a novelty
and prerequisite for seamless whole-body
MR/PET acquisitions. The RF sur-face
coils that cover the patient’s body
for optimal MR signal performance are
at the same time in the FOV of the PET
detectors. Thus all RF surface coils now
have to be also optimized towards
PET-transparency, i.e. such coils should
attenuate gamma quanta to only a
minor extent, for optimized PET perfor-mance.
This also holds true for all other
hardware equipment – MR or PET related
– that potentially accompanies the
patient’s body when traveling through
the PET-FOV, e.g. RF surface coils, the
patient table, cables, connectors, patient
monitoring equipment, etc. [6]. Here
one can differentiate between ‘rigid and
stationary’ equipment such as the
patient table, the RF spine array coil as
well as the RF head coil, and between
‘flexible and non-stationary‘ equipment
such as the flexible RF Body Matrix array
coils. ‘Rigid’ here means stable in its
form and geometry. ‘Stationary’ in this
context means non-moving relative to
the patient table whose position is
known to the imaging coordinate sys-tem
at any point in time when moving in
the scanner bore.
The PET signal attenuation and scatter
of rigid and stationary equipment can
be compensated for by straightforward
attenuation correction (AC) methods.
For example, the RF head coil (Fig. 7A) is
scanned in a CT (computed tomography)
6 The Biograph mMR is equipped with the Tim (Total imaging matrix) RF coil technology consisting of multiple integrated surface coils that cover the
patient’s body from head to toe with up to 102 RF coil elements connected to 32 RF receivers. This multi-channel phased array RF coil configuration
enables parallel imaging and whole-body MR data acquisition with optimized signal-to-noise (SNR) performance. In simultaneous MR/PET hybrid
imaging, the surface RF coils are located between the radioactivity emitting patient and the PET detectors. As a consequence, the RF coils should be
designed to be as PET-transparent as possible.
92 MAGNETOM Flash 1/2011 · www.siemens.com/magnetom-world MAGNETOM Flash · 1/2011 · www.siemens.com/magnetom-world 93
4
5
6](https://image.slidesharecdn.com/magnetomflash46-00090326-140821154645-phpapp01/85/ISMRM-Edition-Issue-46-48-320.jpg)
![Product News Product News
system once and a 3-dimensional map
of attenuation values is thus generated
(Fig. 7B). X-ray based CT attenuation
values in general are in the energy range
of about 70–120 keV and thus have to
be converted to the 511 keV energy
level of the gamma quanta emitted in
PET. A 3D graphical representation of
the obtained attenuation values ‘μ-map’
with 511 keV attenuation values is then
generated (Fig. 7C). This CT-based regis-tration
7A 8A 8B 8C 8D 8E
of 3D attenuation values has to
be performed once for each rigid hard-ware
component and then the according
μ-map becomes part of the PET image
reconstruction process. By linking the
RF spine – or RF head coils – position
relative to the patient’s table position,
the relevant AC μ-map for each table
position is automatically selected by the
system for PET image reconstruction.
The flexible and non-stationary Body
Matrix RF array coils covering the
patient’s body cannot be attenuation-corrected
in the same manner. Here the
geometry and position of the coils atten-uating
structures depend on the
patient’s individual anatomy and on the
individual situation of the patient exam
and thus cannot be easily predicted by
MR imaging. Here the emphasis lies on
designing flexible and moving RF coils as
PET-transparent as possible. For the Bio-graph
mMR system, the associated RF
coils have been further optimized in this
regard. Potential design parameters for
RF coil optimization are the choice of
materials, the geometry, and the overall
assembly. The ultimate goal of such an
RF coil design optimization process is to
maximize SNR and signal performance
for MR while not disturbing PET-imaging.
Attenuation correction for
tissue
A necessity in PET-based imaging is the
correction for attenuation and scatter
resulting not just from the hardware in
the PET FOV (e.g. patient table, and RF
coils as described above) but also from
the patient’s body, i.e. the anatomic dis-tribution
of soft tissues, air, and bones
in the individual patient. Such tissue AC
in PET-only systems traditionally has
been performed by rotation of radioac-
7A (A) A head/neck RF
coil that was designed
and optimized towards
PET-transparency for use
in simultaneous MR/PET
hybrid imaging. This RF
coil serves as an exam-ple
of a rigid hardware
component that is sta-tionary
at its known
position with regard to
the patient table. (B) 3D
CT-scan of this rigid RF
coil. Such a CT-scan pro-vides
hardware attenua-tion
values that can be
transformed from the
CT’s 100 keV energy
level to the 511 keV
energy level of PET in
order to derive a PET-equivalent
attenuation
map (μ-map), shown in
image (C). The μ -map
in (C) has been acquired
at level a–b as shown in
image (B).
8 Soft-tissue attenuation correction (AC) based on MR imaging. (A) Uncorrected whole-body PET scan showing relative activity enhancement in
the lungs and on the outer contours of the patient. (B and C) Dixon MR sequence providing separate water/fat ‘in-phase’ and ‘opposed phase’
images that serve as basis for soft-tissue segmentation. (D) Segmented tissue groups (air, fat, muscle, lungs) that can be assigned to 511 keV
attenuation maps. (E) Resulting attenuation corrected whole-body PET scan of the initial data set (A).
tive 68Ge 511 keV sources around the
patient and detection of the attenuated
transmission signals ‘behind’ the patient.
From a number of projections, a topog-raphy
of attenuation values (μ-map)
could be reconstructed. This was a rela-tively
time-consuming process, since the
68Ge-source needed to be rotated at a
relatively slow speed in order to achieve
a significant count rate for each projec-tion
angle.
In modern PET/CT hybrid systems, the
hardware (e.g. patient table) and the
patient tissue μ-map are generated
straightforwardly from a fast (potentially
low-dose) 3D CT scan provided by the
build-in CT scanner. Attenuation values
are converted from the 70–120 keV
energy level to 511 keV and thus a fast
individual and reliably AC μ-map of the
patient and any hardware accessories in
the PET FOV is obtained.
In a combined MR/PET hybrid system
tissue attenuation has to be obtained in
a completely different way. Since no CT-like
attenuation information is available
in such a hybrid system, tissue AC neces-sary
for PET image reconstruction needs
to be based on MR images. The problem
is the non-irradiative nature of MR imag-ing,
based on proton densities and T1
and T2 relaxation parameters, rather
than on the attenuation of radiation in
tissue. MR-based AC of tissues also leads
to the problem that air and bone are
depicted in black the vast majority of MR
imaging sequences turning air and bone
hardly distinguishable, in CT and PET
imaging on the other hand air and bone
show minimal and maximal attenuation
values, respectively. Different methods
have been described in the recent litera-ture,
that deal with MR-based AC for tis-sue
[7–9]. Those methods can be sepa-rated
in atlas-based or atlas-supported
methods and in image segmentation
based efforts. In the latter, the gray val-ues
provided by selected sequences are
registered to different tissue classes
resulting in tissue segmentation.
Depending on the sequence type used,
air, lung, fat, muscle, and bones might
be segmented and provided with accord-ing
PET correction values. In the current
implementation of the Biograph mMR
system, tissue attenuation and scatter
correction is performed twice. The head/
neck region is attenuation-corrected
with the help of a UTE (ultrashort echo
time) sequence [10, 11] providing
segmentation also of the bone which in
this region takes a large percentage of
the imaged volume. All other body parts
are attenuation-corrected by a Dixon
technique providing two images where
water and fat are ‘in phase’ and in
‘opposed phase’. This allows for recon-struction
of fat-only, water-only and of
fat-water images and results in tissue
segmentation of air, fat, muscle, and
lungs (Fig. 8) [8]. Bone is not accounted
for in this approach. Initial results in
patient imaging have shown that this
approach works reliably and provides
results that are comparable to corrected
images form PET/CT in the same individ-ual.
The ultimate impact of this and
other MR-based AC methods on PET-quantification
and determination of
standard uptake values (SUV) has not
yet been determined and is subject
to current investigations and further
research efforts.
7B
7C
a
a–b
b
94 MAGNETOM Flash 1/2011 · www.siemens.com/magnetom-world MAGNETOM Flash · 1/2011 · www.siemens.com/magnetom-world 95](https://image.slidesharecdn.com/magnetomflash46-00090326-140821154645-phpapp01/85/ISMRM-Edition-Issue-46-49-320.jpg)
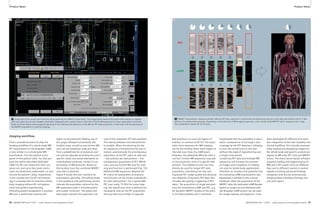

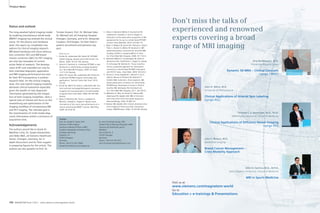
![Clinical mMR mMR Clinical
Whole Body MR/PET Imaging.
First Examples of Clinical Application
A. Drzezga; A.J. Beer; S. Fürst; S. Ziegler; S.G. Nekolla; M. Schwaiger
Technische Universität München, Klinik und Poliklinik für Nuklearmedizin, Klinikum rechts der Isar, Munich, Germany
Introduction
Over the last decade, development of
hybrid-imaging instrumentation has
been among the innovations with the
strongest impact on diagnostic imaging
in clinical everyday routine. The driving
force behind these developments is the
considerable extent to which several dif-ferent
imaging modalities show comple-mentary
rather than redundant features.
Consequently, it is logical to bundle the
particular strengths of different modali-ties,
and to compensate particular defi-cits
of one modality with capabilities of
another by combination of the different
modalities into one hybrid instrument.
Hybrid PET/CT entered the market in
around 2000 and became a major suc-cess,
thereby quickly obviating the
demand for PET-only scanners. This
success has been strongly driven by
oncological applications, combining the
high sensitivity of PET with the anatomi-cal
precision of CT. The coupling of
18F-FDG, a tracer for metabolic activity
with CT, has especially proved highly
valuable: FDG-PET allows the sensitive
detection of tumor cells and the estima-tion
of their viability (e.g. for therapy
control); CT complements the exact
anatomic localization of suspect lesions
and has a very high sensitivity for small
lesions which are missed by PET due to
limited resolution or movement artifacts
(e.g. in the lung).
However, CT has some specific limita-tions,
the most apparent being the rela-tively
low soft-tissue contrast. This rep-resents
a disadvantage particularly for
diagnostic questions directed to body
regions which are defined by a complex
regional arrangement of different adja-cent
soft tissue structures, e.g. the
brain, the head-and-neck region or the
pelvis. In contrast to CT, MR-imaging is
distinguished by the ability to provide
excellent soft-tissue contrast. This is the
main reason why corresponding diag-nostic
problems are typically directed to
MRI as the first-line imaging procedure
of choice rather than to CT. This includes
questions concerning e.g. neurological
disorders, brain tumors, conditions in
the head and neck region, abdominal/
hepatic and pelvic masses and musculo-skeletal
problems.
For many of these diagnostic questions,
PET has demonstrated a high added
value as a complementary test in itself,
whilst frequently being performed in
addition to mandatory MRI-tests (see A.
Padhani ‘Multiparametric imaging of
tumors – an emerging paradime’,
MAGNETOM Flash #45 3/2010, Research
Supplement). Thus, the value of a com-bination
of PET with MRI seems obvious.
However, the development of such
hybrid MR/PET instrumentation has been
hampered for a long time primarily by
technical obstacles which have been
harder to overcome compared to the
combination of PET and CT. Whereas the
latter both represent modalities working
with radiation (although in different
wavelengths) and can thus be combined
more easily, PET and MRI are based on
entirely different image acquisition
principles. The strong magnetic field
required for MR-image acquisition is
severely affecting the acquisition of the
PET-signal. In particular, the conven-tional
photomultiplier technique com-monly
used for obtaining the PET signal
does not work properly in a magnetic
field. To circumvent this limitation, plat-forms
have been developed in which
spatially separate MR- and PET-scanners
are connected by means of a moving
table. The patient is positioned on this
table and undergoes first PET and then
MR imaging, without having to get up
from the table between the scans. How-ever,
these solutions do not allow simul-taneous
image acquisition and they are
of course associated with lengthy exami-nation
protocols and with the risk of
patient movement.
With the introduction of the so-called
APDs (Avalanche Photodiodes) into PET-Integrated
instrumentation this problem has been
solved more elegantly. APDs function in
strong magnetic fields and can be used
to substitute conventional photomulti-pliers
to acquire information in the MR-scanner.
The advent of this technology
has allowed the industry to produce a
first generation of hybrid MR-scanners in
which a true integration of both modali-ties
in a single machine has been realized
(see H. Quick ‘Whole-body MR/PET hybrid
imaging’ page 88 in this issue of
MAGNETOM Flash). This principle was
first successfully demonstrated by
means of small head-only PET-scanners
(PET-insert) which have been installed in
conventional MR-scanners (see T. Beyer
et al. ‘MR/PET-hybrid imaging for the
next decade’, MAGNETOM Flash #45
3/2010 Research Supplement). Several
studies have been performed in this pro-totype
system since and proved the
practicability of the concept [1–4].
On the basis of this prototype, a dedi-cated
whole-body MR/PET system has
now been developed. In November
2010, the world’s first integrated clinical
whole-body MR/PET scanner (Siemens
Biograph mMR) was installed in the
Department of Nuclear Medicine at the
Technische Universität München (TUM),
in Munich, Germany. The scanner is now
operated by a consortium between the
directors of Nuclear Medicine (Prof. Dr.
Markus Schwaiger) and Radiology (Prof.
Dr. Ernst Rummeny) from TUM and the
directors of Nuclear Medicine (Prof.
Peter Bartenstein) and Radiology (Prof.
Dr. Maximilan Reiser) from the Ludwig-
Maximilians-Universität, München. The
setup of the first scanner of this type in
Germany (and of three identical scan-ners
which will be established in 2011 in
Essen, Leipzig and Tübingen) has been
made possible by funding of the German
Research Foundation (DFG, Deutsche
Forschungsgemeinschaft).
The Biograph mMR MR/PET-scanner is
constituted by a high end 3T MR-scanner
which harbours a fully functional state-of-
the-art PET system within the gantry.
The PET-system covers a field of view
(25.8 cm) which is larger than in any
other existing PET-camera. This allows to
obtain multimodal (MR&PET) image
information simultaneously in an
extended region and to cover the entire
body with a limited number of bed posi-tions
in short time. For further technical
details on the system see page 88 in this
issue of MAGNETOM Flash.
Opportunities of the
MR/PET-system
From a clinical point of view, this system
offers a number of obvious advantages:
1. Reduction in examination time
In comparison to clinical CT-examina-tions,
MR-scans can often be relatively
time-consuming. The recently intro-duced
whole-body MR/PET scanner
now allows the acquisition of MR and
PET information in a truly simultane-ous
approach, i.e. in regional align-ment
at exactly the same time,
thereby reducing not only the number
of examination appointments (i.e. the
visits patients have to make to the
imaging department) but also cutting
the required examination time approx-imately
in half (as compared to two
separate examinations). This option of
‘one-stop shop’ examinations repre-sents
a major gain in patient comfort
for patients requiring both MR and PET
examinations and also reduces the
required time of the medical person-nel
to acquire the requested imaging
information.
2. Regional coregistration
The acquisition of PET and MR-infor-mation
in exactly overlapping anatom-ical
positions also offers clear advan-tages:
Precise coregistration of the
PET-signal with the underlying ana-tomical
information is assured as the
risk of patient movement or changes
in organ position (e.g. in bowel posi-tions,
different bladder filling status)
between the acquisition of the two
modalities is reduced, and thus poten-tial
misalignment is minimized. Due
to the lack of radiation exposure by
the MR-image acquisition, anatomical
scans can be added/repeated to achieve
optimal anatomical information.
3. Simultaneity of acquisition
The newly introduced integrated MR/
PET scanners for the first time allow
truly simultaneous acquisition of
imaging information from two differ-ent
modalities of the same region at
the same time. This opens a com-pletely
new dimension in hybrid imag-ing.
Even established PET/CT technol-ogy
only allows the acquisition of CT
and PET in the same system but not at
exactly the same time and region, as
the two modalities/acquisition proce-dures
are cascaded one after the other.
The simultaneous acquisition of MR
and PET information opens the oppor-tunity
to address many new scientific
questions, which may be translated
into clinical application, e.g. to cross-evaluate
the value of different imag-ing
tests under identical examination
conditions or to improve understand-ing
of disease pathophysiology by
shedding light on the interrelation
between different pathological pro-cesses.
Simultaneous acquisition may
also allow the following of organ and/
or patient movement over time allow-ing
for motion correction [2] and also
the combination of information on
motility with other functional informa-tion
provided by PET (e.g. information
on viability/perfusion derived from
PET-imaging with information on wall
movement in cardiac examinations).
4. Exposure to ionizing radiation
Radiation exposure based on clinical
imaging tests is currently a much-dis-cussed
topic. Compared to PET/CT,
hybrid MR/PET offers the chance to
reduce ionizing radiation exposure
without loss of diagnostic informa-tion.
MRI will probably allow anatomi-cal
allocation of the PET-signal with
comparable precision as known from
CT. In some cases the combination of
PET-imaging with appropriate diagnos-tic
MR-imaging procedures may be of
superior diagnostic value with consid-erably
lower radiation exposure as
compared to the combination of PET
and diagnostic CT.
102 MAGNETOM Flash 1/2011 · www.siemens.com/magnetom-world MAGNETOM Flash · 1/2011 · www.siemens.com/magnetom-world 103](https://image.slidesharecdn.com/magnetomflash46-00090326-140821154645-phpapp01/85/ISMRM-Edition-Issue-46-53-320.jpg)
![Clinical mMR mMR Clinical
5. Complementary/superior diagnostic
value of MR/PET compared to PET/CT
It is well known that MRI has comple-mentary
features to CT. The most
obvious being the higher soft-tissue
contrast. As mentioned above, com-bined
MR/PET may be of obviously
higher diagnostic value compared
to PET/CT for indications and in body
regions which would usually be
approached using MRI rather than CT
(see clinical examples below). In this
regard MR/PET may represent a com-plementary
imaging technique to PET/
CT in the future just as MR itself repre-sents
a complementary imaging tech-nique
to CT nowadays.
6. Opportunities for scientific
applications
The MR/PET-system opens a large
number of potential scientific applica-tions.
Among these is the unique
option to establish previously
unknown interrelations between dif-ferent
measures of pathology and
physiology in the human body such as
structure and function, perfusion and
metabolism, tissue diffusivity and cell
proliferation etc. This may allow to
improve the understanding of healthy
organ function and to detect causal
relationships in disease pathogenesis
potentially leading to new therapeutic
approaches.
For clinical diagnosis, combined MR/
PET may allow the development of
integrated multiparametric markers
for more sensitive and more specific
diagnosis, therapy planning and evalu-ation
[5]. Several previous studies
using separate modalities point to a
potentially high scientific and clinical
benefit from multimodal imaging
approaches using MR/PET [e.g. 5–7].
Challenges of the MR/PET
system
Like every new system, combined MR/
PET still has a number of apparent chal-lenges:
1. Attenuation correction
In PET/CT systems, low-dose CT scans
are used to estimate the expected
attenuation of the radiation emitted
from a specific body region. In con-trast
to CT, MR imaging does not pro-vide
information on tissue specific
photon absorption, but rather on tis-sue
type/class. However, it has been
demonstrated that by means of a set
of specific MR-sequences (Dixon imag-ing
or chemical shift imaging) suitable
attenuation maps can be calculated,
which allow an approximation of 511
keV photon attenuation correction
with sufficient reliability [8]. The dual
point VIBE T1-weighted Dixon
sequence used for attenuation correc-tion
in the Biograph mMR can be
acquired quickly for each bed position
(e.g. in the thorax during one breath-hold),
practically not increasing the
examination time. However, the cur-rent
approach of tissue classification
with the Dixon sequence is not yet
fully satisfying, it is prone to metal
artifacts, attenuation by bones is not
considered and truncation artifacts
may occur due to the limited transax-ial
field-of-view of the MR/PET scanner
(particularly of the upper limbs). The
compensation for these artifacts is
currently a matter of ongoing
research. Moreover, it can be antici-pated
that different sequences for
attenuation correction will be used in
specific areas of the body. For the
head e.g., bone probably cannot be
neglected completely for truly accu-rate
AC, especially for the skull base.
Therefore in this region, the applica-tion
of ultrashort TE (UTE) sequences
might be favourable, which allows for
delineation of the bone, thus leading
to more exact attenuation maps
(μ-maps) as compared to the Dixon
imaging approach.
2. Anatomical allocation of PET-findings
The low dose CT scan of the whole
body as acquired in conventional PET/
CT provides limited diagnostic infor-mation
but it allows a rough anatomi-cal
allocation of suspect PET-findings
with sufficient reliability in many
cases. For precise attribution diagnos-tic
contrast-enhanced CT scans can be
acquired in very short time and pro-vide
excellent anatomical information.
By contrast, MR-sequences can be
comparably slow and it may not be
feasible to always acquire whole-body
MR-information with high resolution
in due time. However, it seems likely
that the Dixon-sequences used for
attenuation correction of the PET-data
also can be used for anatomical alloca-tion
of PET-findings with very satisfy-ing
results. These whole-body images
can then be complemented by added
high-resolution MR-sequences in par-ticular
regions of interest.
3. MR-specific diagnostic limitations
It is expected that MR/PET will be infe-rior
to PET/CT for indications which are
commonly addressed with better diag-nostic
value by CT, e.g. small pulmo-nary
lesions. It remains to be evaluated
for which indications MR/PET is supe-rior
or equal to PET/CT and for which
indications PET/CT will remain the
method of choice.
4. Workflow
The high costs for this type of imaging
instrumentation will require elaborate
logistics regarding patient flow, occu-pancy
of the scanner, selection of
examination procedures etc., to assure
efficient utilization of the scanner. The
combined acquisition of MR and PET
information defines the need for spe-cially
educated medical personnel
experienced with both modalities.
5. Design of suitable imaging protocols
The large number of available MR-sequences
and of different PET-tracers
exponentiates the number of potential
combinations of imaging tests. This
will define the need to develop opti-mized
imaging algorithms for specific
diagnostic questions, which ensure
the selection of the most beneficial
combinations.
Examples for clinical applications
1. Oncology
Case 1 Patient with a cervical Non-Hodgkin lymphoma.
1A 1B
FDG-PET (Metabolism)
ventral
L R
dorsal
R
1C 1D
MRI
Fusion FDG-PET & MRI
L
L L
MR/PET München (TUM/LMU) funded by the DFG.
R R
1 A: Overview using the opposed phase of the MR AC Dixon sequence. B: Axial slice of the 18F-FDG-PET image, demonstrating tumor-suspect
increased metabolism in two lesions (left and the right lateral). C: Axial MRI (STIR sequence) demonstrating the high tissue contrast. Several
cervical lymph nodes are apparent, some enlarged. D: Overlay of PET and MRI, easily tumor-typical (red arrows) and non tumor-typical findings
(green arrow) can be identified and allocated anatomically.
104 MAGNETOM Flash 1/2011 · www.siemens.com/magnetom-world MAGNETOM Flash · 1/2011 · www.siemens.com/magnetom-world 105](https://image.slidesharecdn.com/magnetomflash46-00090326-140821154645-phpapp01/85/ISMRM-Edition-Issue-46-54-320.jpg)
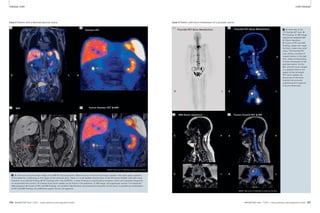
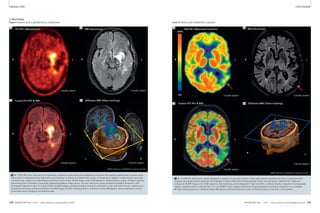

![The 7th MAGNETOM World Summit took place in Shenzhen, China.
Clinical Perspective of
the MAGNETOM World Summit
Matthias P. Lichy, MD, M.Sc.
Siemens Healthcare, Erlangen, Germany
The MAGNETOM World Summit is a valuable source of detailed information about
clinical applications and upcoming developments. The talks given at the MAGNETOM
World Summit and additional, clinically relevant information is available online at
www.siemens.com/magnetom-world.
For an optimal clinical application
of MRI it is also important to optimally
utilize already existing technologies.
This makes a clinically relevant differ-ence
in diagnoses as demonstrated for
liver imaging [23–24] including dynamic
scans; and for emerging indications
like imaging of rheumatism [25] and
peripheral nerves [26, 27].
References
[23] Puneet Sharma. T1w liver dynamics.
[23] Jeong-Min Lee. Imaging of the liver and the
biliary system with MR.
[24] Zheng Meng-Su. SWI of the liver – clinical
applications.
[25] John A. Carrino. Imaging of rheumatoid
arthritis.
[26] Meng Quan-Fei. Peripheral nerve imaging from
head to toe: role of 3D high resolution DW MRI.
[27] Mirko Pham. Imaging of peripheral nerves –
status quo.
It is not the purpose of this short article
to summarize the 7th MAGNETOM World
Summit in detail but to show the clinical
perspective behind all our conjoined
efforts. Education plays an important
role at each MAGNETOM World Summit.
The last Summit not only covered clini-cal
topics such as MR arthrography or
Life
whole-spine imaging [28, 29] but pro-vided
a deeper scientific insight into MR
technologies like ultra high-field (UHF)
[30, 31], pharmacokinetic modelling
[32] and MR/PET [33]. These technolo-gies
will certainly change our clinical
perspective of MRI.
References
[28] Marco Zanetti. When do I need an arthro-gram?
[29] Marco Zanetti. Whole spine imaging –when
is it a clinical must?
[30] Daniel K. Sodickson. 7T MRI-technology.
[31] Zang-Hee Cho. Clinical impact of 7T MRI.
[32] Bernd Pichler. MR-PET-technology
It is crucial to understand clinical needs
and opportunities of new imaging tech-nologies
to answer the questions of
referring clinicians and therefore to pro-vide
best patient care. The exchange of
knowledge about existing and upcom-ing
technologies, clinical demands and
how we as radiologists and industry
can answer these demands is at the
heart of the MAGNETOM World Summit,
organized by Siemens Healthcare MR.
The following limited overview high-lights
some of the clinical perspectives
discussed at the 7th MAGNETOM World
Summit in Shenzhen, China.
Diffusion-weighted MRI (DWI) outside
the brain is probably – from a clinical
perspective – the most emerging imag-ing
technique within the last years in the
field of MRI. Initially intended to improve
the detection of suspicious lesions, it
was soon used to provide PET-like
images with MRI. But with further evolu-tion
of sequence techniques and in com-bination
with new coils [1] and parallel
imaging [2], DWI can now easily be
applied in clinical routine as a real
whole-body imaging modality. It can
also be used to quantify restriction of
diffusion and provides therefore impor-tant
information for therapy assessment
[5] Heinz-Peter Schlemmer. Prostate cancer – when
MRI should be used.
[6] Anwar Padhani. Prostate cancer – state-of-the-art
imaging techniques.
Clinical indications, comparability and
standardization of MR protocols and
the resultant quality of care was one
of main topics discussed, ranging from
pediatric imaging [7–10], oncology
(the imaging of breast cancer with MRI
[11–13]) to dementia and vascular
diseases [14–16].
References
[7] Michael Ditchfield. Imaging of the young brain
– which technique for which referral?
[8] Michael Ditchfield. Why, when and how to
image joints in childhood.
[9] Charuta Dagia. Staging and therapy follow-up
of malignancies in childhood.
[10] Jeannette Schulz-Menger. Imaging of the
young heart – the role of MRI in congenital
cardiac malformations.
[11] Gladis Lo. When should MRI of the breast be
the standard?
[12] Mitsuhiro Tozaki. DWI and MR spectroscopy
of the breast.
[13] Mitsuhiro Tozaki. MRI biopsy of the breast –
indications and techniques.
[14] Li Kun-Cheng. MR imaging of the ischemic
brain.
[15] Alma Gregory Sorensen. Imaging of dementia
– when MR beats molecular imaging.
[16] Feng Xia-Yuan. Imaging brain tumors – a
necessity to combine morphology with function.
The value of cardiovascular MRI is
already well recognized. However, espe-cially
for elderly patients with potentially
impaired physiological capabilities, the
appropriate selection of imaging proto-cols
and realization of stress cardiac
exams in a realistic and tolerable exami-nation
time and the implementation of
low-dosage or even contrast-media free
MR angiography are challenges in clini-cal
routine and were therefore covered
in detail [17–22].
References
[17] Jens Vogel-Claussen. Imaging of the heart –
the role of MRI compared to ultrasound and
molecular imaging.
[18] Jens Vogel-Claussen. Heart perfusion – when
should I stress the heart?
[19] Russel Bull. Increasing productivity with
the Cardiac Dot Engine – the Bournemouth
experience.
[20] Li Kung-Cheng. Coronary MRA at 3T.
[21] Henrik Michaely. Low dose and large field-of-
view MR angiography.
[22] James C. Carr. Non-contrast enhanced
MR angiography – when contrast matters.
in a variety of malignancies [3]. In com-bination
with other imaging modalities,
DWI can assist in identifying suspicious
lesions and therefore potentially
increase the sensitivity of these imaging
approaches [4]. For the detection of
prostate cancer within the gland, in par-ticular,
integration of DWI including
the calculation of the ADC (apparent
diffusion coefficient) value has now to
be regarded as clinical standard [5, 6].
References
[1] Daniel K. Sodickson. Parallel imaging.
[2] Jürgen Hennig. High density coils and Tim4G.
[3] Anwar Padhani. Why and when to use diffusion-weighted
imaging outside the brain.
[4] Jelle Barentsz. Lymph node imaging with MR.
The 8th MAGNETOM World Summit
will take place in the USA in 2012.
Once details are available we will
announce them at:
www.siemens.com/magnetom-world
Contact
Matthias Lichy, MD, MSc
Siemens AG
H IM MR MK O AW
Allee am Roethelheimpark 2
D-91052 Erlangen
Germany
matthias.lichy@siemens.com
k This Quick Response code is your direct link to the
clinical talks at www.siemens.com/magnetom-world
> Education > e-trainings & Presentations.
112 MAGNETOM Flash 1/2011 · www.siemens.com/magnetom-world MAGNETOM Flash · 1/2011 · www.siemens.com/magnetom-world 113](https://image.slidesharecdn.com/magnetomflash46-00090326-140821154645-phpapp01/85/ISMRM-Edition-Issue-46-58-320.jpg)


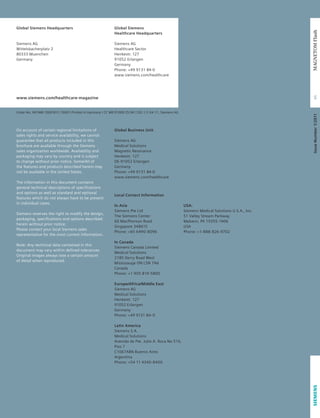

The document discusses protocols for MRI of the lung: - Fast breath-hold sequences are used to image the lung with reasonably high spatial resolution within the short time before signal decay. - Siemens MAGNETOM scanners offer a selection of optimized lung imaging protocols including sequences for nodules, infiltrates, pulmonary embolism, and lymph nodes. - Example protocols include a 15 minute "General Routine" protocol for general purposes and a 20-30 minute contrast-enhanced study including perfusion imaging and angiography.


