Magellan Strategies survey of 2,490 likely Montana general election voters. The survey includes a voter mood question, US Senate ballot test of Steve Daines, John Walsh, and Roger Roots, and a Congressional generic ballot test.
The 2016 Election - How and why it's President TrumpLangerResearch
Presented at AAPOR 2017 by Sofi Sinozich, Research Analyst at Langer Research Associates, and Gregory Holyk, Senior Research Analyst at Langer Research Associates
This memorandum is a summary of an automated survey of 869 likely voters in Maine. The survey was fielded October 23rd and 24th and has a margin of error of +/- 3.32% at the 95% confidence level.
The survey finds Republican Governor Paul LePage and Democrat Mike Michaud in a statistical tie with one week to go before Election Day. Among all voters, Paul LePage has 42.3% support; Mike Michaud has 41.6%, and independent candidate Eliot Cutler has 13.2% support. Among all male voters Paul LePage leads Mike Michaud by 3 points, 43% to 40% respectively, and among all female voters Mike Michaud leads by 1 point, 43% to 42% respectively. Independent Eliot Cutler’s strongest base of support is among married men and independent voters, with 16%.
The image ratings of both Paul LePage and Mike Michaud are very similar. Among all voters, 47% have a favorable opinion of Mike Michaud and 46% have an unfavorable opinion of him. For Paul LePage 48% of voters have a favorable opinion of him and 47% have an unfavorable opinion of him. The following table shows the ballot test by voter subgroup.
Conservatives For Clean Energy (CCE), in a poll conducted by Strategic Partners Solutions, recently released its findings regarding statewide opinions on current energy issues facing North Carolina.
With Congressional Republicans on the verge of passing the largest tax reform bill in decades on Wednesday, overall Congressional approval remains low (21%). Self-identified Democrats are particularly disapproving of Congress giving the institution a 16% approval rating. Rank and file Republicans are a little more positive, but even they only give Congress a 30% approval score.
Echoing Congress, President Trump's approval rating also remains near its record low level, this week at 35%. However, Republicans continue to back the President in large numbers, currently at 76% approve.
The broad antipathy to Congress and the President is potentially fueling Democratic disgruntlement to the tune of a 12-percentage point advantage on the 2018 generic Congressional ballot question. Currently, 39% of Americans would vote for a Democrat versus 27% voting for a Republican if the midterms were held today.
Healthcare (17%), terrorism (15%), and the economy (11%) remain the top three issues facing the US today, with party lines continuing to dictate priorities. Nearly a quarter of Democrats (22%) believe healthcare is the most important problem facing the US, while a similar percentage of Republicans (23%) count terrorism as the most important.
April De Simone, Founder, Designing the WE
Celinda Lake, President, Lake Research Partners
Sam Munger, Director, State Innovation Exchange
Shaun Chapman, Chief of Staff, SolarCity
Richard Eidlin, Vice President, American Sustainable Business Council (moderator)
Watch this webinar: http://asbcouncil.org/video/what-election-means-sustainable-businesses#.WCzKTCSECAU
As election day in the United States draws near, all eyes will be on early voting numbers and eventually official returns. Our resident election expert, Nicholas Whyte, prepared this guide to knowing what it will take to win and when we're likely to know the outcome. Keep it handy!
The presence of military-trained gang members (MTGMs) in the community increases the threat of violence to citizens. The problem addressed was the growing presence of military-trained gang members in civilian communities in Tennessee. We examined the perceived presence of military-trained gang members of gang investigators at the annual conference and whether there had been changes since the previous survey. Many respondents reported gang members in their jurisdictions were increasingly using military-type weapons or explosives (51%), as well as military-type equipment like body armor, night-vision devices, etc. (30%). Although few (24%) agreed that gang members were using military-type tactics, a majority (over 90%) reported gang members committed home invasions and armed robberies. Many (46%) reported that there were gang members in their jurisdiction currently serving in the military, while 64% reported they had gang members who had served. Most of the respondents (66%) did not believe that military representatives advised their department when gang members were discharged from the military. More of the 2014 respondents than those in 2010 reported gang member use of military weapons, explosives, and equipment. More also reported gang members committed home invasions and armed robberies, and gang members currently in the military in their jurisdictions. Fewer thought their organization had a working relationship with military investigative authorities.
The nationwide TNS opinion poll was carried out between 15 and 20 January of 2013 by its local partner IPSC. The poll was commissioned by European Friends of Armenia (www.EuFoA.org) in order to contribute to a factual debate ahead of the elections. The sample size of the survey is 1,607.
California Congressional District 22 Immigration Reform Survey - Magellan Str...Magellan Strategies
Magellan Strategies public releases of the results of a 687n autodial and cell phone survey of likely 2014 general election voters in California Congressional District 22 regarding the opinion of Immigration reform. Conducted on October 7th - 8th, 2013.
Magellan Strategies public releases of the results of a 706n autodial and cell phone survey of likely 2014 general election voters in California Congressional District 10 regarding the opinion of Immigration reform. Conducted on October 16th - 17th, 2013.
California Congressional District 23 Immigration Reform Survey - Magellan Str...Magellan Strategies
Magellan Strategies public releases of the results of a 687n autodial survey of likely 2014 general election voters in California Congressional District 23 regarding the opinion of Immigration reform. Conducted on October 28th - 29th, 2013
California Congressional District 49 Immigration Reform Survey - Magellan Str...Magellan Strategies
Magellan Strategies public releases of the results of a 718n autodial survey of likely 2014 general election voters in California Congressional District 49 regarding the opinion of Immigration reform. Conducted on October 28th - 29th, 2013
Magellan Strategies public releases of the results of a 720n autodial survey of likely 2014 general election voters in Colorado Congressional District 3 regarding the opinion of Immigration reform. Conducted on October 17th - 18th, 2013.
Survey of likely 2014 likely voters in Arkansas, Colorado, Georgia, Kentucky, Louisiana, Michigan, Montana and North Carolina measuring opinion of the proposed EPA carbon emissions regulations.
Magellan Strategies BR today released the survey results today of an automated survey of 1,618 likely New Hampshire voters. The survey was conducted July 16-17. The margin of error for a survey of this size is 2.43%. The survey was commissioned by Citizens for a Strong New Hampshire. Aided by a dismal political environment, Scott Brown is within 5 points of defeating Jeanne Shaheen.
ОПРОС: КТО ПОБЕДИТ ТРАМПА НА СЛЕДУЮЩИХ ВЫБОРАХmResearcher
Если президент США Дональд Трамп будет баллотироваться на второй президентский срок, он столкнется с серьезной конкуренцией со стороны американских политиков и лидеров общественного мнения
Magellan Strategies BR today released the survey results today of an automated survey of 1,618 likely New Hampshire voters. The survey was conducted July 16-17. The margin of error for a survey of this size is 2.43%. The survey was commissioned by Citizens for a Strong New Hampshire. Aided by a dismal political environment, Scott Brown is within 5 points of defeating Jeanne Shaheen.
The second nationwide TNS opinion poll was carried out between 31 January and 5 February 2013 by its local partner IPSC. The poll was commissioned by European Friends of Armenia (www.EuFoA.org) in order to contribute to a factual debate ahead of the elections. The sample size of the survey is 1,609.
Magellan Strategies 2012 Internal Survey Research Summary Memorandum 120612Magellan Strategies
This memorandum is a full review of Magellan Strategies surveys from the 2012 election cycle. The memorandum goes into detail about the challenges of survey research for the cycle, and how well Magellan Strategies research held up to the final outcome.
Public Perceptions of Corruption, Trust in State Institutions, China’s Influe...Afrobarometer
What do the citizens of #Zimbabwe say about #corruption and the influence of China on their country. On corruption, two-thirds Zimbabweans feel corruption has increased over the past year. Find out more in this presentation.
As Americans prepare for political debates around the Thanksgiving dinner table (or prepare to avoid them), two thirds continue to believe the US is on off on the wrong track (63%). While only 24% of Americans believe the US is heading in the right direction, partisan differences are stark with 52% of Republicans saying the country is headed in the right direction compared to 6% of Democrats.
Republicans and Democrats also do not see eye-to-eye on the main problem facing the country. More Democrats (24%) say it is healthcare while more Republicans (20%) say it is terrorism.
President Trump’s approval rating has remained steady, with 36% approving of him, but also is highly partisan. Three quarters of Republicans (75%) approve of the president compared to only 8% of Democrats. His strongest issues include employment and jobs (44%), dealing with ISIS/ISIL (44%) and the economy (42%). While Congress continues to debate tax reform, Trump has struggled to raise his approval on taxation (now at 36%, down from 40% last week).
One in five Americans guess that Jeff Session will be the next to resign or be terminated according to our latest ‘Wh-Exit’ poll.
Ipsos’ Generic Ballot Question for 2018 suggests that Democrats continue to enjoy a sizable advantage, up +9 points from Republicans (37% Democrat vs. 28% Republican). Independents are currently also breaking towards Democrats at 26% Dem vs. 14% Repub (with 16% other and 44% not voting).
Colorado Unaffiliated Women Voter Post Election Survey Summary 121714Magellan Strategies
This document is a summary of a post-election landline and cell phone survey of 500 unaffiliated women voters in Colorado that voted in the 2014 general election. The interviews were conducted on November 17th and 18th, and the survey has a margin of error of +/- 4.38% at the 95 percent confidence interval. This group of women voters contributed 14% of the total vote, or 286,283 votes of the 2,080,071 total votes cast in the 2014 election.
The survey used Magellan Strategies Colorado segmentation data to draw the sample, which only surveyed female unaffiliated voters that voted in the 2014 general election. The three unaffiliated segments used were Lean Republican Unaffiliated, True Middle and Lean Democrat Unaffiliated. Among all unaffiliated women who voted in the 2014 general election, 17% were Lean Republican Unaffiliated, 48% were True Middle and 35% were Lean Democrat Unaffiliated.
Most observers of Colorado politics would confirm that unaffiliated women voters are an important voting block that can decide most elections in the Centennial state. These women voters are less partisan and more likely to consider candidates of both parties. This survey attempts to understand how these women viewed: the 2014 candidates for the United States Senate and Governor, the dominance of women’s issues, the Republican and Democrat parties, and their support for Hillary Clinton in 2016.
Sutherland Institute Utah Medicare Expansion Survey Summary 091514Magellan Strategies
The survey finds that Utah registered voters are reluctant to favor any of the four Medicaid expansion proposals currently being considered by Governor Herbert and the state legislature. Of the four Medicaid expansion proposals that were tested in the survey, no individual proposal received 50% support among respondents. After explaining the details of each proposal in a stand-alone question format, on average 30% of respondents were unsure if they favored or opposed the proposals. Of the four proposals, the “Do Not Expand Medicaid Right Now” proposal had the highest percentage of voters favoring a proposal with 45% and the lowest percentage opposing a proposal at 26%.
The Healthy Utah Proposal was favored by 32% of respondents, opposed by 40% of respondents, and 28% were unsure or did not have an opinion of the proposal. The Traditional Medicaid Expansion and Partial Medicaid Expansion proposals were the least favored proposals by voters, with only 21% and 19% favoring them respectively. A near majority of 49% and 48% of voters oppose the Traditional and Partial Medicaid Expansion proposals, respectively.
After respondents were informed about the details of each proposal and then asked to choose which one they believed was the best proposal that should be implemented, a plurality of 31% chose the “Do Not Expand Medicaid Right Now” proposal. Seventeen percent chose the Healthy Utah Proposal, 15% chose the Traditional Medicaid Expansion Proposal, and 10% chose the Partial Medicaid Expansion Proposal. One in five respondents, or 20%, were unsure or did not know which proposal was the best and should be implemented, and 7% did not like any of the proposals.
National Mining Association Kentucky EPA Regulation Survey Summary 091014Magellan Strategies
Survey of likely 2014 Kentucky general election voters, measuring voter opinion of the Obama Administration's proposed emission regulation and the United States Senate election between Mitch McConnell and Alison Lundergan Grimes.
Magellan Strategies BR today released the survey results today of an automated survey of 1,618 likely New Hampshire voters. The survey was conducted July 16-17. The margin of error for a survey of this size is 2.43%. The survey was commissioned by Citizens for a Strong New Hampshire. Aided by a dismal political environment, Scott Brown is within 5 points of defeating Jeanne Shaheen.
This presentation explains a predictive data modeling project that segmented Colorado's 3.5 million voters into 11 groups. The segmentation enables campaign decision makers the ability to understand and target voters beyond data that is is available on a Colorado voter file.
600n survey of likely 2014 Louisiana general election voters. The survey looks at the US Senate race between Mary Landrieu, Bill Cassidy, Rob Maness, and Paul Hollis. Other public policy issues covered in the survey include labor union dues, common core standards, education issues, expansion of Medicaid, impact of the Affordable Healthcare Act, and issues relating to businesses being sued having a right to a trial by jury.
California Congressional District 25 Immigration Reform Survey - Magellan St...Magellan Strategies
Magellan Strategies public releases of the results of a 687n autodial survey of likely 2014 general election voters in California Congressional District 23 regarding the opinion of Immigration reform. Conducted on October 28th - 29th, 2013
01062024_First India Newspaper Jaipur.pdfFIRST INDIA
Find Latest India News and Breaking News these days from India on Politics, Business, Entertainment, Technology, Sports, Lifestyle and Coronavirus News in India and the world over that you can't miss. For real time update Visit our social media handle. Read First India NewsPaper in your morning replace. Visit First India.
CLICK:- https://firstindia.co.in/
#First_India_NewsPaper
31052024_First India Newspaper Jaipur.pdfFIRST INDIA
Find Latest India News and Breaking News these days from India on Politics, Business, Entertainment, Technology, Sports, Lifestyle and Coronavirus News in India and the world over that you can't miss. For real time update Visit our social media handle. Read First India NewsPaper in your morning replace. Visit First India.
CLICK:- https://firstindia.co.in/
#First_India_NewsPaper
03062024_First India Newspaper Jaipur.pdfFIRST INDIA
Find Latest India News and Breaking News these days from India on Politics, Business, Entertainment, Technology, Sports, Lifestyle and Coronavirus News in India and the world over that you can't miss. For real time update Visit our social media handle. Read First India NewsPaper in your morning replace. Visit First India.
CLICK:- https://firstindia.co.in/
#First_India_NewsPaper
El Puerto de Algeciras continúa un año más como el más eficiente del continente europeo y vuelve a situarse en el “top ten” mundial, según el informe The Container Port Performance Index 2023 (CPPI), elaborado por el Banco Mundial y la consultora S&P Global.
El informe CPPI utiliza dos enfoques metodológicos diferentes para calcular la clasificación del índice: uno administrativo o técnico y otro estadístico, basado en análisis factorial (FA). Según los autores, esta dualidad pretende asegurar una clasificación que refleje con precisión el rendimiento real del puerto, a la vez que sea estadísticamente sólida. En esta edición del informe CPPI 2023, se han empleado los mismos enfoques metodológicos y se ha aplicado un método de agregación de clasificaciones para combinar los resultados de ambos enfoques y obtener una clasificación agregada.
An astonishing, first-of-its-kind, report by the NYT assessing damage in Ukraine. Even if the war ends tomorrow, in many places there will be nothing to go back to.
‘वोटर्स विल मस्ट प्रीवेल’ (मतदाताओं को जीतना होगा) अभियान द्वारा जारी हेल्पलाइन नंबर, 4 जून को सुबह 7 बजे से दोपहर 12 बजे तक मतगणना प्रक्रिया में कहीं भी किसी भी तरह के उल्लंघन की रिपोर्ट करने के लिए खुला रहेगा।
Magellan Strategies Montana US Senate Survey Release April 10, 2014
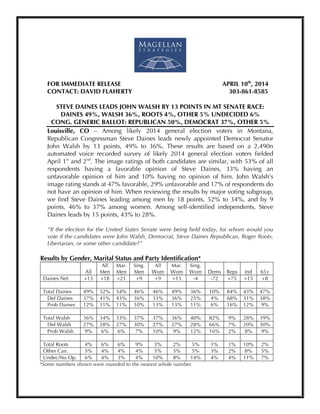
1. !
FOR IMMEDIATE RELEASE APRIL 10th
, 2014
CONTACT: DAVID FLAHERTY 303-861-8585
STEVE DAINES LEADS JOHN WALSH BY 13 POINTS IN MT SENATE RACE:
DAINES 49%, WALSH 36%, ROOTS 4%, OTHER 5% UNDECIDED 6%
CONG. GENERIC BALLOT: REPUBLICAN 50%, DEMOCRAT 37%, OTHER 5%
Louisville, CO – Among likely 2014 general election voters in Montana,
Republican Congressman Steve Daines leads newly appointed Democrat Senator
John Walsh by 13 points, 49% to 36%. These results are based on a 2,490n
automated voice recorded survey of likely 2014 general election voters fielded
April 1st
and 2nd
. The image ratings of both candidates are similar, with 53% of all
respondents having a favorable opinion of Steve Daines, 33% having an
unfavorable opinion of him and 10% having no opinion of him. John Walsh’s
image rating stands at 47% favorable, 29% unfavorable and 17% of respondents do
not have an opinion of him. When reviewing the results by major voting subgroup,
we find Steve Daines leading among men by 18 points, 52% to 34%, and by 9
points, 46% to 37% among women. Among self-identified independents, Steve
Daines leads by 15 points, 43% to 28%.
“If the election for the United States Senate were being held today, for whom would you
vote if the candidates were John Walsh, Democrat, Steve Daines Republican, Roger Roots,
Libertarian, or some other candidate?”
Results by Gender, Marital Status and Party Identification*
All
All
Men
Mar.
Men
Sing.
Men
All
Wom
Mar.
Wom
Sing.
Wom Dems Reps Ind 65+
Daines Net +13 +18 +21 +9 +9 +13 -4 -72 +75 +15 +8
Total Daines 49% 52% 54% 46% 46% 49% 36% 10% 84% 43% 47%
Def Daines 37% 41% 43% 36% 33% 36% 25% 4% 68% 31% 38%
Prob Daines 12% 11% 11% 10% 13% 13% 11% 6% 16% 12% 9%
Total Walsh 36% 34% 33% 37% 37% 36% 40% 82% 9% 28% 39%
Def Walsh 27% 28% 27% 30% 27% 27% 28% 66% 7% 20% 30%
Prob Walsh 9% 6% 6% 7% 10% 9% 12% 16% 2% 8% 9%
Total Roots 4% 6% 6% 9% 3% 2% 5% 1% 1% 10% 2%
Other Can. 5% 4% 4% 4% 5% 5% 5% 3% 2% 8% 5%
Undec/No Op. 6% 4% 3% 4% 10% 8% 14% 4% 4% 11% 7%
*Some numbers shown were rounded to the nearest whole number.
2. Magellan Strategies Montana 2014 US Senate General Election Survey Release
April 10, 2014, 2,490n MoE +/- 1.96%
Magellan Strategies | 1685 Boxelder Street, Suite 300 | Louisville, CO 80027
MagellanStrategies.com | 303-861-8585
Voter Mood
The voter mood about the direction of the country among Montana voters mirrors
many national surveys, with only 30% thinking the country is headed in the right
direction and 64% feeling that things are off on the wrong track. Among major
voter subgroups, only among self-identified Democrats do a majority of 66% think
things in the country are headed in the right direction. Among independent voters,
68% feel things in the country are off on the wrong track, as do 90% of Republican
voters.
Congressional Generic Ballot
Looking at the results of the Congressional generic ballot test, the generic
Republican candidate leads the Democrat candidate by 13 points, 50% to 37%.
Among male voters the Republican candidate leads by 18 points, 52% to 34%.
Among female voters the Democrat candidate trails the Republican candidate by 7
points, 40% to 47% respectively. These numbers should be alarming to Democrat
candidates because women, and single women in particular, are a significant part
of the Democratic base. Among the all important independent voter subgroup, we
find the Republican candidate leading the Democrat candidate by 12 points, 42%
to 30%.
“If the election for Congress were being held today, would you vote for the Democrat
candidate or the Republican candidate?”
Results by Gender, Marital Status and Party Identification*
All
All
Men
Mar.
Men
Sing.
Men
All
Wom
Mar.
Wom
Sing.
Wom Dem Rep Ind 65+
Rep Net +13 +18 +22 +7 +7 +12 -7 -78 +84 +12 +6
Rep. 50% 52% 54% 47% 47% 51% 36% 8% 90% 42% 48%
Dem. 37% 34% 32% 40% 40% 39% 43% 86% 6% 30% 42%
Other 5% 6% 6% 7% 5% 4% 7% 1% 1% 13% 5%
Undec/DK 8% 8% 8% 6% 8% 6% 14% 5% 3% 15% 5%
*Some numbers shown were rounded to the nearest whole number.
Summary
Although it is very early in the 2014 campaign cycle, Steve Daines is starting out
with a 13 point lead over John Walsh and is in a good position among key voter
subgroups. In Montana, the environment is far from ideal for a national Democrat
candidate, and as John Walsh begins introducing himself and making his case to
voters, we will see if he is able to gain traction later this year. The survey topline
and crosstab results are included in this document. This full crosstabs and release
can be downloaded from the Magellan Strategies Slideshare page at
www.Slideshare.net or http://ow.ly/vEiMf .
3. Magellan Strategies Montana 2014 US Senate General Election Survey Release
April 10, 2014, 2,490n MoE +/- 1.96%
Magellan Strategies | 1685 Boxelder Street, Suite 300 | Louisville, CO 80027
MagellanStrategies.com | 303-861-8585
Survey Methodology
The results were based on a statewide automated voice recorded interview survey
of 2,490 likely 2014 Montana general election voters. The interviews were
conducted on April 1st
and 2nd
of 2014. The individuals interviewed for the survey
were selected from a Montana voter file and were selected proportionate to the
state’s likely non-Presidential voting population in accordance with a probability
sample design that gives all voters an equal chance to be included. The results
were slightly weighted to reflect past gender and age demographics of the non-
Presidential voting population. The survey’s margin of error is +/- 1.96% at the 95
percent confidence interval. Any questions regarding this survey should be directed
to David Flaherty of Magellan Strategies at dflaherty@magellanstrategies.com or
303-861-8585.
Survey Commissioned By:
The individuals that commissioned this survey wish to remain anonymous.
About Magellan Strategies
Magellan Strategies is a full-service survey research firm offering quantitative,
qualitative, and predictive data analytic services to Republican candidates and
conservative organizations across the country. Any questions regarding this survey
research should be directed to David Flaherty at 303-861-8585 or
dflaherty@magellanstrategies.com.
4. Montana US Senate 2014 Survey Topline Results
Magellan Strategies are pleased to present the topline results for a 2,490n
automated voice recorded survey of likely general election voters in the state
of Montana. The interviews were conducted April 1st
and 2nd
, 2014. This
survey has a margin of error of +/- 1.96% at the 95 percent confidence
interval. This survey was weighted based upon past general election
demographics.
T1. Are you registered to vote?
Yes........................................................................100%
T2. How likely are you to vote in the November general election for the United States
Senate?
Extremely likely.......................................................93%
Very likely.................................................................5%
Somewhat likely........................................................2%
T3. Generally speaking, do you think things in the country are headed in the right
direction or do you feel that things are off on the wrong track?
Right direction ........................................................30%
Wrong track............................................................64%
Unsure or no opinion................................................6%
T4. If the election for Congress were being held today would you vote for the Democrat
candidate or the Republican candidate?
Republican candidate .............................................50%
Democrat candidate................................................37%
Some other candidate ...............................................5%
Undecided................................................................7%
No opinion ...............................................................1%
5. Magellan ID#: MTSEN-040114 Montana US Senate General Election Survey Topline Results
Field Dates: 4/1/14 – 4/2/14, MoE +/- 1.96%, 2,490n
Magellan Strategies | 1685 Boxelder St. Suite 300 | Louisville, CO 80027
www.MagellanStrategies.com | (303) 861-8585
2
Now I’m going to read to you the names of some people involved in politics. After
hearing the name please tell me if you have a favorable or unfavorable opinion of that
person. If you don’t know the name of the person or organization, there is an option for
that as well. Let’s get started…
T5. The first name is John Walsh
Total Favorable .......................................................47%
Total Unfavorable ...................................................29%
No opinion of him ..................................................17%
Very favorable.........................................................24%
Somewhat favorable................................................23%
Very unfavorable.....................................................13%
Somewhat unfavorable............................................16%
Never heard of..........................................................7%
Unsure......................................................................0%
T6. The next person is Steve Daines.
Total Favorable .......................................................53%
Total Unfavorable ...................................................33%
No opinion of him ..................................................10%
Very favorable.........................................................34%
Somewhat favorable................................................19%
Very unfavorable.....................................................19%
Somewhat unfavorable............................................14%
Never heard of..........................................................3%
Unsure......................................................................1%
6. Magellan ID#: MTSEN-040114 Montana US Senate General Election Survey Topline Results
Field Dates: 4/1/14 – 4/2/14, MoE +/- 1.96%, 2,490n
Magellan Strategies | 1685 Boxelder St. Suite 300 | Louisville, CO 80027
www.MagellanStrategies.com | (303) 861-8585
3
T7. If the election for the United States Senate were being held today for whom would
you vote if the candidates were John Walsh, Democrat, Steve Daines, Republican, Roger
Roots, Libertarian or some other candidate?
Steve Daines ...........................................................49%
John Walsh .............................................................36%
Roger Roots...............................................................4%
Some other candidate ...............................................5%
Undecided................................................................6%
Definitely Steve Daines...........................................37%
Probably Steve Daines ............................................12%
Definitely John Walsh .............................................28%
Probably John Walsh.................................................8%
T8. Do you consider yourself to be very conservative, conservative, moderate or liberal
when it comes to fiscal issues like taxes and government spending?
Very conservative....................................................31%
Conservative ...........................................................30%
Moderate ................................................................31%
Liberal.......................................................................7%
Unsure or no opinion................................................1%
T9. Do you consider yourself to be very conservative, conservative, moderate or liberal
when it comes to social issues like abortion and gay marriage?
Very conservative....................................................31%
Conservative ...........................................................19%
Moderate ................................................................25%
Liberal.....................................................................23%
Unsure or no opinion................................................2%
7. Magellan ID#: MTSEN-040114 Montana US Senate General Election Survey Topline Results
Field Dates: 4/1/14 – 4/2/14, MoE +/- 1.96%, 2,490n
Magellan Strategies | 1685 Boxelder St. Suite 300 | Louisville, CO 80027
www.MagellanStrategies.com | (303) 861-8585
4
T10. Generally speaking, do you think of yourself as a Republican, a Democrat or
something else?
Total Republican.....................................................35%
Total Democrat.......................................................27%
Something else........................................................38%
Strong Republican...................................................24%
Not so strong Republican........................................11%
Strong Democrat.....................................................18%
Not so strong Democrat ............................................9%
T11. For statistical purposes, are you a man or a woman?
Female....................................................................52%
Male .......................................................................48%
T12. Which of the following age groups applies to you?
18-29......................................................................10%
30-44......................................................................20%
45-54......................................................................17%
55-64......................................................................23%
65+.........................................................................30%
Unsure or no opinion................................................0%
T13. What is your marital status?
Married...................................................................72%
Widowed..................................................................9%
Separated..................................................................1%
Divorced...................................................................7%
Single and have never been married .........................8%
Unmarried and living with a partner .........................2%
Unsure or no opinion................................................1%
Survey Methodology
The results were based on a statewide automated voice recorded survey of 2,490 likely
2014 Montana general election voters. The interviews were conducted on April 1st
and
2nd
of 2014. The individuals interviewed for the survey were selected from a Montana
voter file and were selected proportionate to the state’s likely non-Presidential voting
population in accordance with a probability sample design that gives all voters an equal
chance to be included. The results were slightly weighted to reflect past gender and age
8. Magellan ID#: MTSEN-040114 Montana US Senate General Election Survey Topline Results
Field Dates: 4/1/14 – 4/2/14, MoE +/- 1.96%, 2,490n
Magellan Strategies | 1685 Boxelder St. Suite 300 | Louisville, CO 80027
www.MagellanStrategies.com | (303) 861-8585
5
demographics of the non-Presidential voting population. The survey’s margin of error is
+/- 1.96% at the 95 percent confidence interval. Any questions regarding this survey
should be directed to David Flaherty of Magellan Strategies at
dflaherty@magellanstrategies.com or 303-861-8585.