Download to read offline


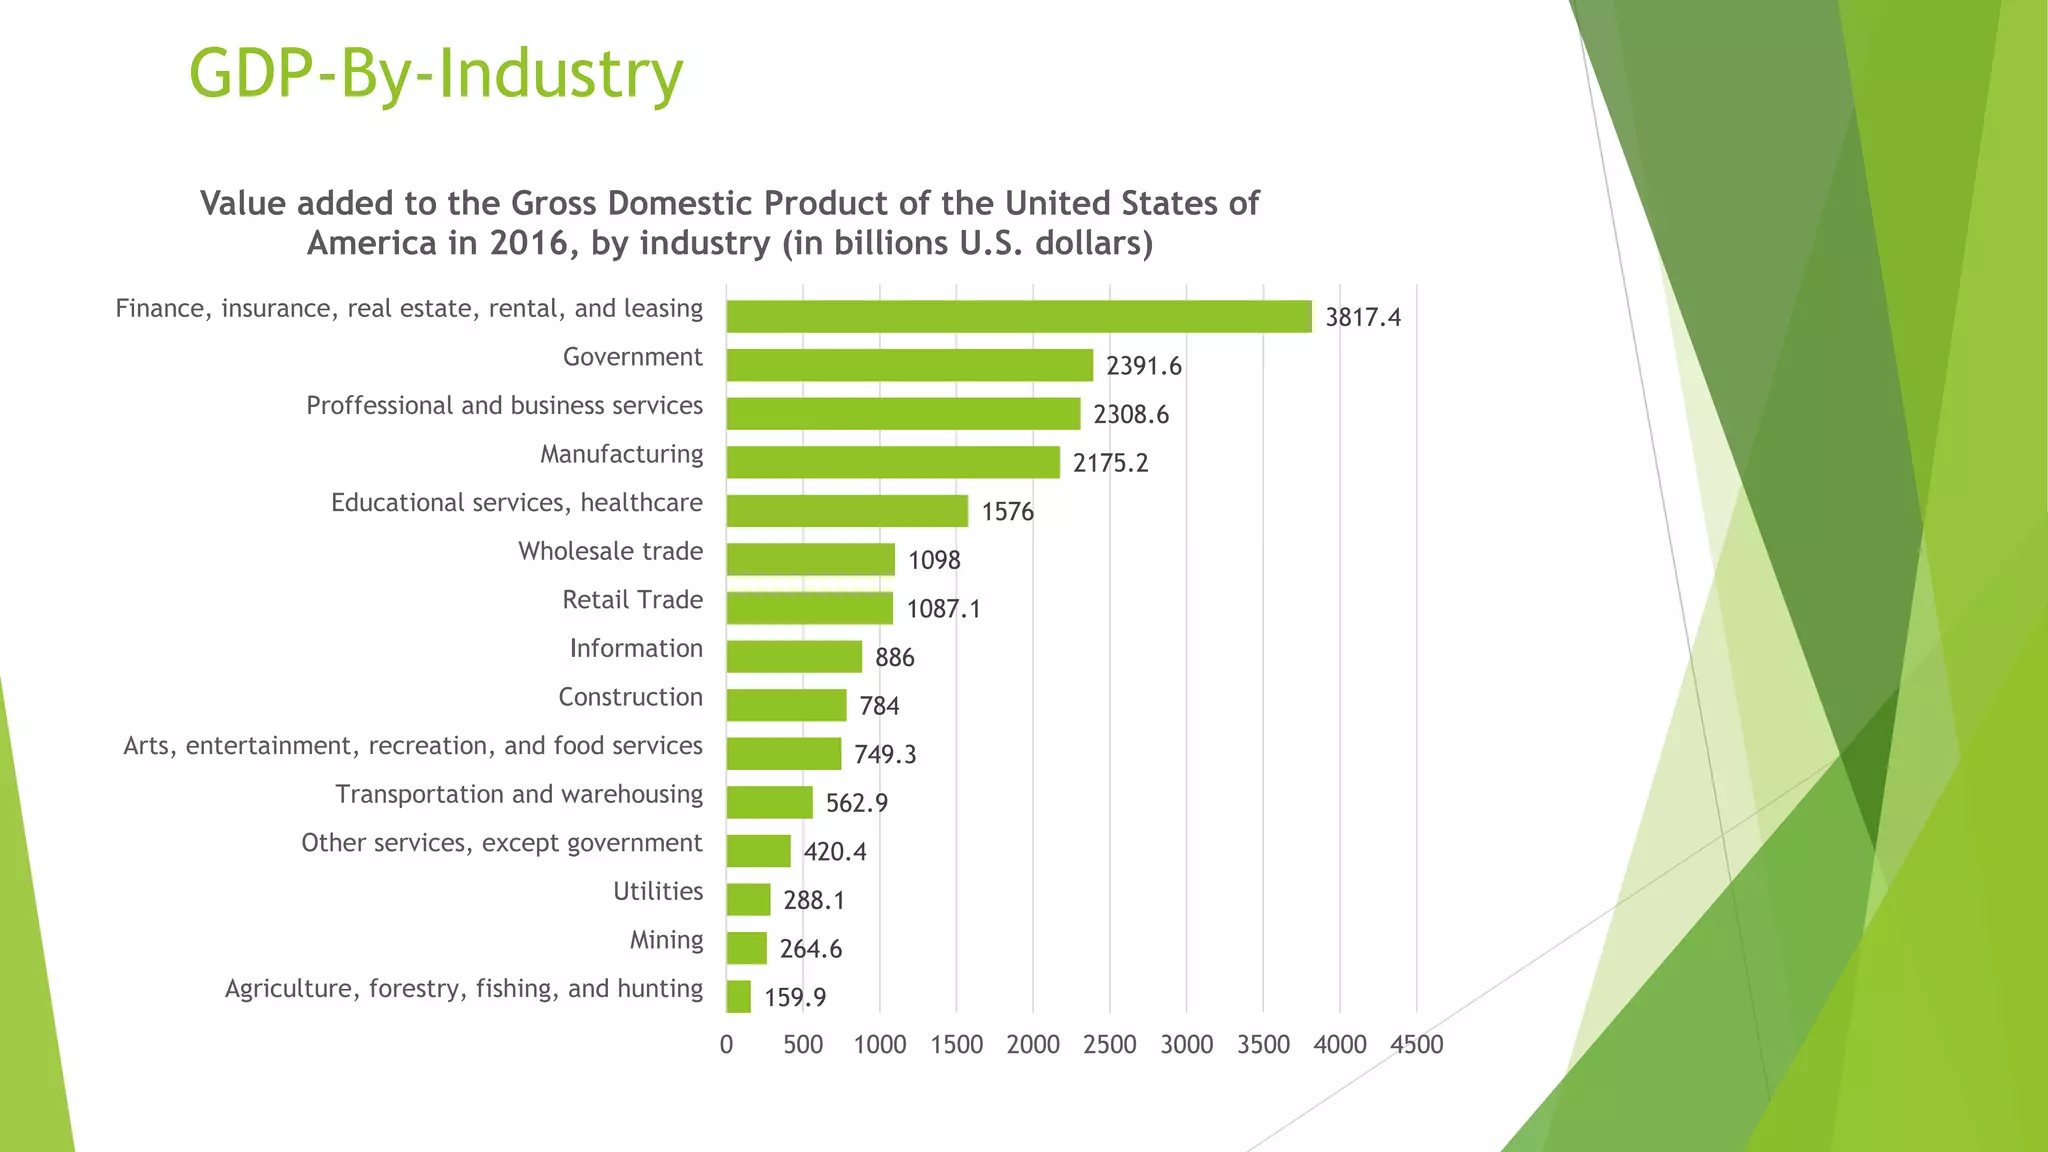
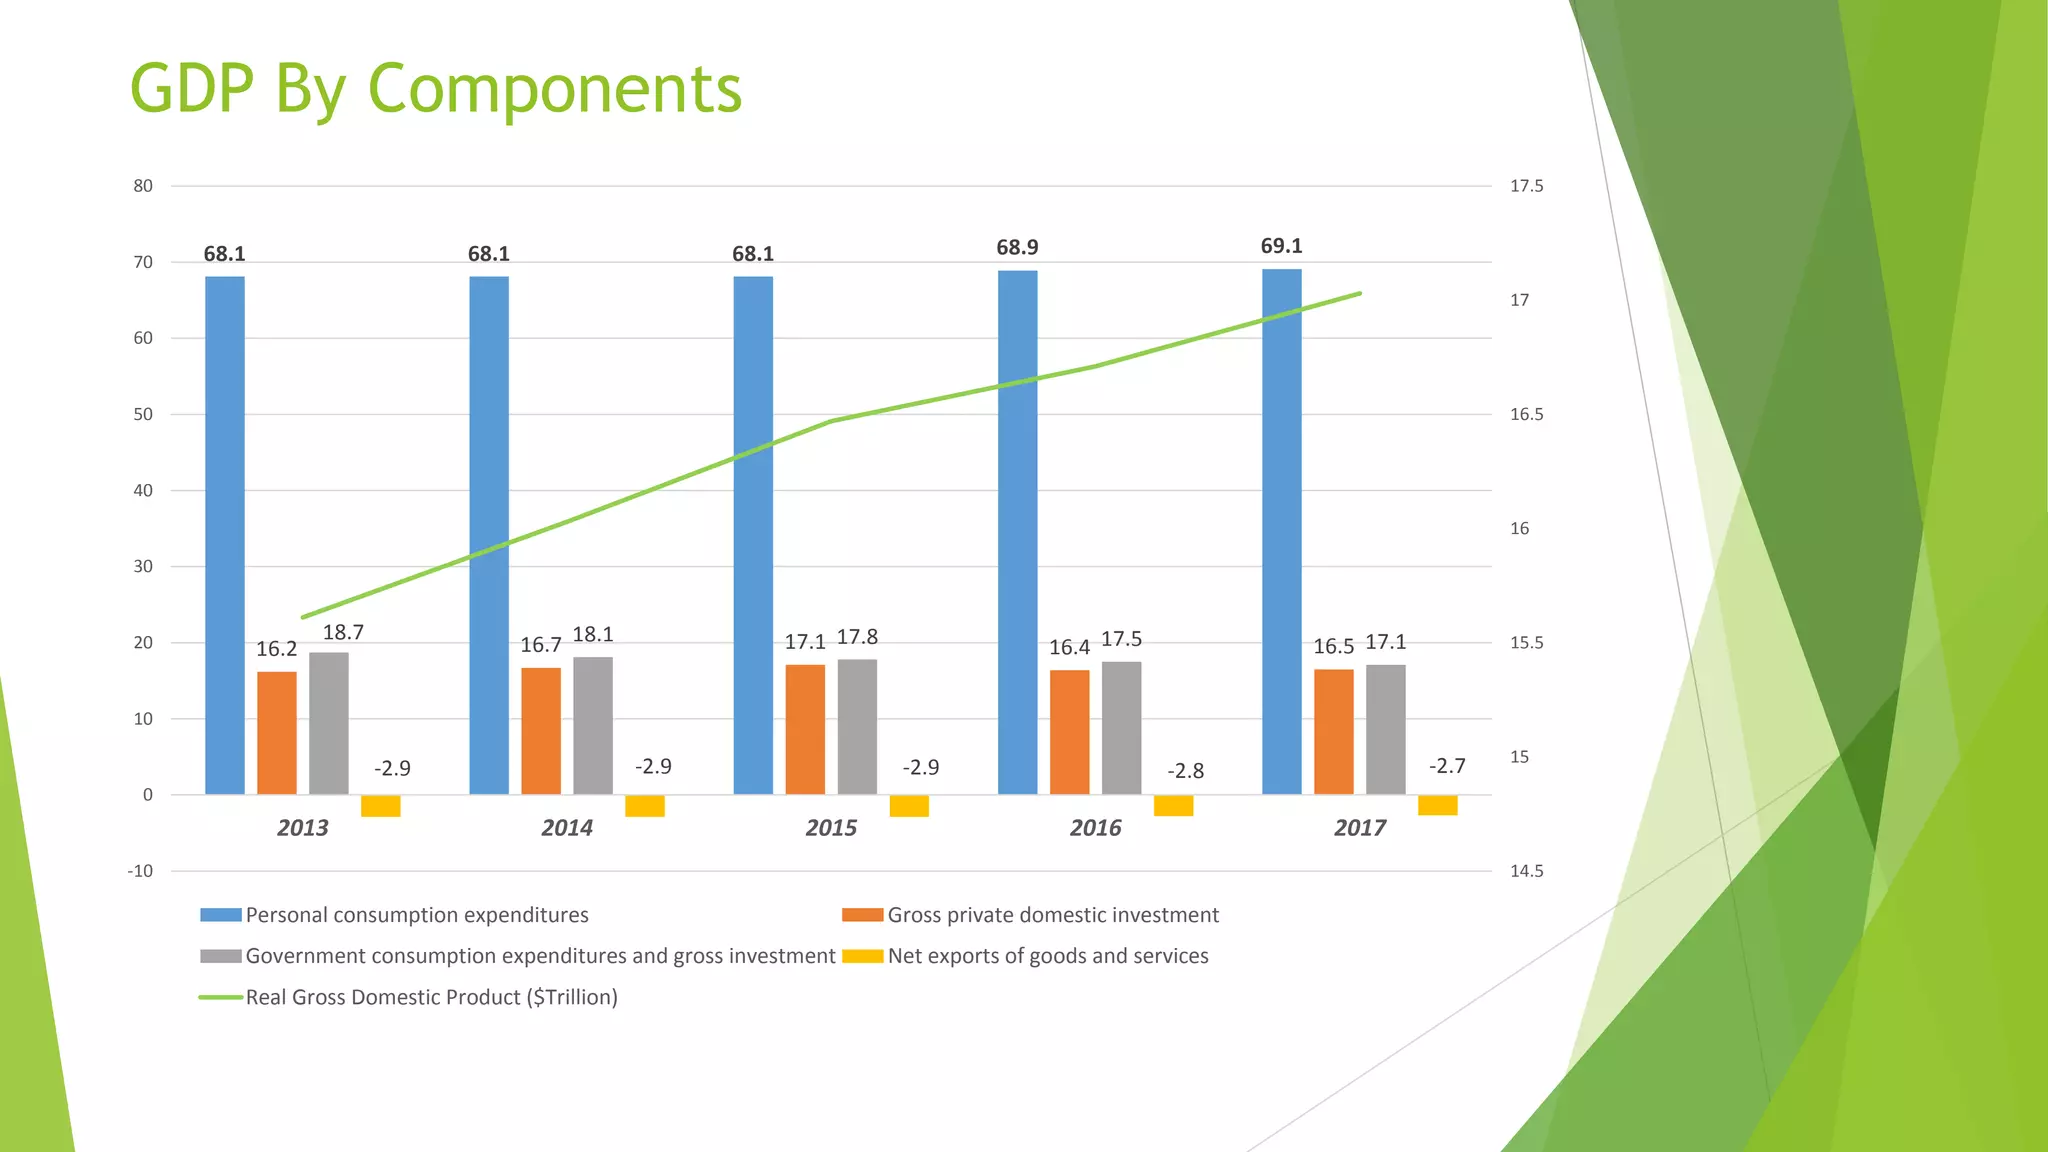


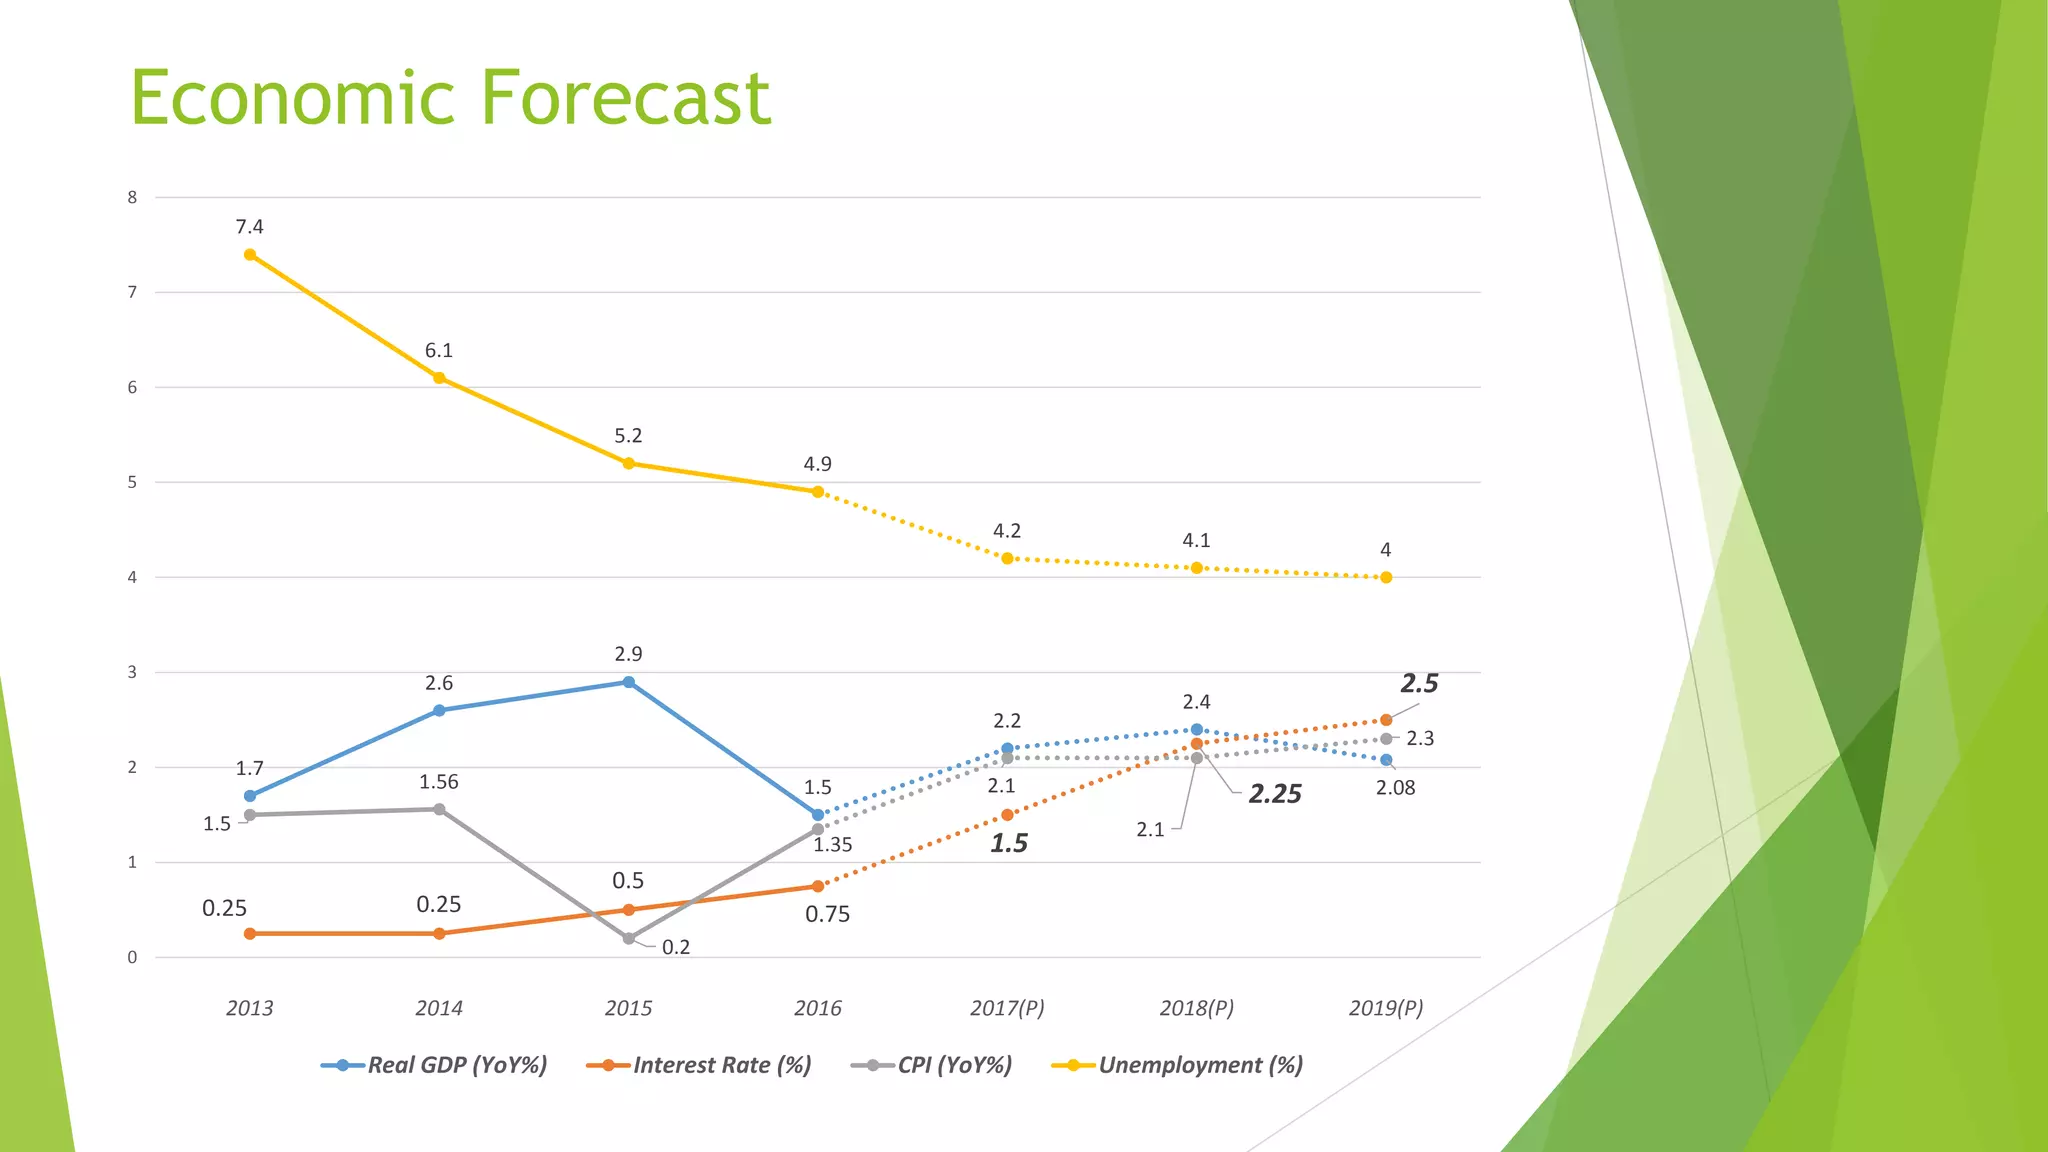


This document provides an overview of the US macroeconomy in 2016-2017. It includes breakdowns of GDP by sector and industry in 2016, components of GDP from 2013-2017, economic indicators from 2012-2016 including consumption, investment, exports, imports and debt levels, the economic calendar, and a forecast for real GDP growth, interest rates, inflation and unemployment from 2017-2019. Services contributed the largest share at 80.2% of GDP, followed by industry at 18.9% and agriculture at 0.9%. Finance, insurance, real estate and leasing represented the largest industry at $3,817.4 billion.


