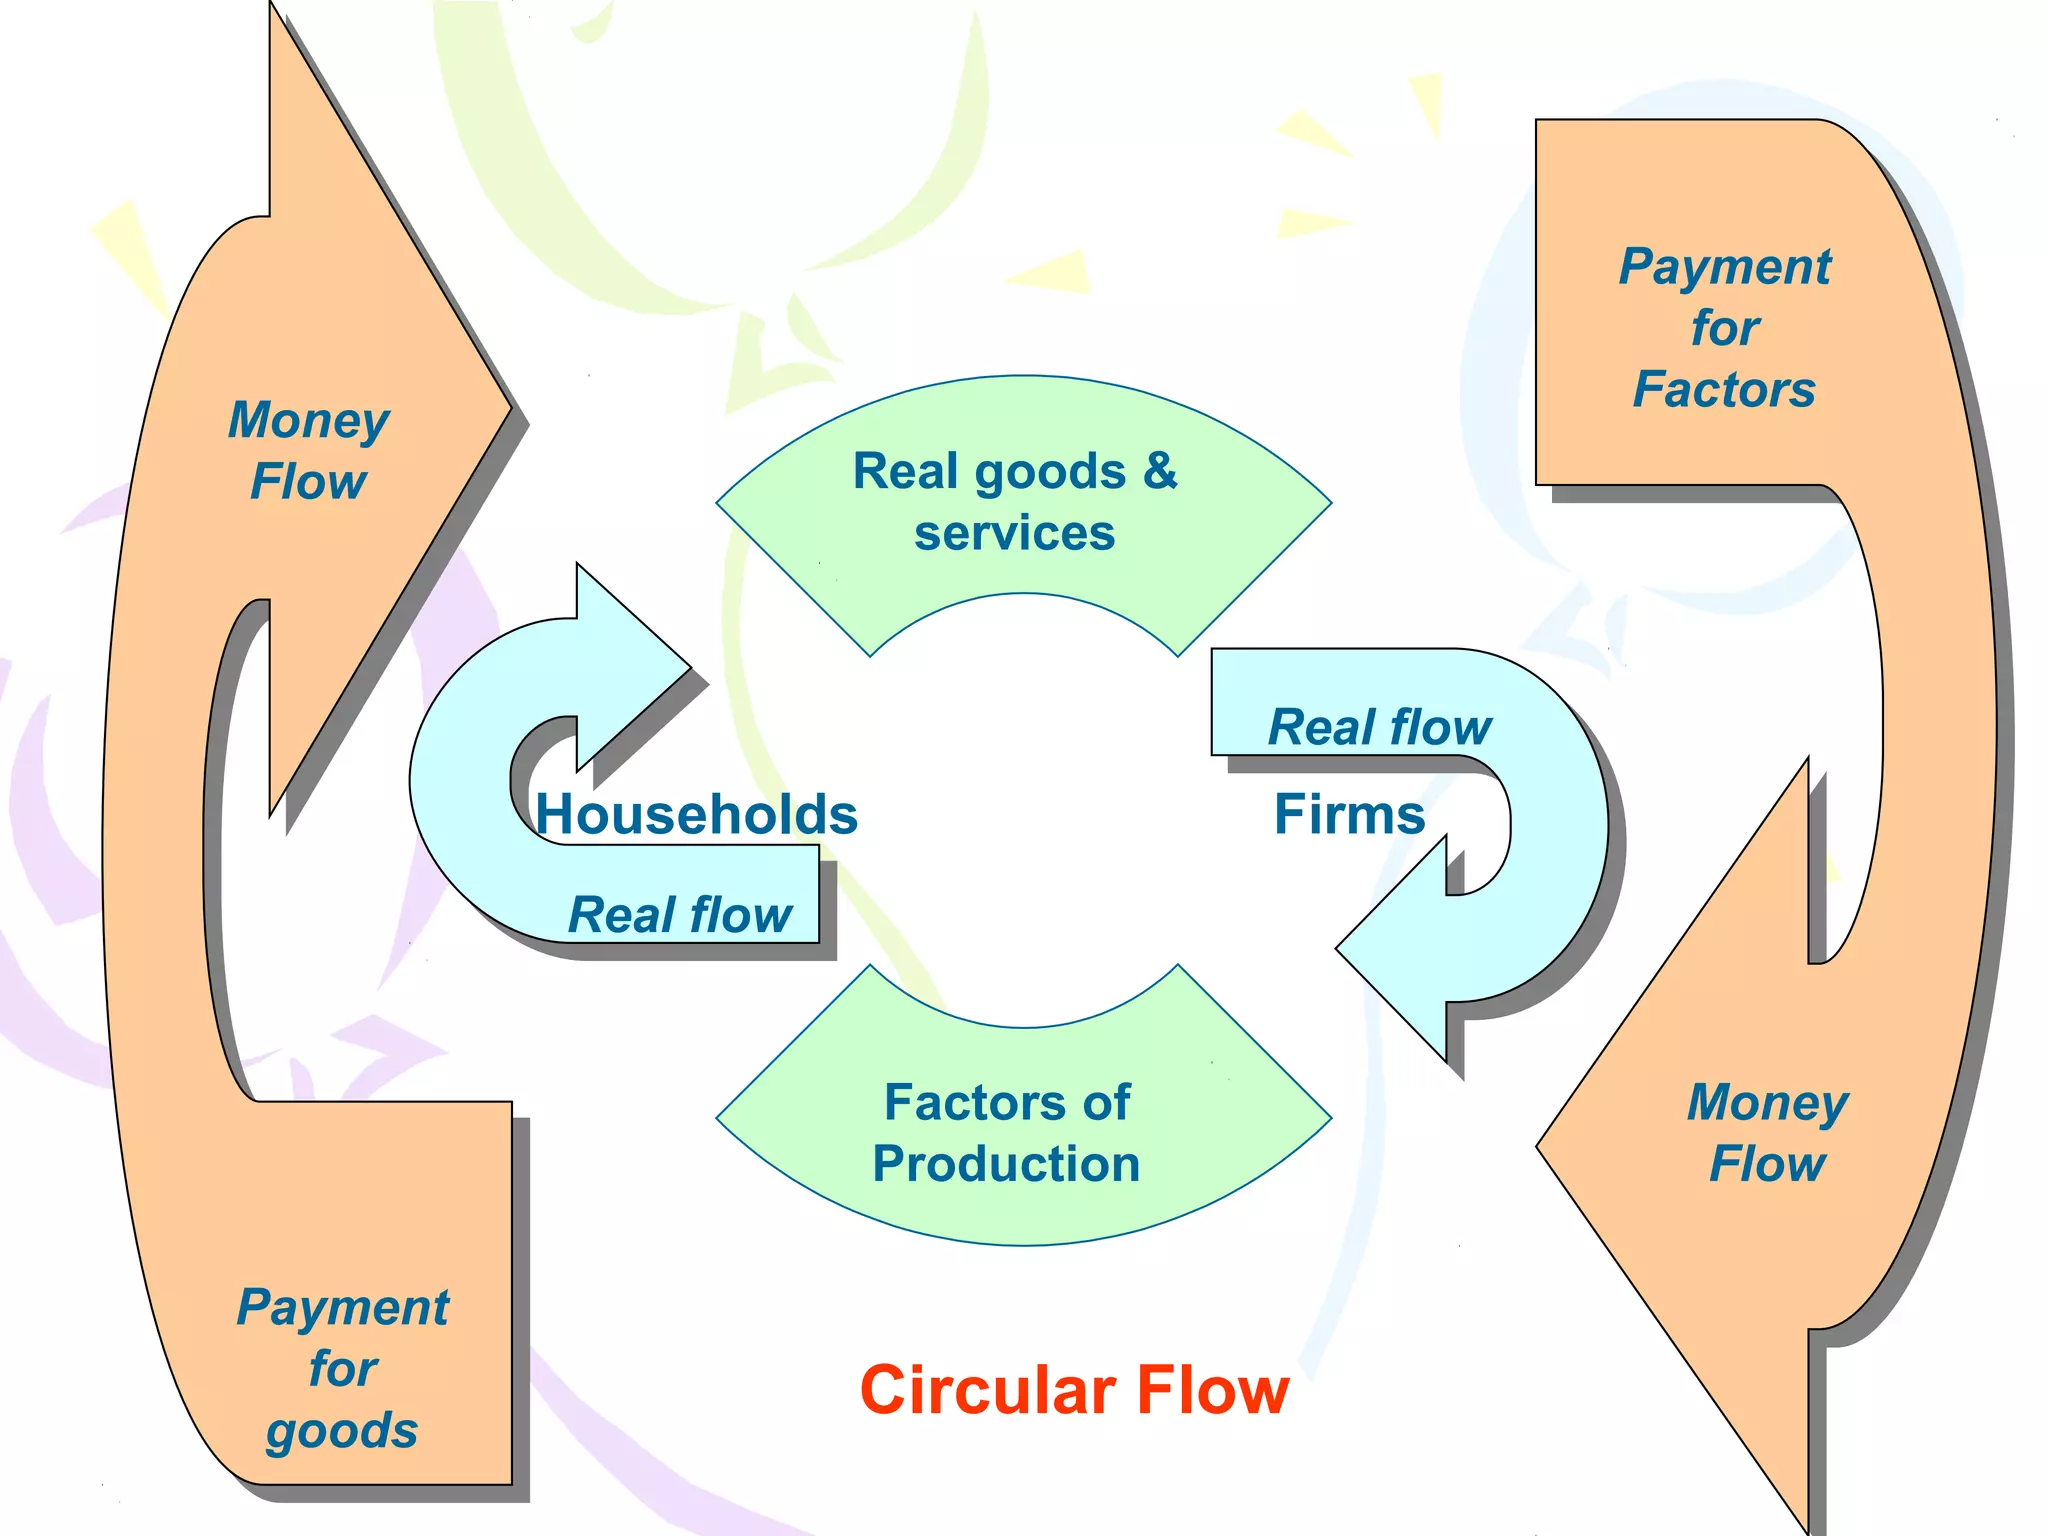
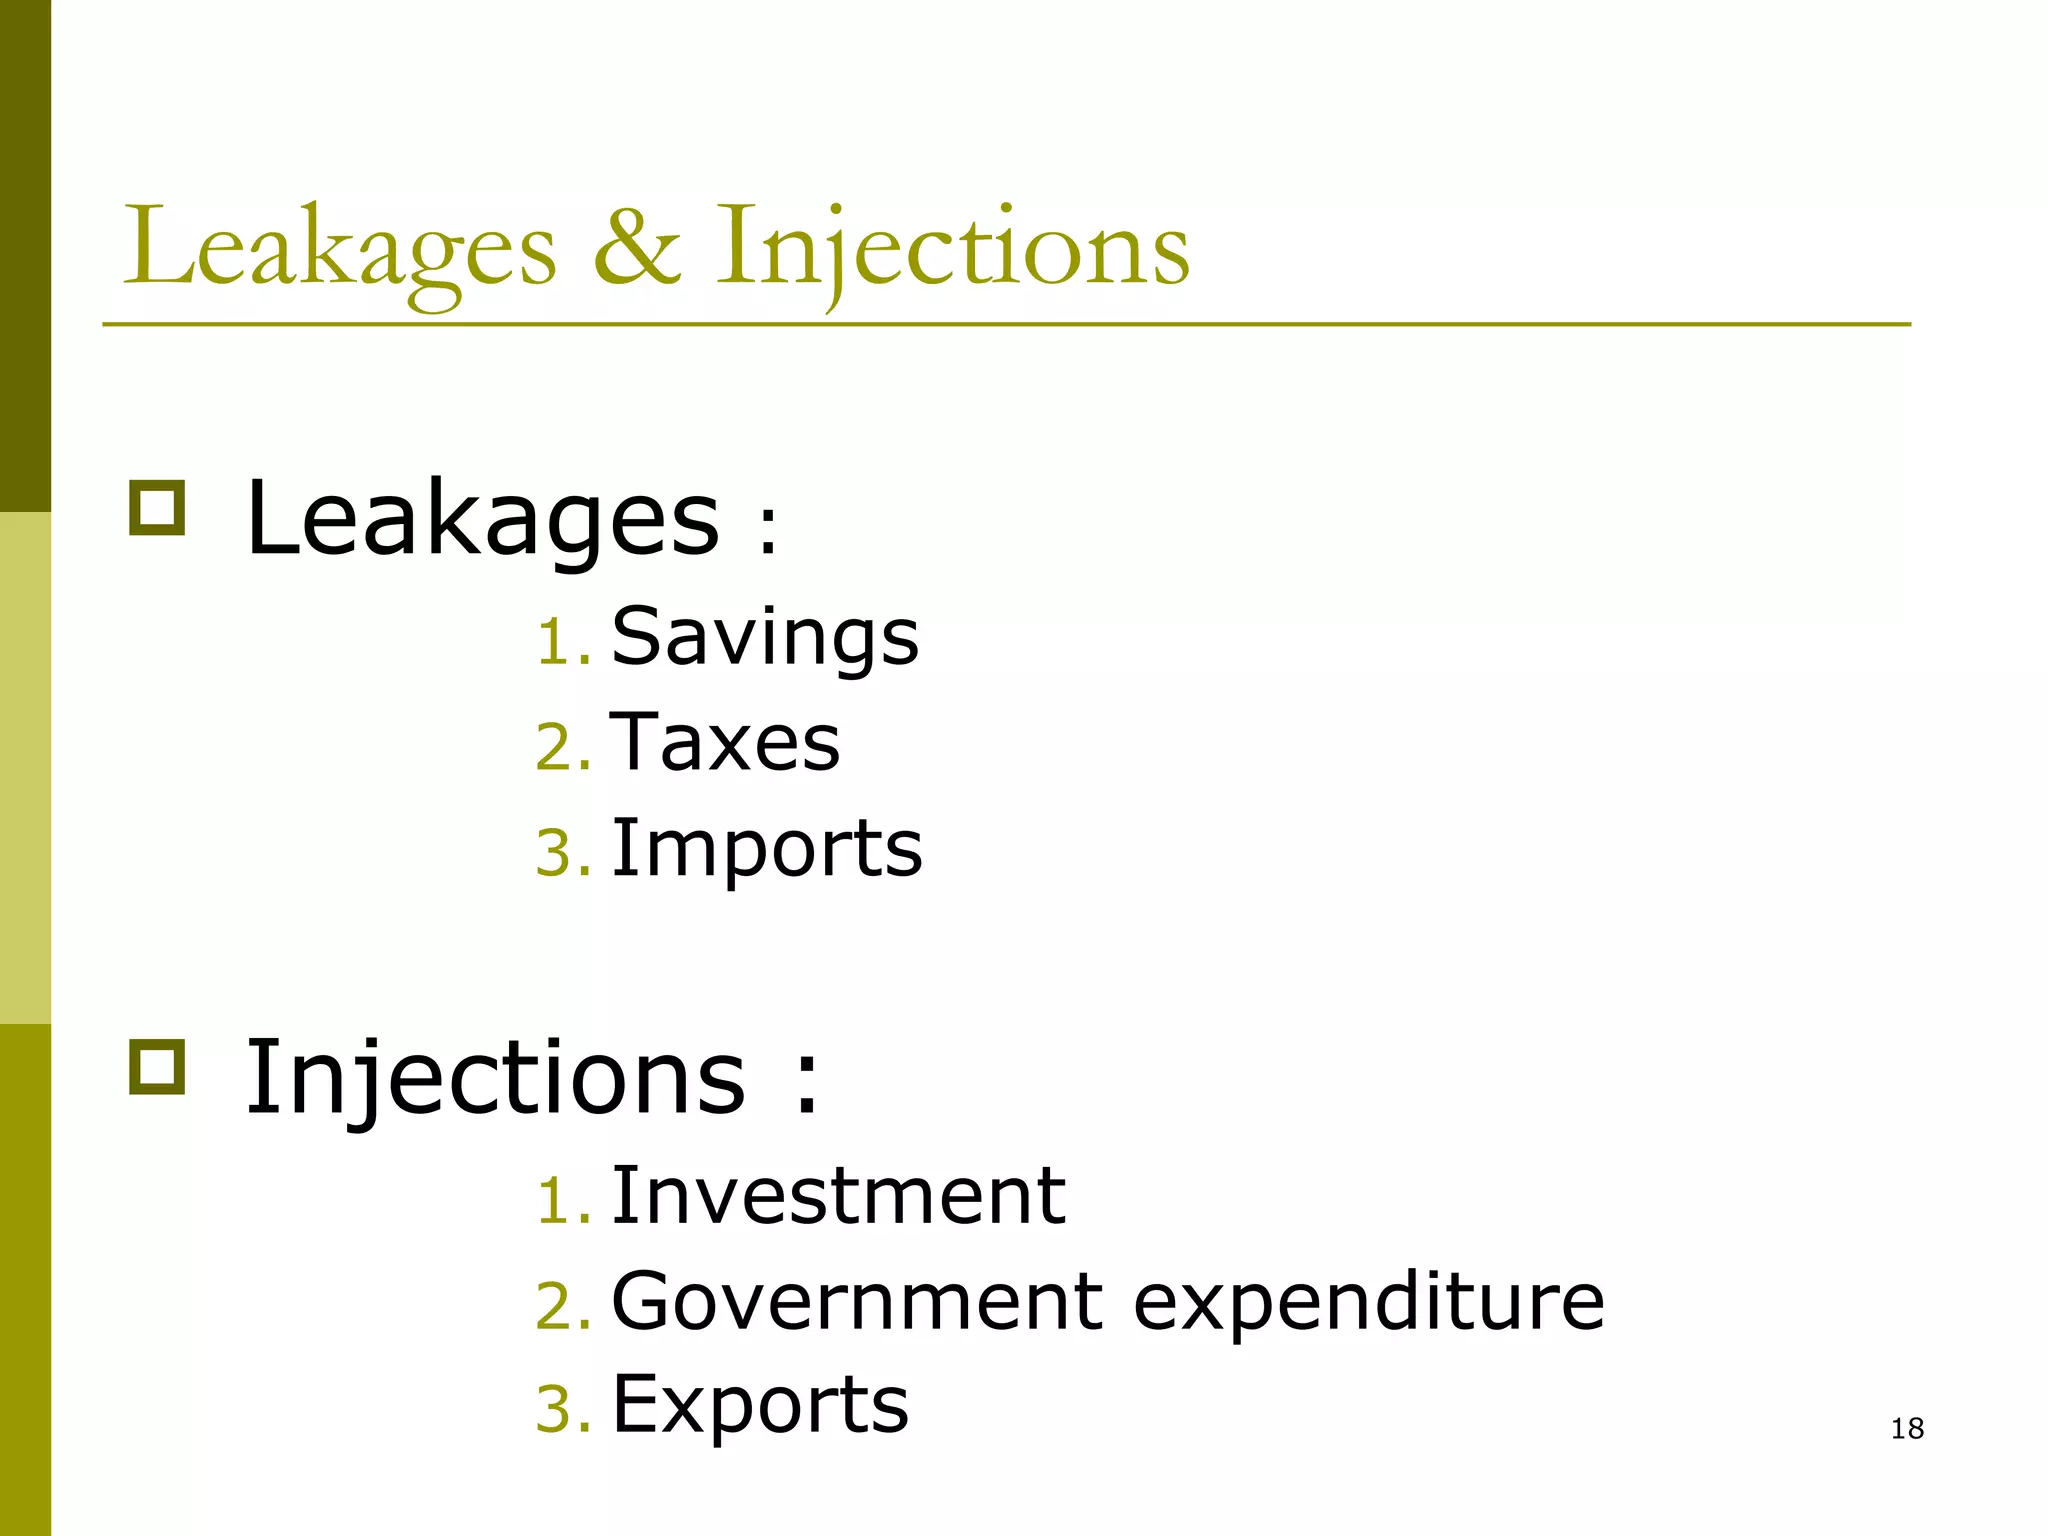
Macro-Economic
Framework
Prof. Swaha Shome
Mumbai
Outline (1)


Measurement & Determination of National
Income : Identify appropriate Macroeconomic concepts



Growth, Unemployment, Trade cycles &
Inflation



Performance Indicators – significance
2
Outline (2)
Elements of Monetary & Fiscal System
 Implications of Monetary & Fiscal Policy




Patterns of international trade & trade
policy, regional trading blocks,
globalization of production



Balance of Payments, Foreign Exchange
Markets & European Monetary Union
3
Stock vs. Flow variables (1)


Stock variables : Accumulation of flows
•
•



No time dimension
Change in stock – discontinuous

Flow variables : Changes in stocks
•
•

change over time : time dimension
rate of change at some point of time

4
Stock vs. Flow variables (2)
Stock

Flow

Capital

Investment

Wealth

Income

Price Index

Inflation

Balance Sheet

Profit/Loss account

Forex Reserves

Exports/wages/taxes

Unemployment level

GDP
5
Macro-economic variables
 Price
 GDP
 Unemployment
 Forex

rate

Reserves
6
Macro-economic targets


Price stability



Adequate growth



Minimum unemployment



Stable Foreign exchange rate
7
Opportunity cost
Opp cost of X =
Amount of Y to be
compensated for
one more unit of X

•

Opp cost of X
increases as you
produce more of X

X

Y

1

0

20

2

1

18

3

2

15

4

•

Situation

3

11

5

4

6

6

5

0

8
Opportunity Cost - Illustrated


Sacrifice of alternatives in
production/consumption of a good



Eg. Let a farm produce 1000 tonnes of
wheat or 2000 tonnes of sugar
Opportunity Cost of producing 1 ton wheat
= 2 tonnes of sugar foregone.

9
Production Possibility Curve
Enclosed region – unemployment

6

Outside graph – not feasible
5

Y

4

3

2

1

0
0

1

2

3

4

5

6

X

Various combinations of 2 classes of goods
produced provided resources in the economy are
fully employed

10
PPF – Illustrated
Units of Food
8

Clothing

10

Food

5

4
5

4

5

0

2.2

6

8
7
6
5
4
3
2
1
0

0

7

PPF

Units of Clothing

5.6

3

6

2

6.4

1

6.7

0

7
11
Properties of a PPC
•

Downward sloping

•

Concave to origin

•

Resources have alternative uses but not
equally efficient in all
12
Production Possibility Frontier
Curve shows all possible 2-goods
combination that an economy can produce
- Specified time period
- Resources fully & efficiently employed
- Issues of choice & opportunity cost
 Concave to origin – increasing opportunity
cost
 Region interior to PPF – economy has not
attained Productive Efficiency unemployment


13
Production Possibility Frontier Shifting
PPF Shift
8

7

6

Y

5

4

3

2

1

0
0

1

2

3

4

X

5

6

7

8

Economic Growth

Improvement in skills

Improved Technology

Increase in factors of production

14
Luxuries

Economic grow th shifting PPF

Necessities
Poor Nation

High Income nation

Poor nation devotes resources mostly to food
Rich nation : expansion in food consumption low compared to
increased consumption of luxuries

15
Capital Investment

Before Investment

Countries that invest
heavily have higher
investment and
consumption in future
Current consumption

Countries
that invest
more heavily
forge ahead

Capital Investment

After Investment

Future Consumption
Country I

Country II

Country III

16
Payment
for
Factors

Money
Money
Money
Flow
Flow
Flow

Real goods &
services

Real flow

Households

Firms

Real flow

Factors of
Production
Payment
for
goods

Circular Flow

Money
Flow
Leakages & Injections


Leakages :
1. Savings
2. Taxes
3. Imports



Injections :
1. Investment
2. Government
3. Exports

expenditure
18

Macro economic+framework

  • 1.
  • 2.
    Outline (1)  Measurement &Determination of National Income : Identify appropriate Macroeconomic concepts  Growth, Unemployment, Trade cycles & Inflation  Performance Indicators – significance 2
  • 3.
    Outline (2) Elements ofMonetary & Fiscal System  Implications of Monetary & Fiscal Policy   Patterns of international trade & trade policy, regional trading blocks, globalization of production  Balance of Payments, Foreign Exchange Markets & European Monetary Union 3
  • 4.
    Stock vs. Flowvariables (1)  Stock variables : Accumulation of flows • •  No time dimension Change in stock – discontinuous Flow variables : Changes in stocks • • change over time : time dimension rate of change at some point of time 4
  • 5.
    Stock vs. Flowvariables (2) Stock Flow Capital Investment Wealth Income Price Index Inflation Balance Sheet Profit/Loss account Forex Reserves Exports/wages/taxes Unemployment level GDP 5
  • 6.
    Macro-economic variables  Price GDP  Unemployment  Forex rate Reserves 6
  • 7.
    Macro-economic targets  Price stability  Adequategrowth  Minimum unemployment  Stable Foreign exchange rate 7
  • 8.
    Opportunity cost Opp costof X = Amount of Y to be compensated for one more unit of X • Opp cost of X increases as you produce more of X X Y 1 0 20 2 1 18 3 2 15 4 • Situation 3 11 5 4 6 6 5 0 8
  • 9.
    Opportunity Cost -Illustrated  Sacrifice of alternatives in production/consumption of a good  Eg. Let a farm produce 1000 tonnes of wheat or 2000 tonnes of sugar Opportunity Cost of producing 1 ton wheat = 2 tonnes of sugar foregone. 9
  • 10.
    Production Possibility Curve Enclosedregion – unemployment 6 Outside graph – not feasible 5 Y 4 3 2 1 0 0 1 2 3 4 5 6 X Various combinations of 2 classes of goods produced provided resources in the economy are fully employed 10
  • 11.
    PPF – Illustrated Unitsof Food 8 Clothing 10 Food 5 4 5 4 5 0 2.2 6 8 7 6 5 4 3 2 1 0 0 7 PPF Units of Clothing 5.6 3 6 2 6.4 1 6.7 0 7 11
  • 12.
    Properties of aPPC • Downward sloping • Concave to origin • Resources have alternative uses but not equally efficient in all 12
  • 13.
    Production Possibility Frontier Curveshows all possible 2-goods combination that an economy can produce - Specified time period - Resources fully & efficiently employed - Issues of choice & opportunity cost  Concave to origin – increasing opportunity cost  Region interior to PPF – economy has not attained Productive Efficiency unemployment  13
  • 14.
    Production Possibility FrontierShifting PPF Shift 8 7 6 Y 5 4 3 2 1 0 0 1 2 3 4 X 5 6 7 8 Economic Growth Improvement in skills Improved Technology Increase in factors of production 14
  • 15.
    Luxuries Economic grow thshifting PPF Necessities Poor Nation High Income nation Poor nation devotes resources mostly to food Rich nation : expansion in food consumption low compared to increased consumption of luxuries 15
  • 16.
    Capital Investment Before Investment Countriesthat invest heavily have higher investment and consumption in future Current consumption Countries that invest more heavily forge ahead Capital Investment After Investment Future Consumption Country I Country II Country III 16
  • 17.
    Payment for Factors Money Money Money Flow Flow Flow Real goods & services Realflow Households Firms Real flow Factors of Production Payment for goods Circular Flow Money Flow
  • 18.
    Leakages & Injections  Leakages: 1. Savings 2. Taxes 3. Imports  Injections : 1. Investment 2. Government 3. Exports expenditure 18