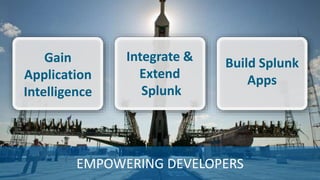
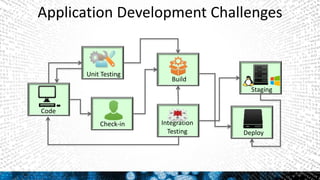
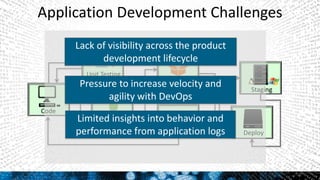
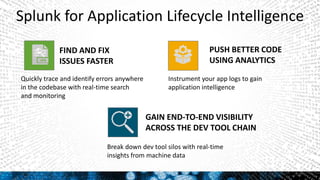
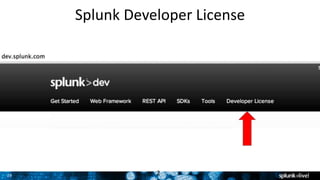
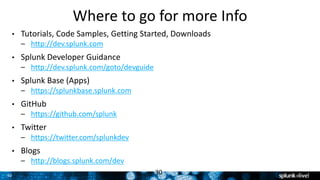
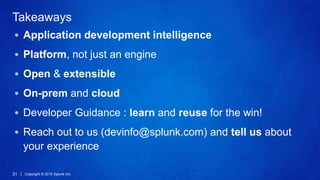
This document discusses Splunk for developers. It provides an overview of empowering developers with Splunk, building Splunk apps, and gaining application intelligence across the development lifecycle. Key points include instrumenting application logs for insights, integrating and extending Splunk, building unit testing and code integration, and gaining end-to-end visibility across development tools. The document also discusses resources for Splunk developers including tutorials, code samples, SDKs, and developer licenses.
Integrating Splunk into your Spring ApplicationsDamien Dallimore
How much visibility do you really have into your Spring applications? How effectively are you capturing,harnessing and correlating the logs, metrics, & messages from your Spring applications that can be used to deliver this visibility ? What tools and techniques are you providing your Spring developers with to better create and utilize this mass of machine data ? In this session I'll answer these questions and show how Splunk can be used to not only provide historical and realtime visibility into your Spring applications , but also as a platform that developers can use to become more "devops effective" & easily create custom big data integrations and standalone solutions.I'll discuss and demonstrate many of Splunk's Java apps,frameworks and SDK and also cover the Spring Integration Adaptors for Splunk.
Here’s your chance to get hands-on with Splunk for the first time! Bring your modern Mac, Windows, or Linux laptop and we’ll go through a simple install of Splunk. Then, we’ll load some sample data, and see Splunk in action – we’ll cover searching, pivot, reporting, alerting, and dashboard creation. At the end of this session you’ll have a hands-on understanding of the pieces that make up the Splunk Platform, how it works, and how it fits in the landscape of Big Data. You’ll experience practical examples that differentiate Splunk while demonstrating how to gain quick time to value.
Flink vs. Spark: this is the slide deck of my talk at the 2015 Flink Forward conference in Berlin, Germany, on October 12, 2015. In this talk, we tried to compare Apache Flink vs. Apache Spark with focus on real-time stream processing. Your feedback and comments are much appreciated.
Building Cloud-Native App Series - Part 3 of 11
Microservices Architecture Series
AWS Kinesis Data Streams
AWS Kinesis Firehose
AWS Kinesis Data Analytics
Apache Flink - Analytics
Splunk Data Onboarding Overview - Splunk Data Collection ArchitectureSplunk
Splunk's Naman Joshi and Jon Harris presented the Splunk Data Onboarding overview at SplunkLive! Sydney. This presentation covers:
1. Splunk Data Collection Architecture 2. Apps and Technology Add-ons
3. Demos / Examples
4. Best Practices
5. Resources and Q&A
Monitoring Kafka without instrumentation using eBPF with Antón Rodríguez | Ka...HostedbyConfluent
Imagine a world where you can access metrics, events, traces, and logs in seconds without changing code. Even more, a world where you can run scripts to debug metrics as code. In this session, you will learn about eBPF, a powerful technology with origins in the Linux kernel that holds the potential to fundamentally change how Networking, Observability, and Security are delivered.
We’ll see eBPF in action applied to the Kafka world: identify Kafka consumers, producers, and brokers, see how they interact with each other and how many resources they consume. We'll even learn how to measure consumer lag without external components. If you want to know what’s next in Kafka observability, this session is for you.
source : http://www.opennaru.com/cloud/msa/
마이크로서비스는 애플리케이션 구축을 위한 아키텍처 기반의 접근 방식입니다. 마이크로서비스를 전통적인 모놀리식(monolithic) 접근 방식과 구별 짓는 기준은 애플리케이션을 핵심 기능으로 세분화하는 방식입니다. 각 기능을 서비스라고 부르며, 독립적으로 구축하고 배포할 수 있습니다. 이는 개별 서비스가 다른 서비스에 부정적 영향을 주지 않으면서 작동(또는 장애가 발생)할 수 있음을 의미합니다.
Performance Troubleshooting Using Apache Spark MetricsDatabricks
Performance troubleshooting of distributed data processing systems is a complex task. Apache Spark comes to rescue with a large set of metrics and instrumentation that you can use to understand and improve the performance of your Spark-based applications. You will learn about the available metric-based instrumentation in Apache Spark: executor task metrics and the Dropwizard-based metrics system. The talk will cover how Hadoop and Spark service at CERN is using Apache Spark metrics for troubleshooting performance and measuring production workloads. Notably, the talk will cover how to deploy a performance dashboard for Spark workloads and will cover the use of sparkMeasure, a tool based on the Spark Listener interface. The speaker will discuss the lessons learned so far and what improvements you can expect in this area in Apache Spark 3.0.
AWS Partner Webcast - Use Your AWS CloudTrail Data and Splunk Software To Imp...Amazon Web Services
With AWS CloudTrail, you can get log files of AWS API calls for your account. CloudTrail enables you to perform security analysis, track resource changes, and aid in compliance reporting.
In this webinar you will learn how CloudTrail collects and stores your AWS log files so that software from AWS Technology Partner Splunk can be used as a Big Data Security Information and Event Management (SIEM) system. You will hear how AWS log files are made available for many security use cases, including incident investigations, security and compliance reporting, and threat detection/alerting. You will also hear from a joint Splunk/AWS customer, FINRA, who will explain how they leverage Splunk in AWS to support their cloud efforts.
What you'll learn:
• Why the machine data from AWS CloudTrail is relevant to security and compliance
• How to visualize data from AWS CloudTrail to monitor and audit security-related activity
• How AWS CloudTrail data can be combined with machine data from other sources in your IT infrastructure, including the OS and apps in your AWS images, for a wide range of operational and security use cases
• How the combination of AWS CloudTrail and Splunk Software improve your uptime, accelerate security and operational investigations, and simplify compliance.
What Is ELK Stack | ELK Tutorial For Beginners | Elasticsearch Kibana | ELK S...Edureka!
( ELK Stack Training - https://www.edureka.co/elk-stack-trai... )
This Edureka tutorial on What Is ELK Stack will help you in understanding the fundamentals of Elasticsearch, Logstash, and Kibana together and help you in building a strong foundation in ELK Stack. Below are the topics covered in this ELK tutorial for beginners:
1. Need for Log Analysis
2. Problems with Log Analysis
3. What is ELK Stack?
4. Features of ELK Stack
5. Companies Using ELK Stack
Splunk for Enterprise Security and User Behavior AnalyticsSplunk
This session will review Splunk’s two premium solutions for information security organizations: Splunk for Enterprise Security (ES) and Splunk User Behavior Analytics (UBA). Splunk ES is Splunk's award-winning security intelligence solution that brings immediate value for continuous monitoring across SOC and incident response environments – allowing you to quickly detect and respond to external and internal attacks, simplifying threat management while decreasing risk. Splunk UBA is a new technology that applies unsupervised machine learning and data science to solving one of the biggest problems in information security today: insider threat. You’ll learn how Splunk UBA works in tandem with ES, or third-party data sources, to bring significant automated analytical power to your SOC and Incident Response teams. We’ll discuss each solution and see them integrated and in action through detailed demos.
NGINX ADC: Basics and Best Practices – EMEANGINX, Inc.
In this webinar we help you get started with NGINX, industry’s most ubiquitous web server and API gateway. We cover best practices for installing, configuring, and troubleshooting both NGINX Open Source and the enterprise-grade NGINX Plus. We provide insights about using NGINX Controller to manage your NGINX Plus instances.
Watch this webinar to learn:
- How to create NGINX configurations for web server, load balancer, etc.
- About improving performance using keepalives and other NGINX directives
- How the NGINX Controller Load Balancing Module can manage NGINX Plus instances at scale
- About augmenting your existing ADC with NGINX
https://www.nginx.com/resources/webinars/nginx-adc-basics-best-practices-emea/
Mario Molina, Software Engineer
CDC systems are usually used to identify changes in data sources, capture and replicate those changes to other systems. Companies are using CDC to sync data across systems, cloud migration or even applying stream processing, among others.
In this presentation we’ll see CDC patterns, how to use it in Apache Kafka, and do a live demo!
https://www.meetup.com/Mexico-Kafka/events/277309497/
Apache Spark is one of the most popular big data projects, offering greatly improved performance over traditional MapReduce models. Much of Apache Spark’s power comes from lazy evaluation along with intelligent pipelining, which can make debugging more challenging. This talk will examine how to debug Apache Spark applications, the different options for logging in PySpark, as well as some common errors and how to detect them.
Spark’s own internal logging can often be quite verbose, and this talk will examine how to effectively search logs from Apache Spark to spot common problems. In addition to the internal logging, this talk will look at options for logging from within our program itself.
Spark’s accumulators have gotten a bad rap because of how they interact in the event of cache misses or partial recomputes, but this talk will look at how to effectively use Spark’s current accumulators for debugging as well as a look to future for data property type accumulators which may be coming to Spark in future version.
In addition to reading logs, and instrumenting our program with accumulators, Spark’s UI can be of great help for quickly detecting certain types of problems.
Debuggers are a wonderful tool, however when you have 100 computers the “wonder” can be a bit more like “pain”. This talk will look at how to connect remote debuggers, but also remind you that it’s probably not the easiest path forward.
So, what is the ELK Stack? "ELK" is the acronym for three open source projects: Elasticsearch, Logstash, and Kibana. Elasticsearch is a search and analytics engine. Logstash is a server‑side data processing pipeline that ingests data from multiple sources simultaneously, transforms it, and then sends it to a "stash" like Elasticsearch. Kibana lets users visualize data with charts and graphs in Elasticsearch.
Building Cloud-Native App Series - Part 1 of 11
Microservices Architecture Series
Design Thinking, Lean Startup, Agile (Kanban, Scrum),
User Stories, Domain-Driven Design
인프라 모니터링을 위한 시스템을 구축하고 운영하는 데 있어, 다이내믹한 인프라 변화는 어려움으로 다가오고 있습니다.
본 세션에서는 인프라를 운영하는 팀 혹은 운영자 관점에서 바라본 미래 지향적 인프라 모니터링 시스템의 방향성과 이를 구현하기 위해 필요한 구성들을 공유하고자 합니다.
목차
1. NHN 모니터링의 현재
2. 모니터링의 변화
3. 모니터링 방법론
4. 모니터링 절차
5. NHN 모니터링의 미래
대상
- 인프라를 운영하는 시스템 엔지니어
- 인프라 모니터링 시스템에 관심이 있는 분
Splunk for Enterprise Security featuring UBA Splunk
This session will review Splunk’s two premium solutions - Splunk Enterprise Security (ES) is Splunk's award-winning security intelligence solution that brings immediate value for continuous monitoring across SOC and
incident response environments. Splunk UBA is a new technology that applies unsupervised machine learning and data science to solving one of the biggest problems in information security today: insider threat. You’ll learn how Splunk UBA works in tandem with ES, or third-party data sources, to bring significant automated analytical power to your SOC and Incident Response teams
Accelerate Troubleshooting and Reinvent Monitoring with Interactive Visualiza...Splunk
Time is money, especially when it’s downtime impacting your services. Splunk IT Service Intelligence (ITSI) introduces an enhanced troubleshooting and monitoring experience that enables you to visually investigate issues and prevent outages, faster than ever before.
Thiis demo-rich webinar helps you to understand how you can use Splunk ITSI to:
- Speed up investigations by organizing and correlating relevant metrics and events into “swim lanes”
- Compare performance over time with real-time performance to understand trends and identify systemic issues
- Identify and alert on notable events by creating predefined correlation searches
Splunk Ninjas: New Features, Pivot, and Search DojoSplunk
Besides seeing the newest features in Splunk Enterprise and learning the best practices for data models and pivot, we will show you how to use a handful of search commands that will solve most search needs. Learn these well and become a ninja.
Join our Security Expert and learn how to use the Splunk App for Enterprise Security (ES) in a live, hands-on session. We'll take a tour through Splunk's award-winning security offering to understand some of the unique capabilities in the product. Then, we'll use ES to work an incident and disrupt an adversary's Kill Chain by finding the Actions on Intent, Exploitation Methods, and Reconnaissance Tactics used against a simulated organization. Data investigated will include threat list intelligence feeds, endpoint activity logs, e-mail logs, and web access logs. This session is a must for all security experts! Please bring your laptop as this is a hands-on session.
Your adversaries continue to attack and get into companies. You can no longer rely on alerts from point solutions alone to secure your network. To identify and mitigate these advanced threats, analysts must become proactive in identifying not just indicators, but attack patterns and behavior. In this workshop we will walk through a hands-on exercise with a real world attack scenario. The workshop will illustrate how advanced correlations from multiple data sources and machine learning can enhance security analysts capability to detect and quickly mitigate advanced attacks.
Power of Splunk Search Processing Language (SPL) ...Splunk
This session will unveil the power of the Splunk Search Processing Language (SPL). See how to use Splunk's simple search language for searching and filtering through data, charting statistics and predicting values, converging data sources and grouping transactions, and finally data science and exploration. We'll begin with basic search commands and build up to more powerful advanced tactics to help you harness your Splunk Fu!
Webinar: Splunk Enterprise Security Deep Dive: AnalyticsSplunk
Splunk Enterprise Security (ES) ist ein Analytics-getriebenes SIEM, das Security Operations Teams erfolgreich bei der Gefahrenbekämpfung unterstützt. Aber wussten Sie auch schon, dass es aus einem Framework aufgebaut ist, das ganz individuell genutzt werden kann, um spezifische Sicherheitsanforderungen angehen zu können?
In unserem Webinar zeigen wir Ihnen die technischen Details hinter dem ES-Framework:
- Asset- und Identitäts-Korrelationen
- beachtenswerte Events
- Threat intelligence
- Risikoanalyse
- Investigation und Adaptive Response
Wir werden Alltags-Beispiele besprechen und Ihnen anhand einer Demo die Schlüssel-Frameworks zeigen, die Ihnen dabei helfen werden, Securityprobleme zu lösen.
Data-Driven DevOps: Mining Machine Data for 'Metrics that Matter' in a DevOps...Splunk
IT organizations are increasingly using machine data - including in DevOps practices - to get away from 'vanity metrics' and instead to generate 'metrics that matter'. These metrics provide visibility into the delivery of new application code and the business value of DevOps, to both IT and business stakeholders.
Machine data provides DevOps teams and others - including QA, secops, CxOs and LOB leaders - with meaningful and actionable metrics. This allows stakeholders to monitor, measure, and continuously improve the velocity and quality of code throughout the software lifecycle, from dev/test to customer-facing outcomes and business impact.
In this session Andi Mann, chief technology advocate at Splunk, will share core methodologies, interesting case studies, key success factors and 'gotcha' moments from real-world experience with mining machine data to produce 'metrics that matter' in a DevOps context.
Learn from our Security Expert on how to use the Splunk App for Enterprise Security (ES) in a live, hands-on session. We'll take a tour through Splunk's award-winning security offering to understand some of the unique capabilities in the product. Then, we'll use ES to work an incident and disrupt an adversary's Kill Chain by finding the Actions on Intent, Exploitation Methods, and Reconnaissance Tactics used against a simulated organization. Data investigated will include threat list intelligence feeds, endpoint activity logs, e-mail logs, and web access logs. This session is a must for all security experts! Please bring your laptop as this is a hands-on session.
Your adversaries continue to attack and get into companies. You can no longer rely on alerts from point solutions alone to secure your network. To identify and mitigate these advanced threats, analysts must become proactive in identifying not just indicators, but attack patterns and behavior. In this workshop we will walk through a hands-on exercise with a real world attack scenario. The workshop will illustrate how advanced correlations from multiple data sources and machine learning can enhance security analysts capability to detect and quickly mitigate advanced attacks.
In this presentation we'll explore the latest developments in MuleSoft's Anypoint Code Builder IDE and how it can help streamline your integration projects. We'll also dive into the exciting world of Splunk and demonstrate how to efficiently push your application logs to Splunk for real-time analysis and troubleshooting.
Innovate Better Through Machine data AnalyticsHal Rottenberg
This talk was presented at IP Expo Manchester in May, 2016. the themes discussed are:
- how does machine data relate to devops?
- how can tracking this data lead to better outcomes?
- what types of data are important to track?
Join the Developer workshop to learn about the many options there are for developers to extend and integrate with the Splunk platform by using our various language SDKs, the Web Framework , creating custom components such as Search Commands and Modular Inputs and ultimately understanding the potential opportunity for you in creating your own Splunk Apps.
Splunk SDKs make it faster and more efficient to program using the Splunk REST API using constructs and syntax familiar to developers who are experienced in Java, Python, JavaScript and PHP. This makes it easier to integrate data from Splunk with other applications across the enterprise.
Splunk All the Things: Our First 3 Months Monitoring Web Service APIs - Splun...Dan Cundiff
A presentation titled "Splunk All the Things: Our First 3 Months Monitoring Web Service APIs" that Dan Cundiff and Eric Helgeson from Target Corporation gave at Splunk .conf2012.
.conf Go 2023 - Das passende Rezept für die digitale (Security) Revolution zu...Splunk
.conf Go 2023 presentation:
"Das passende Rezept für die digitale (Security) Revolution zur Telematik Infrastruktur 2.0 im Gesundheitswesen?"
Speaker: Stefan Stein -
Teamleiter CERT | gematik GmbH M.Eng. IT-Sicherheit & Forensik,
doctorate student at TH Brandenburg & Universität Dresden
.conf Go 2023 presentation:
De NOC a CSIRT
Speakers:
Daniel Reina - Country Head of Security Cellnex (España) & Global SOC Manager Cellnex
Samuel Noval - Global CSIRT Team Leader, Cellnex
Splunk - BMW connects business and IT with data driven operations SRE and O11ySplunk
BMW is defining the next level of mobility - digital interactions and technology are the backbone to continued success with its customers. Discover how an IT team is tackling the journey of business transformation at scale whilst maintaining (and showing the importance of) business and IT service availability. Learn how BMW introduced frameworks to connect business and IT, using real-time data to mitigate customer impact, as Michael and Mark share their experience in building operations for a resilient future.
Data foundations building success, at city scale – Imperial College LondonSplunk
Universities have more in common with modern cities than traditional places of learning. This mini city needs to empower its citizens to thrive and achieve their ambitions. Operationalising data is key to building critical services; from understanding complex IT estates for smarter decision-making to robust security and a more reliable, resilient student experience. Juan will share his experience in building data foundations for a resilient future whilst enabling digital transformation at Imperial College London.
Splunk: How Vodafone established Operational Analytics in a Hybrid Environmen...Splunk
Learn how Vodafone has provided end-to-end visibility across services by building an Operational Analytics Platform. In this session, you will hear how Stefan and his team manage legacy, on premise, hybrid and public cloud services, and how they are providing a platform for complex triage and debugging to tackle use cases across Vodafone’s extensive ecosystem.
.italo operates an Essential Service by connecting more than 100 million people annually across Italy with its super fast and secure railway. And CISO Enrico Maresca has been on a whirlwind journey of his own.
Formerly a Cyber Security Engineer, Enrico started at .italo as an IT Security Manager. One year later, he was promoted to CISO and tasked with building out – and significantly increasing the maturity level – of the SOC. The result was a huge step forward for .italo.
So how did he successfully achieve this ambitious ask? Join Enrico as he reveals the key insights and lessons learned in his SOC journey, including:
Top challenges faced in improving security posture
Key KPIs implemented in order to measure success
Strategies and approaches applied in the SOC
How MITRE ATT&CK and Splunk Enterprise Security were utilised
Next steps in their maturity journey ahead
Builder.ai Founder Sachin Dev Duggal's Strategic Approach to Create an Innova...Ramesh Iyer
In today's fast-changing business world, Companies that adapt and embrace new ideas often need help to keep up with the competition. However, fostering a culture of innovation takes much work. It takes vision, leadership and willingness to take risks in the right proportion. Sachin Dev Duggal, co-founder of Builder.ai, has perfected the art of this balance, creating a company culture where creativity and growth are nurtured at each stage.
Epistemic Interaction - tuning interfaces to provide information for AI supportAlan Dix
Paper presented at SYNERGY workshop at AVI 2024, Genoa, Italy. 3rd June 2024
https://alandix.com/academic/papers/synergy2024-epistemic/
As machine learning integrates deeper into human-computer interactions, the concept of epistemic interaction emerges, aiming to refine these interactions to enhance system adaptability. This approach encourages minor, intentional adjustments in user behaviour to enrich the data available for system learning. This paper introduces epistemic interaction within the context of human-system communication, illustrating how deliberate interaction design can improve system understanding and adaptation. Through concrete examples, we demonstrate the potential of epistemic interaction to significantly advance human-computer interaction by leveraging intuitive human communication strategies to inform system design and functionality, offering a novel pathway for enriching user-system engagements.
Securing your Kubernetes cluster_ a step-by-step guide to success !KatiaHIMEUR1
Today, after several years of existence, an extremely active community and an ultra-dynamic ecosystem, Kubernetes has established itself as the de facto standard in container orchestration. Thanks to a wide range of managed services, it has never been so easy to set up a ready-to-use Kubernetes cluster.
However, this ease of use means that the subject of security in Kubernetes is often left for later, or even neglected. This exposes companies to significant risks.
In this talk, I'll show you step-by-step how to secure your Kubernetes cluster for greater peace of mind and reliability.
Slack (or Teams) Automation for Bonterra Impact Management (fka Social Soluti...Jeffrey Haguewood
Sidekick Solutions uses Bonterra Impact Management (fka Social Solutions Apricot) and automation solutions to integrate data for business workflows.
We believe integration and automation are essential to user experience and the promise of efficient work through technology. Automation is the critical ingredient to realizing that full vision. We develop integration products and services for Bonterra Case Management software to support the deployment of automations for a variety of use cases.
This video focuses on the notifications, alerts, and approval requests using Slack for Bonterra Impact Management. The solutions covered in this webinar can also be deployed for Microsoft Teams.
Interested in deploying notification automations for Bonterra Impact Management? Contact us at sales@sidekicksolutionsllc.com to discuss next steps.
Generating a custom Ruby SDK for your web service or Rails API using Smithyg2nightmarescribd
Have you ever wanted a Ruby client API to communicate with your web service? Smithy is a protocol-agnostic language for defining services and SDKs. Smithy Ruby is an implementation of Smithy that generates a Ruby SDK using a Smithy model. In this talk, we will explore Smithy and Smithy Ruby to learn how to generate custom feature-rich SDKs that can communicate with any web service, such as a Rails JSON API.
Dev Dives: Train smarter, not harder – active learning and UiPath LLMs for do...UiPathCommunity
💥 Speed, accuracy, and scaling – discover the superpowers of GenAI in action with UiPath Document Understanding and Communications Mining™:
See how to accelerate model training and optimize model performance with active learning
Learn about the latest enhancements to out-of-the-box document processing – with little to no training required
Get an exclusive demo of the new family of UiPath LLMs – GenAI models specialized for processing different types of documents and messages
This is a hands-on session specifically designed for automation developers and AI enthusiasts seeking to enhance their knowledge in leveraging the latest intelligent document processing capabilities offered by UiPath.
Speakers:
👨🏫 Andras Palfi, Senior Product Manager, UiPath
👩🏫 Lenka Dulovicova, Product Program Manager, UiPath
UiPath Test Automation using UiPath Test Suite series, part 3DianaGray10
Welcome to UiPath Test Automation using UiPath Test Suite series part 3. In this session, we will cover desktop automation along with UI automation.
Topics covered:
UI automation Introduction,
UI automation Sample
Desktop automation flow
Pradeep Chinnala, Senior Consultant Automation Developer @WonderBotz and UiPath MVP
Deepak Rai, Automation Practice Lead, Boundaryless Group and UiPath MVP
Key Trends Shaping the Future of Infrastructure.pdfCheryl Hung
Keynote at DIGIT West Expo, Glasgow on 29 May 2024.
Cheryl Hung, ochery.com
Sr Director, Infrastructure Ecosystem, Arm.
The key trends across hardware, cloud and open-source; exploring how these areas are likely to mature and develop over the short and long-term, and then considering how organisations can position themselves to adapt and thrive.
Software Delivery At the Speed of AI: Inflectra Invests In AI-Powered QualityInflectra
In this insightful webinar, Inflectra explores how artificial intelligence (AI) is transforming software development and testing. Discover how AI-powered tools are revolutionizing every stage of the software development lifecycle (SDLC), from design and prototyping to testing, deployment, and monitoring.
Learn about:
• The Future of Testing: How AI is shifting testing towards verification, analysis, and higher-level skills, while reducing repetitive tasks.
• Test Automation: How AI-powered test case generation, optimization, and self-healing tests are making testing more efficient and effective.
• Visual Testing: Explore the emerging capabilities of AI in visual testing and how it's set to revolutionize UI verification.
• Inflectra's AI Solutions: See demonstrations of Inflectra's cutting-edge AI tools like the ChatGPT plugin and Azure Open AI platform, designed to streamline your testing process.
Whether you're a developer, tester, or QA professional, this webinar will give you valuable insights into how AI is shaping the future of software delivery.
UiPath Test Automation using UiPath Test Suite series, part 4DianaGray10
Welcome to UiPath Test Automation using UiPath Test Suite series part 4. In this session, we will cover Test Manager overview along with SAP heatmap.
The UiPath Test Manager overview with SAP heatmap webinar offers a concise yet comprehensive exploration of the role of a Test Manager within SAP environments, coupled with the utilization of heatmaps for effective testing strategies.
Participants will gain insights into the responsibilities, challenges, and best practices associated with test management in SAP projects. Additionally, the webinar delves into the significance of heatmaps as a visual aid for identifying testing priorities, areas of risk, and resource allocation within SAP landscapes. Through this session, attendees can expect to enhance their understanding of test management principles while learning practical approaches to optimize testing processes in SAP environments using heatmap visualization techniques
What will you get from this session?
1. Insights into SAP testing best practices
2. Heatmap utilization for testing
3. Optimization of testing processes
4. Demo
Topics covered:
Execution from the test manager
Orchestrator execution result
Defect reporting
SAP heatmap example with demo
Speaker:
Deepak Rai, Automation Practice Lead, Boundaryless Group and UiPath MVP
4. Grigori Melnik, Principal Product Manager – Splunk Developer Platform
Build
Unit Testing
Code
Check-in Integration
Testing Deploy
Staging
Application Development Challenges
4
5. Grigori Melnik, Principal Product Manager – Splunk Developer Platform
Build
Unit Testing
Code
Check-in Integration
Testing Deploy
Staging
Lack of visibility across the product
development lifecycle
Pressure to increase velocity and
agility with DevOps
Limited insights into behavior and
performance from application logs
Application Development Challenges
5
6. Grigori Melnik, Principal Product Manager – Splunk Developer Platform
Quickly trace and identify errors anywhere
in the codebase with real-time search
and monitoring
Instrument your app logs to gain
application intelligence
Break down dev tool silos with real-time
insights from machine data
GAIN END-TO-END VISIBILITY
ACROSS THE DEV TOOL CHAIN
FIND AND FIX
ISSUES FASTER
PUSH BETTER CODE
USING ANALYTICS
Splunk for Application Lifecycle Intelligence
6
7. Grigori Melnik, Principal Product Manager – Splunk Developer Platform
Real-time dashboards show error rate
in production and impact of pushing
new builds
Developers can search and visualize
web logs, Java logs, eventlogs etc;
trace tx without complex
instrumentation
Alerts notify developers as soon as a
problem arises
Find and Fix Issues Faster
7
8. Grigori Melnik, Principal Product Manager – Splunk Developer Platform
Gain end-to-end visibility to make
informed decisions
Analytics insights without the need for
additional analytics tools
Ask questions while exploring and
collecting data
Push Better Code Using Analytics
8
9. Grigori Melnik, Principal Product Manager – Splunk Developer Platform9 9
CI / Build
Servers
Project and Issue
Tracking
Code
Repository
QA / Testing
Tools
End-To-End Visibility Across The Dev Tool Chain
Deployment Servers /
Automation
11. Grigori Melnik, Principal Product Manager – Splunk Developer Platform11
CI / Build
Server
Code
Review
Task
Tracking
What Data Can You Splunk?
Logs – Which code has already been reviewed for this release/sprint? Who has
completed the most code reviews? What code has NOT been reviewed?
Logs/API – Who is changing files? What kinds of files are being changed? What
branches are most active? What types of activities are occurring for a branch?
Version
Control
Logs/API – How many builds completed today/this week/this month? Which
check-in kicked off this build? Which tests ran against this failed build?
Logs – Which tasks are assigned to which developers? What progress is being
made to complete assigned tasks? What tasks remain for this release/sprint?
1
12. Grigori Melnik, Principal Product Manager – Splunk Developer Platform12
Key Benefits of Application Lifecycle Intelligence
Reduced Time
to Market
Shrink the time it takes
to get code through
dev/test to market
through faster issue
identification and
resolution
Increased
Agility
With real-time visibility
into processes like code
check-ins, builds and
tests to support
DevOps practices like
continuous integration
“Our devs are now able to
find and fix issues five to ten
times faster.”
“We can monitor all the
automation and handoffs it
takes to deploy 5-10 times
a day”
Application
Insights
Instrument customer
application logs to
capture critical
business events and
user behavior
“My code isn’t ready until it’s
Splunk-ready”
1
15. Grigori Melnik, Principal Product Manager – Splunk Developer Platform15
Evolving the Splunk Platform
Collection
Indexing
Search Processing Language
Core Functions
Inputs, Apps, Other
Content
SDKs & plug-ins
Operational Intelligence Platform
Content
Core Engine
User and Developer Interfaces
Web Framework
REST API
16. Grigori Melnik, Principal Product Manager – Splunk Developer Platform16
Powerful Platform for Enterprise Developers
1
REST API
Build Splunk Apps Extend and Integrate Splunk
Simple XML
JavaScript/CSS Extensions C#
JavaScript
Python
Ruby
Java
PHP
Data Models
Search Extensibility
Modular Inputs
SDKs
KV Store
17. Grigori Melnik, Principal Product Manager – Splunk Developer Platform
Log directly to
Splunk via TCP,
UDP, HTTP
Integrate search
results with other
applications using
custom
visualizations
Create and run
searches from
other applications
The REST API and SDKs
17
VisualizeSearch Manage
Add/Delete Users
Manage Inputs
Index
18. Grigori Melnik, Principal Product Manager – Splunk Developer Platform18
The Splunk REST API
Exposes an API method for every feature in the product
– Whatever you can do in the UI – you can do through the API
– Index, Search, Visualize, Manage
API is RESTful
– Endpoints are served by splunkd
– Requests are GET, POST, and DELETE HTTP methods
– Responses are Atom XML & JSON
– Versioning as of Splunk 5.0
– Search results can be output in CSV/JSON/XML
1
19. Grigori Melnik, Principal Product Manager – Splunk Developer Platform19
SDKs Overview
19
• Stay true to the semantics of the particular language
• E.g. Keep Python “pythonic”
• E.g. C#: Fully async , PCL, support for Rx
• Provide implementation that feels natural to the developer
• E.g. Project, build, IDE (where applicable) support
• Cover REST API endpoints based on use cases of language
• Namespaces
• owner: splunk username (defaults to current user)
• app: app context (defaults to default app)
• sharing: user | app | global | system
22. Splunk Developer Guidance
Splunk Reference Apps
Complete, working real-world Splunk solutions
built together with partners (Conducive; Auth0)
̶ 2 (pseudo-) production releases
̶ entire code & test repos on GitHub
̶ under Apache 2.0
Associated Guidance
I. Start-to-Finish Journey Documentary
II. Essentials
dev.splunk.com/goto/devguide
23. 1. Started with a Questions BacklogArchitecture
– What does a typical Splunk application reference architecture look like?
– What common paradigms are applicable to Splunk app development?
– What are the typical deployment topologies? Why should I choose a specific one? What are the confounding factors
on the choice of my topology?
– How do I partition my Splunk solutions?
– What are the tradeoffs of various types of inputs?
– How do I architect my Splunk solution and deployment for a very large scale?
– How do I architect my Splunk solution for the cloud? What are specific considerations for deploying to AWS or Azure?
– What’s the landscape of Splunk extension points?
– How do I integrate data from Splunk into existing applications and systems?
– How do I plan and design a robust alerting and monitoring subsystem on top of Splunk?
– What should I consider for my sizing requirements?
– What are recommended configurations of Splunk deployment to meet my sizing requirements?
– Should I architect my solution to index my data in local data center (zone) or centrally?
– What are things we can automatically degrade so we can make sure our core experience is working?
– When something happens, how do I effectively propagate the info and react to it?
– How are other solutions on Splunk built? What were the challenges? How have they been addressed?
Packaging and Deployment
– How do I piece together various parts of a Splunk app (custom search commands, mod inputs etc.)?
– How do I package a Splunk solution with a single install that automatically rolls out all the necessary dependencies?
– How do I manage my Splunk solution versioning, backward and future compat?
– What's the best way to split up custom apps for deployment?
Development
– How should I set up my development environment to be productive with Splunk?
– What are different ways of how I develop my Splunk app ? Pros and cons of using specific SDK vs REST APIs?
Pros and cons of using SimpleXML vs Advanced XML vs Web Framework …
– How do I analyze a data source for a TA?
– What are the different ways of enriching the data in Splunk? What are their tradeoffs?
– When should I use event types and transactions for data classification?
– How do I extend Splunk to define a custom input capability?
– When should I use modular inputs vs scripted inputs vs..?
– What are streaming vs non-streaming outputs considerations?
– How do I deal with long-running scripts? Handling shutdown/restart of Splunk? Concurrency? State persistence etc.
– Why should I not use transactions?
– When should I use pivot vs tstats?
– Why should I use data models?
– When my data source touches on many data models, should I assume complete separation or heavy inheritance?
– How do I extend an existing data model?
– What does CIM offer and why should I build CIM-compliant apps?
– In the context of CIM, what are the tradeoffs of using my props.conf and transforms.conf and rewriting them on
indexing, completely discarding the vendor supplied field names? How do I reconcile the advantages of a clean
interface & normalisation, but at the cost of losing alignment with published vendor documentation, and a learning
curve for existing users?
– How do I manage my solution declarative configuration? How do I detect/troubleshoot bad config?
– How do I log and analyze data that is not event driven (certain web feeds, html parsing, image meta data)?
– Compare and contrast ad-hoc searching vs background searching
– How do I handle transient faults?
– How do I effectively manage credentials?
– What’s the effect of search head location on my app and the overall user experience?
– How do I develop an integrated mechanism to let me connect Splunk to my MOM (messaging middleware) and index
my messages?
– How do I handle the requirement that app configs must be different across different server types in a distributed
environment (e.g. apps on search heads shouldn't have inputs enabled)?
Quality/Compliance
– What quality gates should I consider? What kind of para-functional characteristics are important to consider?
– What heuristics do I use to bless/block a release?
– How do I test a data model?
– How do I prepare event generation when building/testing an app?
– What kind of perf testing should I do and how?
– How do I test UI?
– How do I security certify my solution?
– How do I design to satisfy my retention and compliance policies?
– How do I architect to design my availability requirements?
– How do I handle geographic disaster recovery / fault tolerance?
– How do I properly instrument my solution so that I know what’s happening?
Sustained Engineering
– How do I maintain/service/support Splunk apps?
– How do my customers handle updating their customized configs once new versions of my app come out?
Business
– Why should I build on Splunk?
– What kind of skill do I need my devs to have to build a Splunk solution?
– What is the community building? How are current devs creating unique experiences using Splunk – I typically want to
see some marketplace success
– Cost and pricing are very important to me as a entrepreneur developer. If I am coming in to build a tool that will be
commercialized I need to know that the cost structure of Splunk won’t cause my service to be economically
unprofitable.
What does a typical Splunk application architecture look like?
How should I set up my dev environment to be productive with
Splunk?
How do I integrate Splunk into existing systems?
How do I prepare my event generation when developing &
testing an app?
How do I package an app? deal with app versioning and updates?
24. 2. Mined business requirements with partner
3. Formulated learning objectives
4. Reconciled 2 & 3 with our designs
…
25. Data
Search language
Aggregating siloed metrics into
meaningful KPIs
Data manipulation
Data normalization
Sub-searches
Config-driven
Persistence with KV store
Macros
Viz:
Dynamic scaling
Customizing in-the box viz
controls
General search patterns
Search optimizations
Ux Prototyping
Adapting 3rd party viz library
Composite charts with interactions
Dealing with high-volume data sets
Troubleshooting perf issues
Post-process or not-post-process –
deployment implications
Automated UI testing (w.Selenium)
Setting the stage
Overall Splunk app structure
UI technology selection:
Simple XML vs SplunkJS
Modularity
Dev & test env
Dev workflow
Modularity
Data onboarding
CIM compliance
Tools
Post-processing
Integrating with 3rd party
component
Unit testing (w.Mocha)
Persisting state (per user)
Data modeling
Using lookups
Building a baseline lookup table
Windows of time/Custom time ranges
Overlaying time data
Using sub-searches to correlate data
Troubleshooting searches
Custom nav
Ux activities permeating all dev
Data mining:
Exploration
Preparation: filtering/deduping/
bucketing
Using advanced statistics functions
Threshold-based anomaly detection
Evaluating goodness /accuracy
Plus non-functional topics: App versioning
Packaging Installation
Security review
Deployment
Publishing to splunkbase
App certification
Order Flow, message queues, Garbage Collection, Java Heap
identify errors by java class, thread
alert actions - jira ticket, service now ticket, webhook
PM’s love to look at feature usage; are new features being used?
How do we allocate developer time to create/enhance features
Roll Ubisoft Video
http://www.splunk.com/en_us/resources/video.5rcTNqdDpGoBAtUNietLLxtORoC0QW7Y.html
Compliance - Developers can’t login to production systems but Splunk allows them to troubleshoot
10GB of indexing/day
Full Enterprise Features
Free trial for 6 months
Finds and traces bugs in real time so you can fix them faster
Reduces time to market through faster issue identification and resolution
Provides insights into user behavior and application usage
Works with the applications, tools and systems that dev teams use every day for full lifecycle visibility
We’re headed to the East Coast!
2 inspired Keynotes – General Session and Security Keynote + Super Sessions with Splunk Leadership in Cloud, IT Ops, Security and Business Analytics!
165+ Breakout sessions addressing all areas and levels of Operational Intelligence – IT, Business Analytics, Mobile, Cloud, IoT, Security…and MORE!
30+ hours of invaluable networking time with industry thought leaders, technologists, and other Splunk Ninjas and Champions waiting to share their business wins with you!
Join the 50%+ of Fortune 100 companies who attended .conf2015 to get hands on with Splunk. You’ll be surrounded by thousands of other like-minded individuals who are ready to share exciting and cutting edge use cases and best practices. You can also deep dive on all things Splunk products together with your favorite Splunkers.
Head back to your company with both practical and inspired new uses for Splunk, ready to unlock the unimaginable power of your data! Arrive in Orlando a Splunk user, leave Orlando a Splunk Ninja!
REGISTRATION OPENS IN MARCH 2016 – STAY TUNED FOR NEWS ON OUR BEST REGISTRATION RATES – COMING SOON!