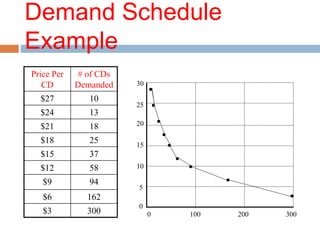
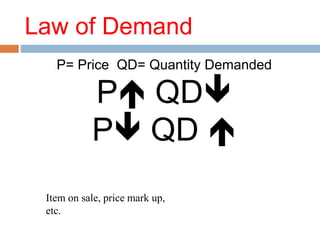
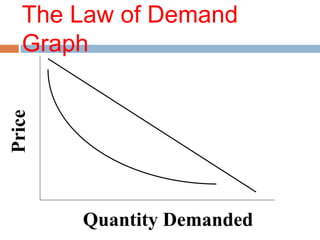
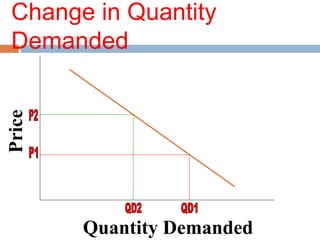
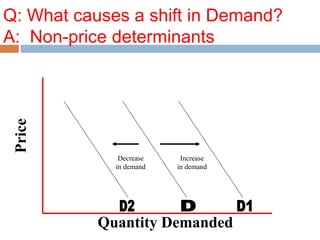
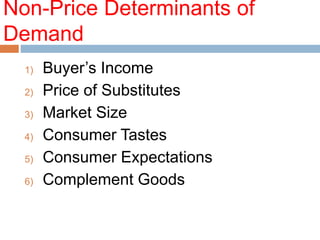
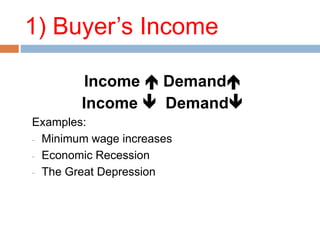
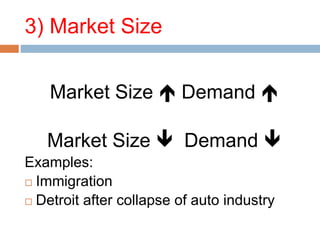
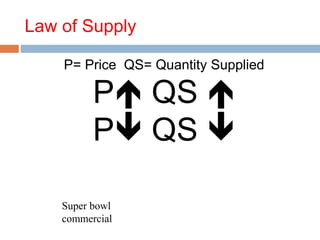
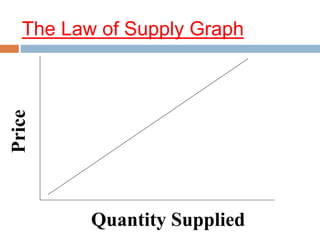
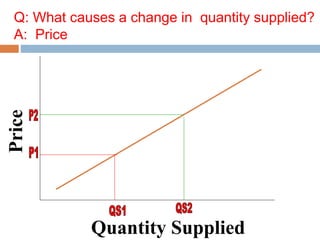
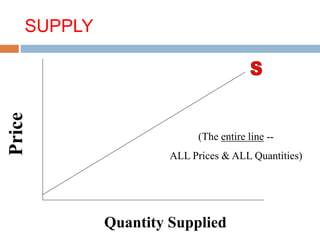
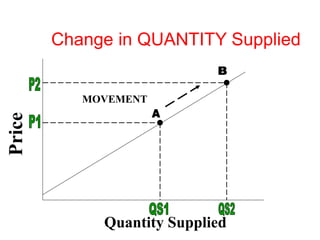
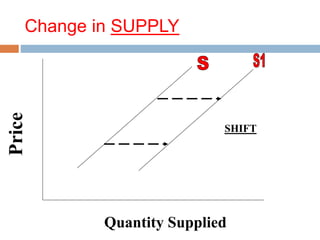
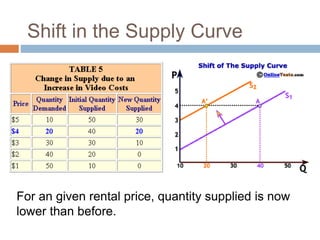
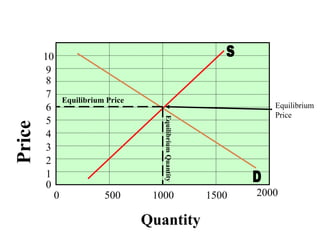
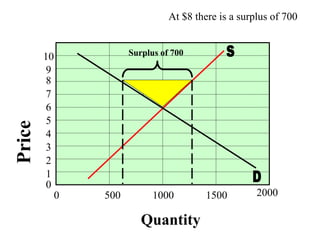
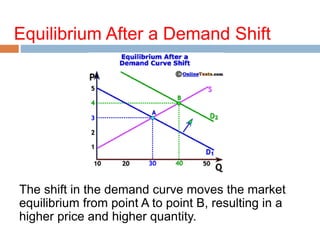
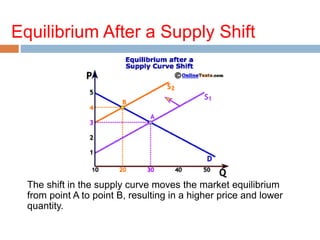
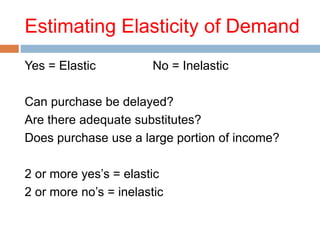
SUPPLY & DEMAND
Economics
DEMAND
The desire, ability,
and willingness to
buy a product or
service
Do You Demand These?
Desire? Ability? Willingness?
Demand Schedule
A listing that shows the quantity
demanded at all prices.
Price Per
CD
# of CDs
Demanded
$1 300
$2 162
$3 94
$4 58
$5 37
$6 25
$10 18
$15 13
$20 10
Demand Schedule
Example
Price Per
CD
# of CDs
Demanded
$27 10
$24 13
$21 18
$18 25
$15 37
$12 58
$9 94
$6 162
$3 300 100 200 300
0
0
5
10
15
20
25
30
Law of Demand
P= Price QD= Quantity Demanded
P QD
P QD 
Item on sale, price mark up,
etc.
The Law of Demand
Graph
Quantity Demanded
Price
Change in Quantity
Demanded
Quantity Demanded
Price
Q: What causes a shift in Demand?
A: Non-price determinants
Price
Quantity Demanded
Decrease
in demand
Increase
in demand
Non-Price Determinants of
Demand
1) Buyer’s Income
2) Price of Substitutes
3) Market Size
4) Consumer Tastes
5) Consumer Expectations
6) Complement Goods
1) Buyer’s Income
Income  Demand
Income  Demand
Examples:
- Minimum wage increases
- Economic Recession
- The Great Depression
2) Price of Substitute Goods
Goods or services that can be used
instead of other goods or services,
causing a change in demand.
3) Market Size
Market Size  Demand 
Market Size  Demand 
Examples:
 Immigration
 Detroit after collapse of auto industry
4) Consumer Tastes
The popularity of a good or service has a strong
effect on the demand for it, and in the
marketplace, popularity can change quickly.
5) Consumer Expectations
What you expect prices to do in the
future
can influence your buying habits today.
Examples:
 HD TV’s
 PS3
 Gasoline
 Homes
 Automobiles
6) Complement Goods
When the use of one product increases
the use of another product.
Supply
The desire, ability, and willingness
to offer products for sale
*Anyone who offers an economic product
for sale is a supplier
*When you work at your job, you are
offering your services for sale. Your
economic product is labor. You would
probably supply more for a higher wage.
Law of Supply
P= Price QS= Quantity Supplied
P QS 
P QS 
Super bowl
commercial
The Law of Supply Graph
Quantity Supplied
Price
Q: What causes a change in quantity supplied?
A: Price
Quantity Supplied
Price
Q: What causes a shift in supply?
A: Non Price Determinants of Supply
Price
Quantity Supplied
Decrease
in supply
Increase
in supply
Non-Price Determinants of
Supply
1) Number of Products
2) Input Costs
3) Labor Productivity
4) Technology
5) Government Action
6) # of sellers
7) Producer Expectations
1) Number of Products
A successful new product or service always brings out
competitors who initially raise overall supply.
2) Input Costs
 Input costs, the collective price of resources that
go into producing a good or service, affect
supply directly
 Examples
 Minimum Wage increases
 Cost of cotton increases, supply of t-shirts decreases
3) Labor Productivity
Better trained or more-skilled workers are usually more
productive. Increased productivity decreases costs
and increases supply.
4) Technology
By applying scientific advances to the production
process, producers have learned to generate their
goods or services more efficiently.
5) Government Action
Government actions, such as taxes or subsidies,
can
have a positive or negative effect on production
costs.
6) # of Sellers
# of sellers increases, supply increases
# of sellers decreases, supply decreases
Examples:
 McDonald’s Plans to Open 1,000 new stores in
2010
 All Circuit City stores in America went out of
business
7) Producer Expectations
The amount of a product that producers are willing
and able to supply may be influenced by
whether they believe prices will go up or down.
SUPPLY
Quantity Supplied
Price
(The entire line --
ALL Prices & ALL Quantities)
QUANTITY Supplied
Quantity Supplied
Price
(POSITIVE SLOPE)
Change in QUANTITY Supplied
Quantity Supplied
Price
MOVEMENT
Change in SUPPLY
Quantity Supplied
Price
SHIFT
Shift in the Supply Curve
For an given rental price, quantity supplied is now
lower than before.
Market Equilibrium
Situation in which prices are relatively stable and
the quantity of goods or services supplied is
equal to the quantity demanded.
QS = QD
Equilibrium Price – the price that “clears the
market.” No Shortage or Surplus.
Quantity
Price
0 500 1000 1500 2000
0
1
2
3
4
5
6
7
8
9
10
Equilibrium Price
Equilibrium
Quantity
Equilibrium
Price
Surplus
Situation in which the quantity supplied is
greater than the quantity demanded at a given
price.
QS > QD
P 
Note: If there is a surplus, prices generally fall
Quantity
Price
0 500 1000 1500 2000
0
1
2
3
4
5
6
7
8
9
10 Surplus of 700
At $8 there is a surplus of 700
Shortage
The situation in which the quantity demanded is
greater than the quantity supplied.
QD > QS
P
Note: If there is a shortage, prices generally rise
Quantity
Price
0 500 1000 1500 2000
0
1
2
3
4
5
6
7
8
9
10
A price of $3 causes a shortage of 900 units.
Shortage of 900
Equilibrium After a Demand Shift
The shift in the demand curve moves the market
equilibrium from point A to point B, resulting in a
higher price and higher quantity.
Equilibrium After a Supply Shift
The shift in the supply curve moves the market equilibrium
from point A to point B, resulting in a higher price and lower
quantity.
Demand Elasticity
A term used to indicate the extent to which
changes in price cause changes in quantity
demanded.
Elastic Demand
Occurs when a relatively small change in price
causes a relatively large change in the
quantity demanded.
Inelastic Demand
Occurs when a change in price causes a
relatively smaller change in the quantity
demanded.
Estimating Elasticity of Demand
Yes = Elastic No = Inelastic
Can purchase be delayed?
Are there adequate substitutes?
Does purchase use a large portion of income?
2 or more yes’s = elastic
2 or more no’s = inelastic
Elastic or Inelastic?
Necessity
The more necessary a good is, the lower the
elasticity, as people will attempt to buy it no
matter the price, such as the case of insulin for
those that need it.

Introduction-to-Supply-and-Demand-Power-Point.ppt

  • 1.
  • 2.
    DEMAND The desire, ability, andwillingness to buy a product or service
  • 3.
    Do You DemandThese? Desire? Ability? Willingness?
  • 4.
    Demand Schedule A listingthat shows the quantity demanded at all prices. Price Per CD # of CDs Demanded $1 300 $2 162 $3 94 $4 58 $5 37 $6 25 $10 18 $15 13 $20 10
  • 5.
    Demand Schedule Example Price Per CD #of CDs Demanded $27 10 $24 13 $21 18 $18 25 $15 37 $12 58 $9 94 $6 162 $3 300 100 200 300 0 0 5 10 15 20 25 30
  • 6.
    Law of Demand P=Price QD= Quantity Demanded P QD P QD  Item on sale, price mark up, etc.
  • 7.
    The Law ofDemand Graph Quantity Demanded Price
  • 8.
  • 9.
    Q: What causesa shift in Demand? A: Non-price determinants Price Quantity Demanded Decrease in demand Increase in demand
  • 10.
    Non-Price Determinants of Demand 1)Buyer’s Income 2) Price of Substitutes 3) Market Size 4) Consumer Tastes 5) Consumer Expectations 6) Complement Goods
  • 11.
    1) Buyer’s Income Income Demand Income  Demand Examples: - Minimum wage increases - Economic Recession - The Great Depression
  • 12.
    2) Price ofSubstitute Goods Goods or services that can be used instead of other goods or services, causing a change in demand.
  • 13.
    3) Market Size MarketSize  Demand  Market Size  Demand  Examples:  Immigration  Detroit after collapse of auto industry
  • 14.
    4) Consumer Tastes Thepopularity of a good or service has a strong effect on the demand for it, and in the marketplace, popularity can change quickly.
  • 15.
    5) Consumer Expectations Whatyou expect prices to do in the future can influence your buying habits today. Examples:  HD TV’s  PS3  Gasoline  Homes  Automobiles
  • 16.
    6) Complement Goods Whenthe use of one product increases the use of another product.
  • 17.
    Supply The desire, ability,and willingness to offer products for sale *Anyone who offers an economic product for sale is a supplier *When you work at your job, you are offering your services for sale. Your economic product is labor. You would probably supply more for a higher wage.
  • 18.
    Law of Supply P=Price QS= Quantity Supplied P QS  P QS  Super bowl commercial
  • 19.
    The Law ofSupply Graph Quantity Supplied Price
  • 20.
    Q: What causesa change in quantity supplied? A: Price Quantity Supplied Price
  • 21.
    Q: What causesa shift in supply? A: Non Price Determinants of Supply Price Quantity Supplied Decrease in supply Increase in supply
  • 22.
    Non-Price Determinants of Supply 1)Number of Products 2) Input Costs 3) Labor Productivity 4) Technology 5) Government Action 6) # of sellers 7) Producer Expectations
  • 23.
    1) Number ofProducts A successful new product or service always brings out competitors who initially raise overall supply.
  • 24.
    2) Input Costs Input costs, the collective price of resources that go into producing a good or service, affect supply directly  Examples  Minimum Wage increases  Cost of cotton increases, supply of t-shirts decreases
  • 25.
    3) Labor Productivity Bettertrained or more-skilled workers are usually more productive. Increased productivity decreases costs and increases supply.
  • 26.
    4) Technology By applyingscientific advances to the production process, producers have learned to generate their goods or services more efficiently.
  • 27.
    5) Government Action Governmentactions, such as taxes or subsidies, can have a positive or negative effect on production costs.
  • 28.
    6) # ofSellers # of sellers increases, supply increases # of sellers decreases, supply decreases Examples:  McDonald’s Plans to Open 1,000 new stores in 2010  All Circuit City stores in America went out of business
  • 29.
    7) Producer Expectations Theamount of a product that producers are willing and able to supply may be influenced by whether they believe prices will go up or down.
  • 30.
    SUPPLY Quantity Supplied Price (The entireline -- ALL Prices & ALL Quantities)
  • 31.
  • 32.
    Change in QUANTITYSupplied Quantity Supplied Price MOVEMENT
  • 33.
    Change in SUPPLY QuantitySupplied Price SHIFT
  • 34.
    Shift in theSupply Curve For an given rental price, quantity supplied is now lower than before.
  • 35.
    Market Equilibrium Situation inwhich prices are relatively stable and the quantity of goods or services supplied is equal to the quantity demanded. QS = QD Equilibrium Price – the price that “clears the market.” No Shortage or Surplus.
  • 36.
    Quantity Price 0 500 10001500 2000 0 1 2 3 4 5 6 7 8 9 10 Equilibrium Price Equilibrium Quantity Equilibrium Price
  • 37.
    Surplus Situation in whichthe quantity supplied is greater than the quantity demanded at a given price. QS > QD P  Note: If there is a surplus, prices generally fall
  • 38.
    Quantity Price 0 500 10001500 2000 0 1 2 3 4 5 6 7 8 9 10 Surplus of 700 At $8 there is a surplus of 700
  • 39.
    Shortage The situation inwhich the quantity demanded is greater than the quantity supplied. QD > QS P Note: If there is a shortage, prices generally rise
  • 40.
    Quantity Price 0 500 10001500 2000 0 1 2 3 4 5 6 7 8 9 10 A price of $3 causes a shortage of 900 units. Shortage of 900
  • 41.
    Equilibrium After aDemand Shift The shift in the demand curve moves the market equilibrium from point A to point B, resulting in a higher price and higher quantity.
  • 42.
    Equilibrium After aSupply Shift The shift in the supply curve moves the market equilibrium from point A to point B, resulting in a higher price and lower quantity.
  • 43.
    Demand Elasticity A termused to indicate the extent to which changes in price cause changes in quantity demanded.
  • 44.
    Elastic Demand Occurs whena relatively small change in price causes a relatively large change in the quantity demanded.
  • 45.
    Inelastic Demand Occurs whena change in price causes a relatively smaller change in the quantity demanded.
  • 46.
    Estimating Elasticity ofDemand Yes = Elastic No = Inelastic Can purchase be delayed? Are there adequate substitutes? Does purchase use a large portion of income? 2 or more yes’s = elastic 2 or more no’s = inelastic
  • 47.
  • 48.
    Necessity The more necessarya good is, the lower the elasticity, as people will attempt to buy it no matter the price, such as the case of insulin for those that need it.