Download to read offline
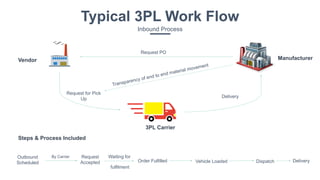
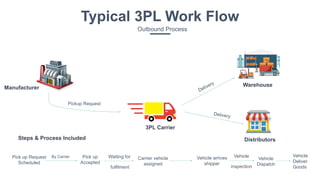
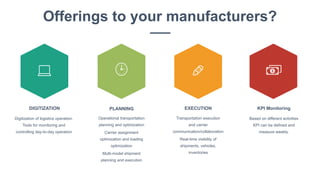
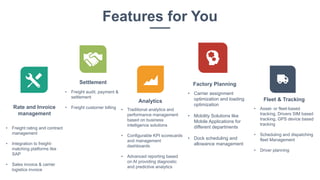
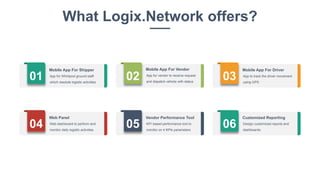
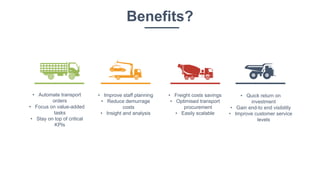
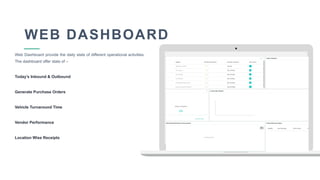
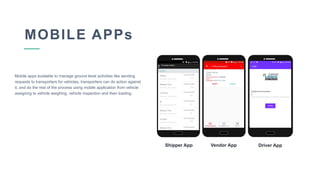
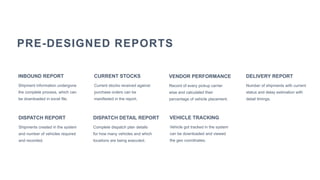
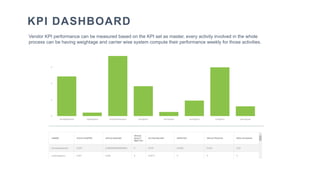
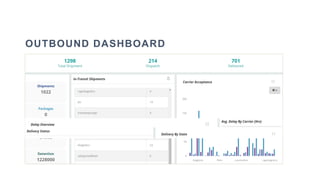
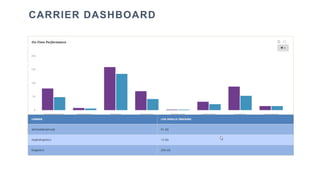
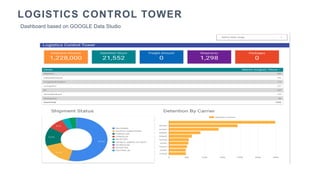
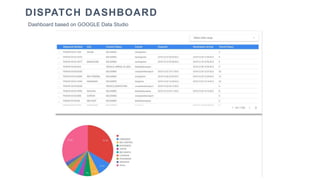
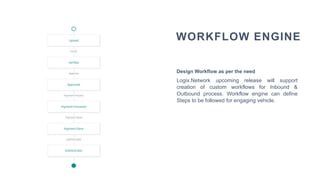
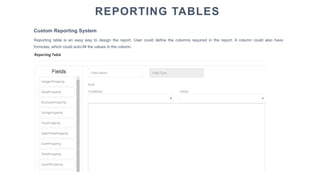
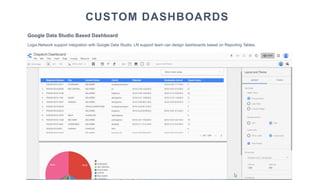


Logix.network offers a comprehensive TMS for 3PLs to streamline both inbound and outbound logistics processes, enhancing visibility, communication, and efficiency. Key features include real-time shipment tracking, KPI management, custom dashboards, and mobile applications for managing operations at various levels. The platform aims to optimize transportation procurement, reduce costs, and improve overall customer service through automation and data-driven insights.


![谷歌留痕技术教程[ 𝙩𝙤𝙥 𝟮𝟯𝟯. 𝙘 𝙤𝙢 ]](https://cdn.slidesharecdn.com/ss_thumbnails/top233-260130173900-2eb784f9-thumbnail.jpg?width=640&height=640&fit=bounds)


