Downloaded 63 times


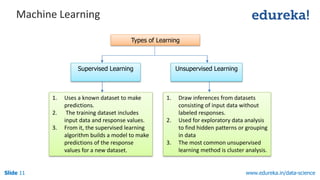
![Slide 15 www.edureka.in/data-science
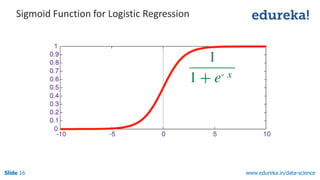
Logistic Regression
After some calculations we can get : p(X) /1−p(X) = eA+BX
The quantity p(X)/[1−p(X)] is called the odds, and can take on values between 0 and ∞.
Values of the odds close to 0 and ∞ indicate very low and very high probabilities resp.
Finally we get: log (p(X)/1-p(X)) = A + BX which is called the log-odds or logit
Logistic Regression is linear in x.](https://image.slidesharecdn.com/dslogisticreg-150620105320-lva1-app6891/85/Logistic-Regression-In-Data-Science-15-320.jpg)


The document provides an overview of data science, covering topics such as data mining, machine learning, and the demand for data scientists. It outlines the stages of data mining, explains logistic regression, and discusses various machine learning algorithms. Additionally, it promotes a course that includes modules on data manipulation using R, clustering techniques, and integration with Hadoop.


![Getting Started with Apache Spark: Big Data Made Simple [Free Meetup]](https://cdn.slidesharecdn.com/ss_thumbnails/apachesparkgettingstarted-260203175547-8361bcc3-thumbnail.jpg?width=640&height=640&fit=bounds)


