Downloaded 33 times


![Metrics vs Logs
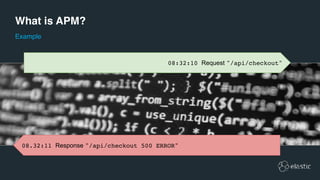
64.242.88.10 - - [07/Mar/2017:16:10:02 -0800] "GET /mailman/listinfo/hsdivision HTTP/1.1" 200 6291
64.242.88.10 - - [07/Mar/2017:16:11:58 -0800] "POST /twiki/bin/view/TWiki/WikiSyntax HTTP/1.1" 404 7352
64.242.88.10 - - [07/Mar/2017:16:20:55 -0800] "GET /twiki/bin/view/Main/DCCAndPostFix HTTP/1.1" 200 5253
For each event, print out what happened.
Logs are chronological records of events](https://image.slidesharecdn.com/log-190320184156/85/Logging-Metrics-and-APM-The-Operations-Trifecta-P-9-320.jpg)


![Metrics vs Logs
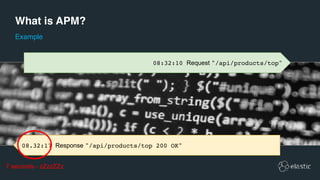
64.242.88.10 - - [07/Mar/2017:16:10:02 -0800] "GET /mailman/listinfo/hsdivision HTTP/1.1" 200 6291
64.242.88.10 - - [07/Mar/2017:16:11:58 -0800] "POST /twiki/bin/view/TWiki/WikiSyntax HTTP/1.1" 404 7352
64.242.88.10 - - [07/Mar/2017:16:20:55 -0800] "GET /twiki/bin/view/Main/DCCAndPostFix HTTP/1.1" 200 5253
For each event, print out what happened.
Logs are chronological records of events
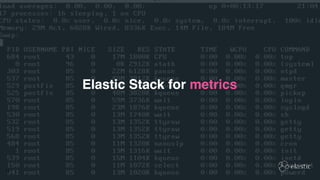
07/Mar/2017 16:10:00 all 2.58 0.00 0.70 1.12 0.05 95.55 server1 containerX regionA
07/Mar/2017 16:20:00 all 2.56 0.00 0.69 1.05 0.04 95.66 server2 containerY regionB
07/Mar/2017 16:30:00 all 2.64 0.00 0.65 1.15 0.05 95.50 server2 containerZ regionC
Every x minutes, measure the CPU load and print it out, and annotate with meta-data.
Metrics are periodic measurements of numeric KPIs](https://image.slidesharecdn.com/log-190320184156/85/Logging-Metrics-and-APM-The-Operations-Trifecta-P-15-320.jpg)
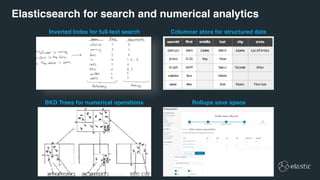


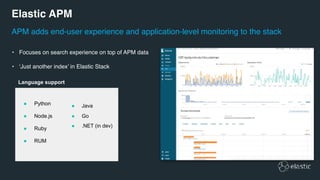
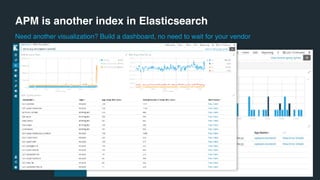
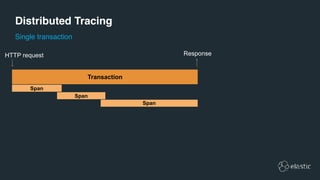
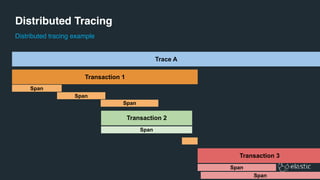
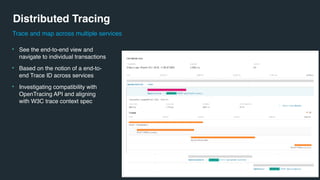


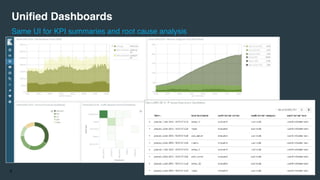
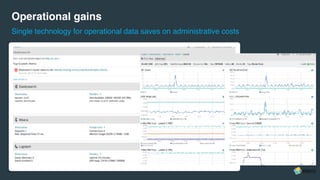
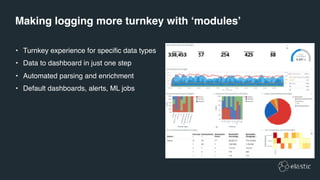
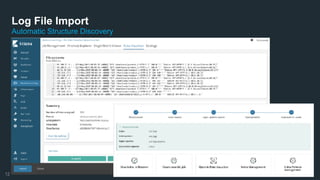
The document discusses the benefits of integrating logging, metrics, and APM (Application Performance Monitoring) within a unified technology stack, emphasizing operational efficiency, cost reduction, and enhanced monitoring capabilities through machine learning and automated tools. It details the Elastic Stack's functionalities for managing logs, metrics, and APM across various systems and platforms, and highlights its ability to provide insightful visualizations and alerting mechanisms for operational data. The document also covers how APM adds application-level monitoring and end-user experience tracking, utilizing distributed tracing for comprehensive service transaction visibility.


![Modernising One Legal Se@rch with Elastic Enterprise Search [Customer Story]](https://cdn.slidesharecdn.com/ss_thumbnails/modernisingonelegalserchwithelastic-jsedit14thjune2021-210625013449-thumbnail.jpg?width=640&height=640&fit=bounds)


![Getting Started with Apache Spark: Big Data Made Simple [Free Meetup]](https://cdn.slidesharecdn.com/ss_thumbnails/apachesparkgettingstarted-260203175547-8361bcc3-thumbnail.jpg?width=640&height=640&fit=bounds)


