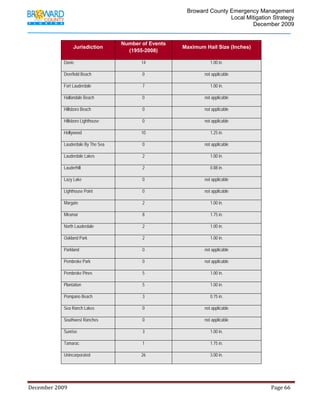
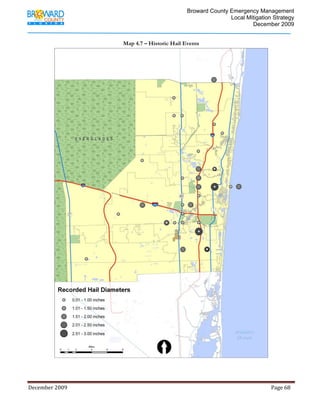
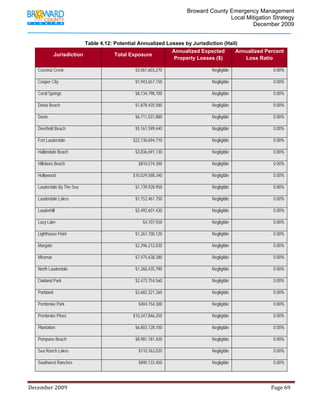
Download to read offline

![Broward County Emergency Management
Local Mitigation Strategy
December 2009
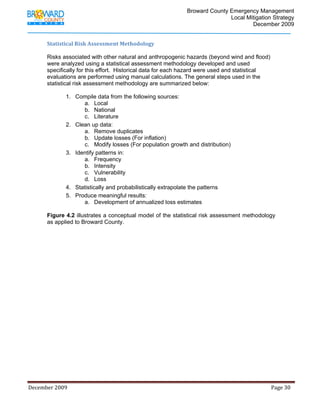
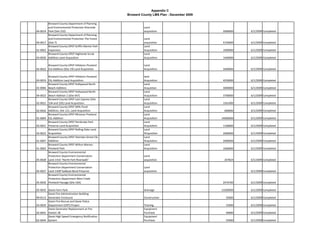
FEMA Requirements for Local Hazard Mitigation Plans
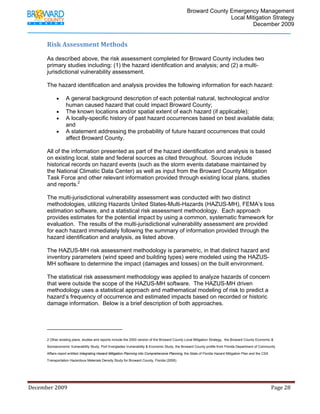
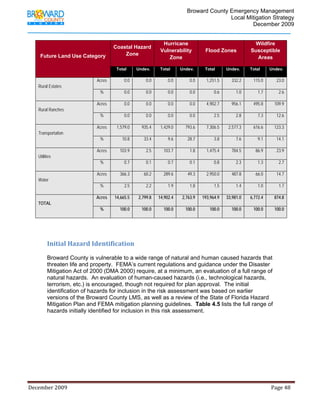
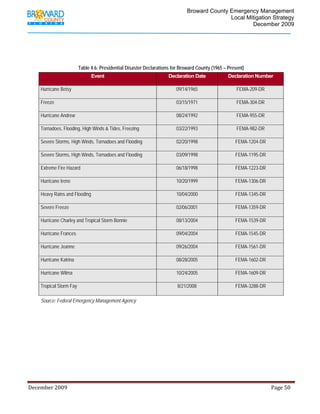
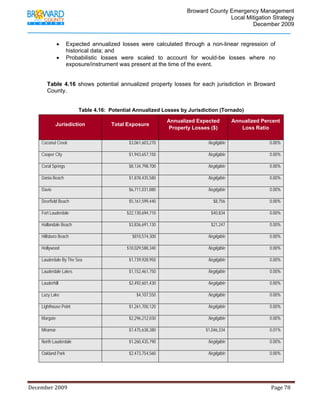
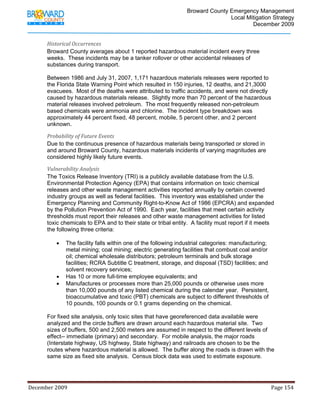
44 CFR Part 201.6(c)(2)(i): [The risk assessment shall include…] a description of the type, location and extent of all
natural hazards that can affect the jurisdiction. The plan shall include information on previous occurrences of hazard
events and on the probability of future hazard events.
44 CFR Part 201.6(c)(2)(ii): [The risk assessment shall include…] a description of the jurisdiction's vulnerability to the
hazards described in paragraph (c)(2)(i) of this section. The description shall include an overall summary of each hazard
and its impact on the community. The plan should describe vulnerability in terms of: (A) The types and numbers of
existing and future buildings, infrastructure, and critical facilities located in the identified hazard areas; (B) An estimate of
the potential losses to vulnerable structures identified in paragraph (c)(2)(ii)(A) of this section and a description of the
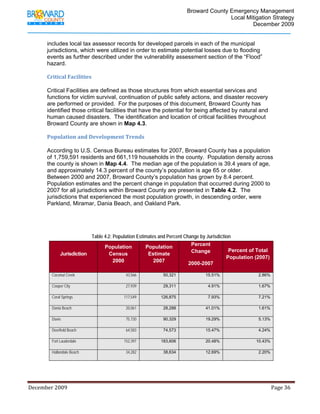
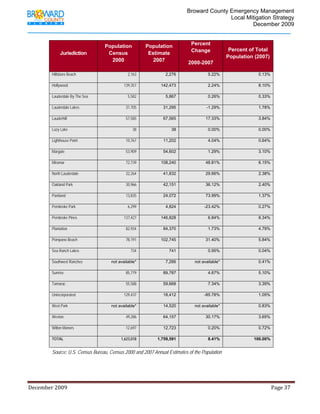
methodology used to prepare the estimate; (C) Providing a general description of land uses and development trends
within the community so that mitigation options can be considered in future land use decisions.
December 2009 Page 25](https://image.slidesharecdn.com/browardcountylmsplandecember2009includesallappendices-100923163002-phpapp02/85/Local-Mitigation-Strategy-25-320.jpg)
![Broward County Emergency Management
Local Mitigation Strategy
December 2009
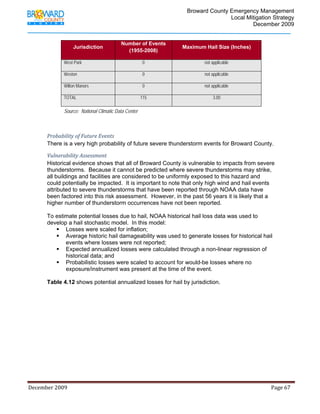
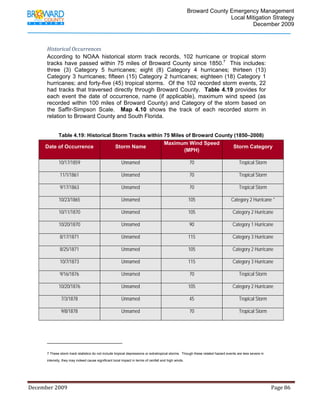
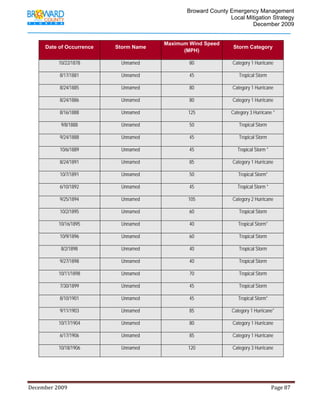
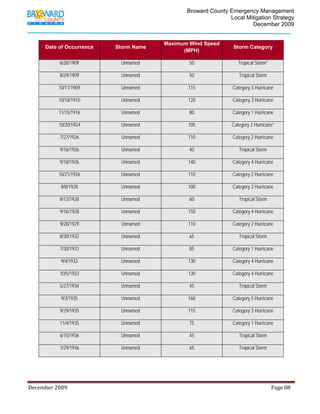
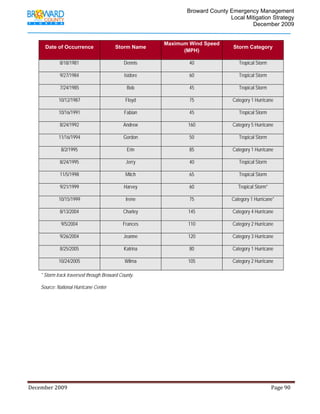
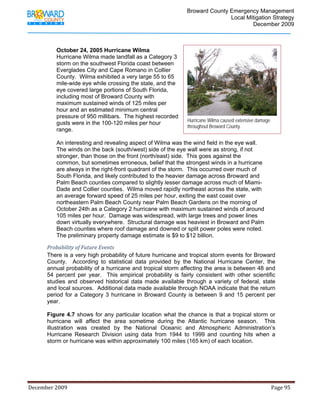
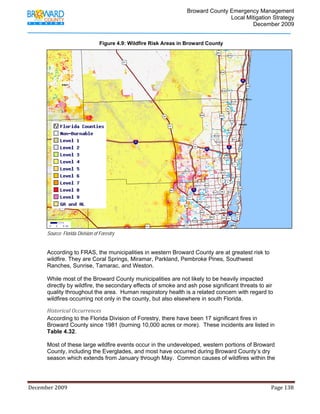
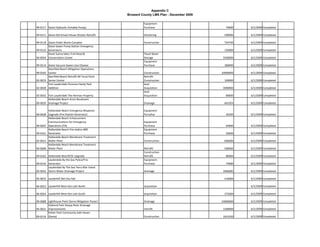
Some of the more notable historical tropical cyclone events for Broward County are
described below:
October 18, 1906 Hurricane
A hurricane moved across the Florida Keys and passed over Miami on October 18
as a Category 3 storm resulting in the loss of 134 lives.
September 18, 1926 Hurricane
The eye of the hurricane moved directly over Miami on the morning of September
18, leaving approximately 100 dead. The storm continued northwestward across
South Florida and entered the Gulf of Mexico at Fort Myers. Northeast winds from
the storm raised Lake Okeechobee water levels above the low dike on the south
end of the lake near Moore Haven. Approximately three miles of dike failed,
sending 10 to 12 foot floodwaters into Moore Haven and at least five-foot deep
floodwaters into Clewiston, 16 miles to the southeast.
September 16, 1928 Hurricane [Okeechobee Hurricane]
A Category 4 hurricane made landfall near Palm Beach on September 16 with a
central pressure of 929 millibars. The center passed near Lake Okeechobee,
causing the lake to overflow its banks and inundate the surrounding area to a
depth of 6 to 9 feet. An estimated 1,836 people died in Florida, primarily due to
the lake surge. Damage to property was estimated at $25 million in Florida.
September 3, 1935 [Labor Day Hurricane]
This hurricane is considered to be one of the most severe hurricanes ever
recorded in Florida. With winds in excess of 200 miles per hour, the storm passed
over the Florida Keys on September 2 with a minimum barometric pressure of
26.35 inches. Three relief-work camps, inhabited by veterans of World War I,
were destroyed. The American Red Cross estimates that 408 lives were lost.
September 3, 1979 Hurricane David
Hurricane David, a category two storm, made landfall north of Palm Beach and
caused an estimated $476 million in damages.
August 24, 1992 Hurricane Andrew
Hurricane Andrew made a memorable landfall in South Miami-Dade County,
causing estimated damages in excess of $26 billion in damages. Andrew
produced approximately seven inches of rain, sustained winds of 165 miles per
hour, a maximum storm tide of 16 feet and a total of 96 deaths (including
Louisiana). In all, Andrew destroyed 25,000 homes and significantly damaged
more than 100,000 others in South Florida. Two weeks after the hurricane, the
U.S. military deployed nearly 22,000 troops to aid in the recovery efforts, the
largest military rescue operation in U.S. history. When Hurricane Andrew hit
southeast Miami-Dade County, flying debris in the storm's winds knocked out
most ground-based wind measuring instruments, and widespread power outages
caused electric-based measuring equipment to fail. The winds were so strong
many wind-measuring tools were incapable of registering the maximum winds.
Surviving wind observations and measurements from aircraft reconnaissance,
surface pressure, satellite analysis, radar, and distribution of debris and structural
failures were used to estimate the surface winds. Though original ly classified as
December 2009 Page 92](https://image.slidesharecdn.com/browardcountylmsplandecember2009includesallappendices-100923163002-phpapp02/85/Local-Mitigation-Strategy-92-320.jpg)
![Broward County Emergency Management
Local Mitigation Strategy
December 2009
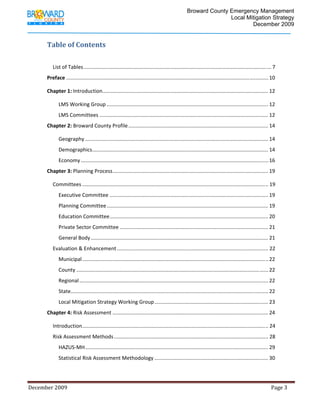
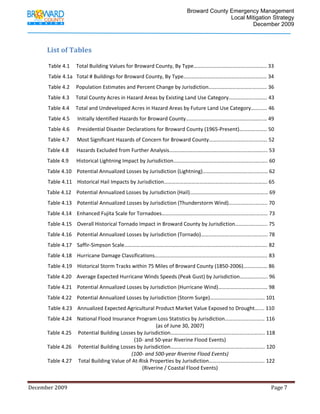
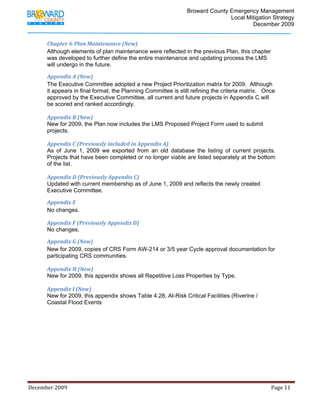
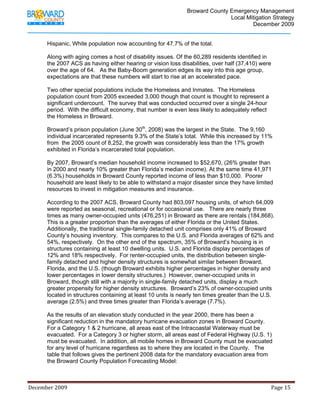
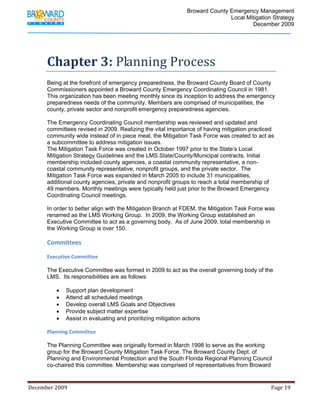
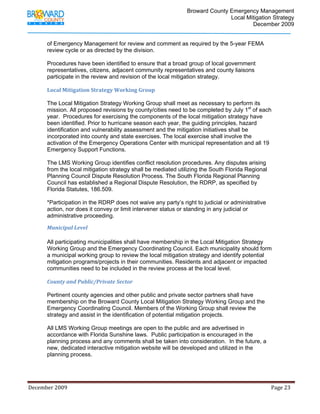
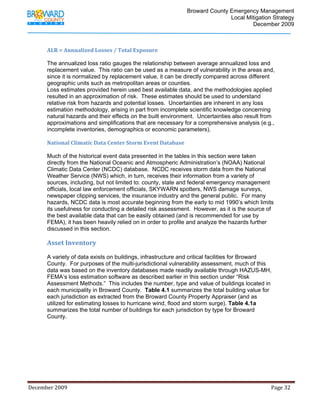
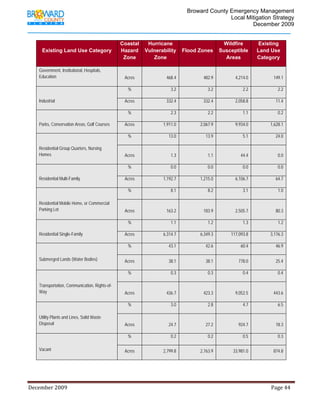
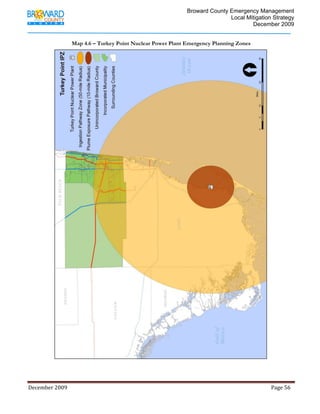
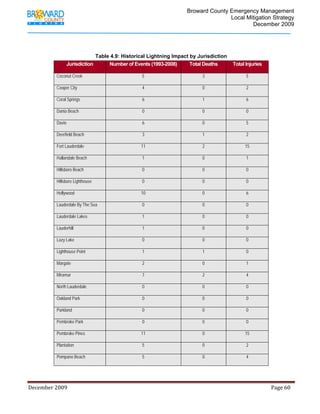
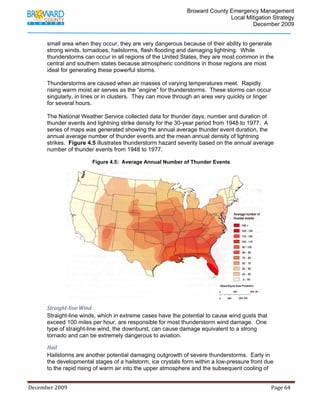
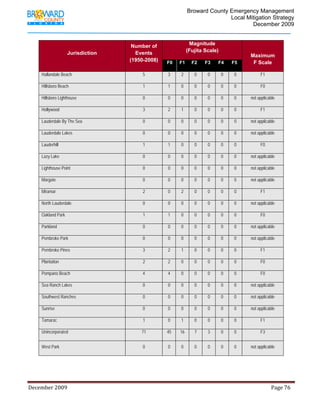
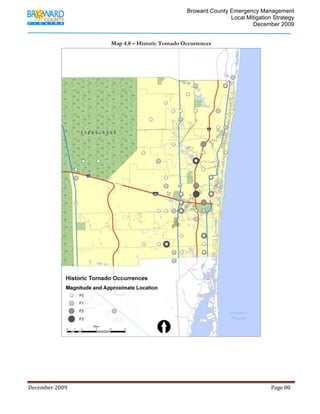
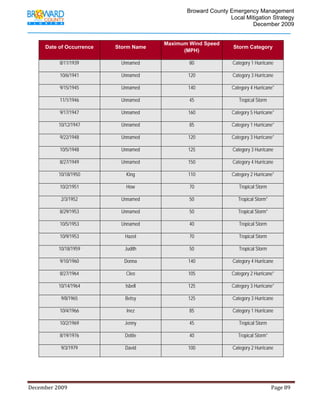
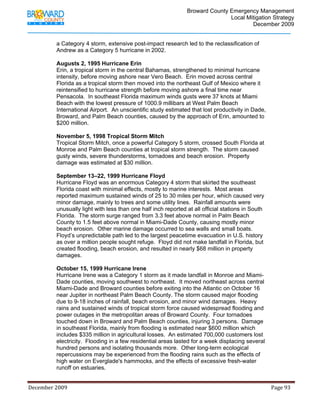
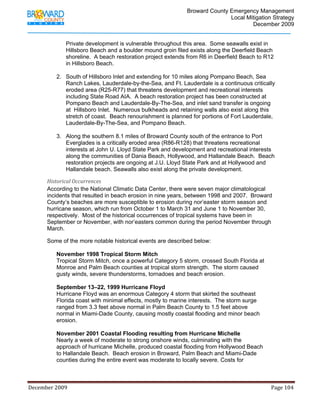
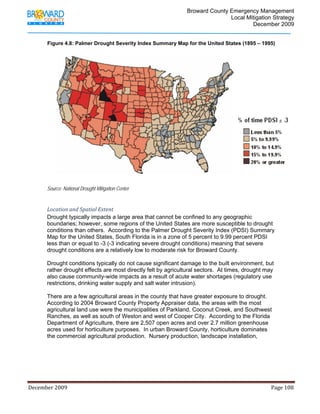
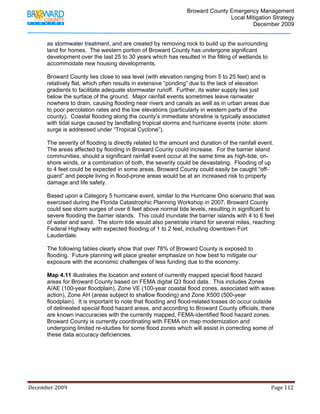
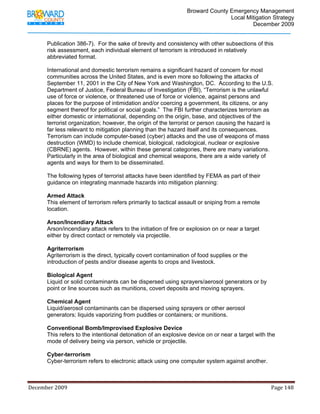
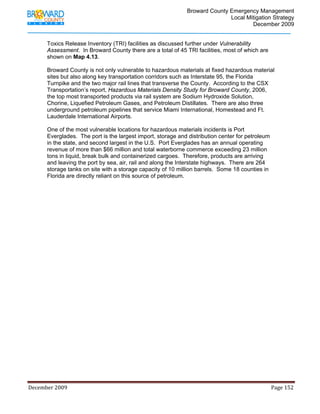
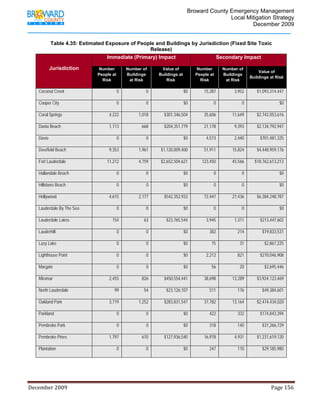
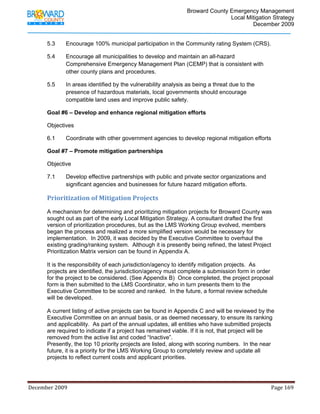
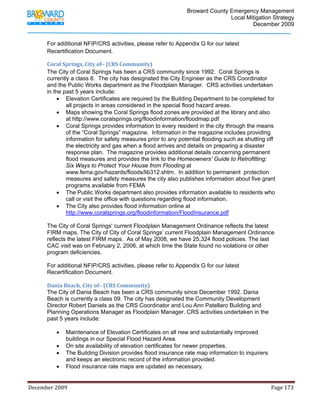
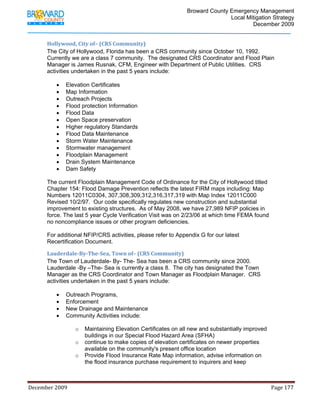
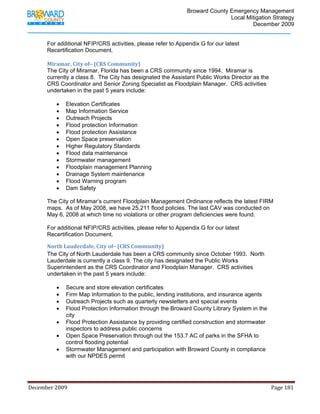
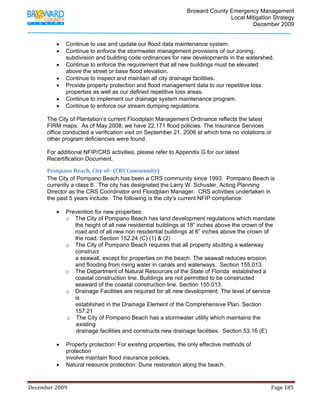
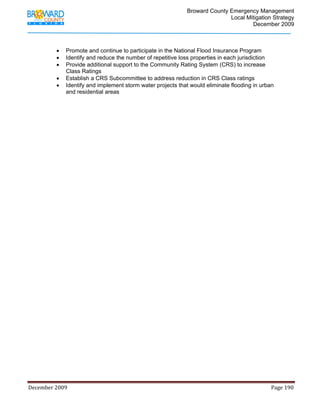
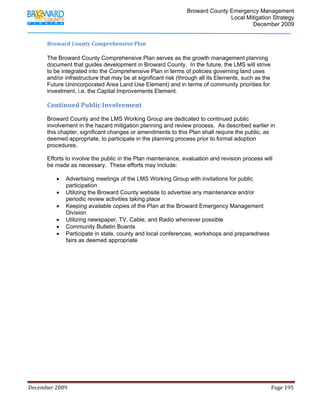
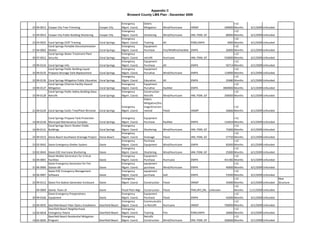
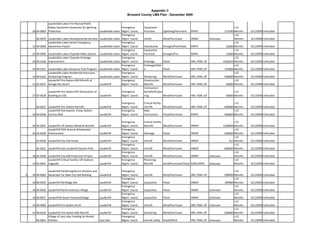
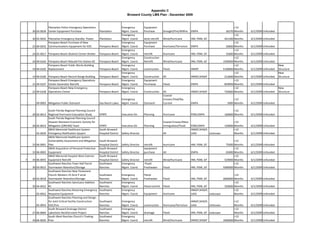
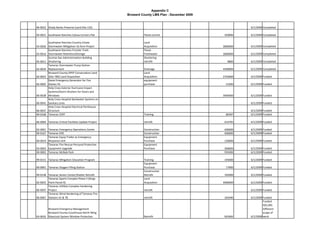
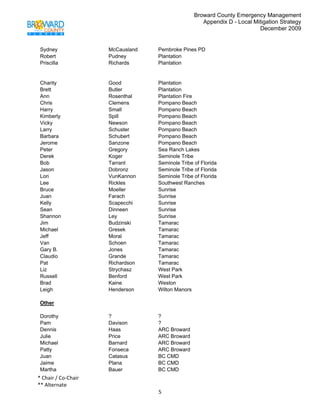
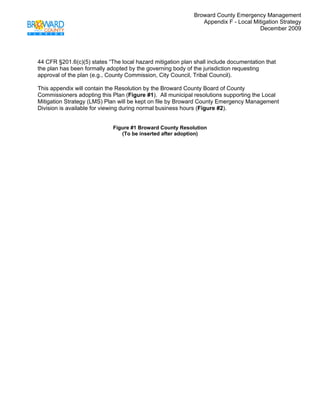
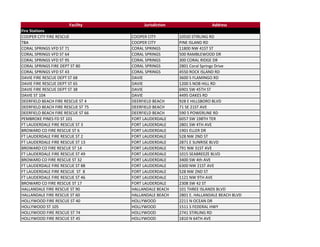
Figure 4.7: Empirical Probability of a Named Hurricane or Tropical Storm
Source: National Oceanic and Atmospheric Administration, Hurricane Research Division
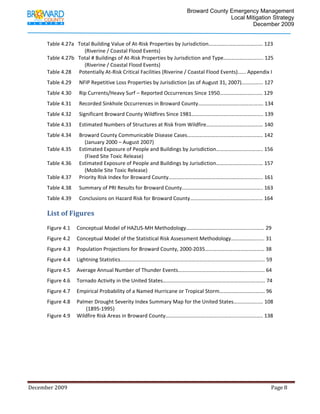
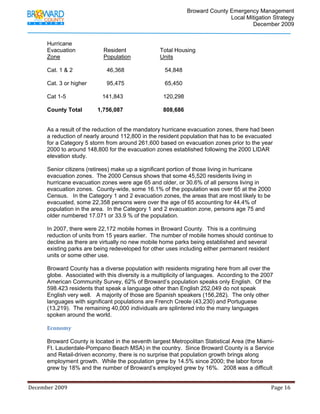
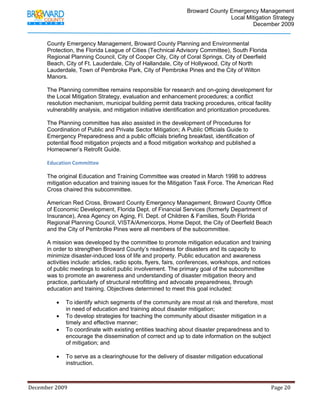
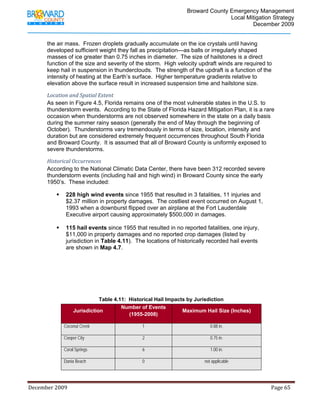
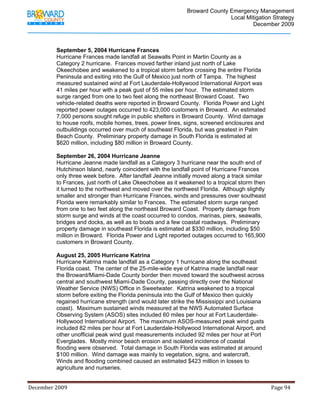
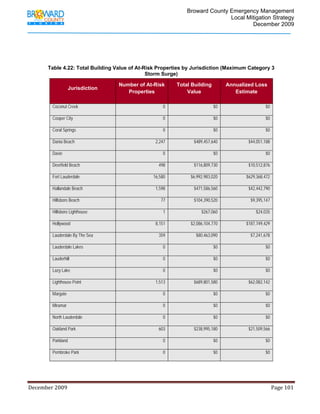
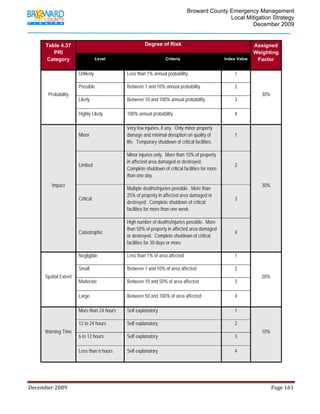
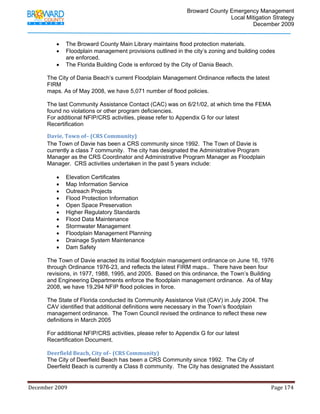
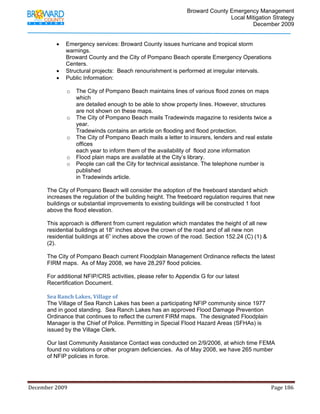
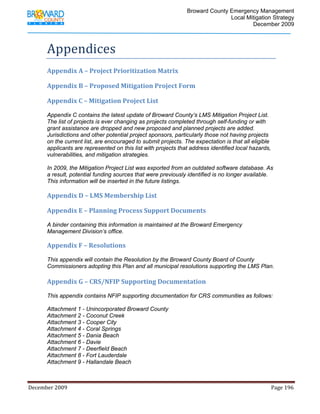
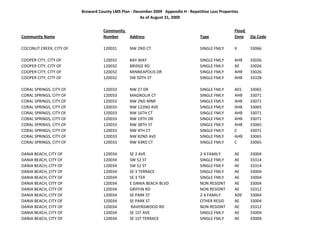
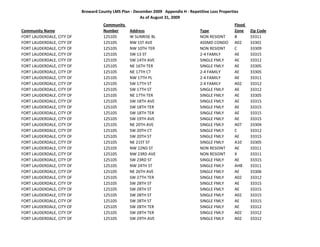
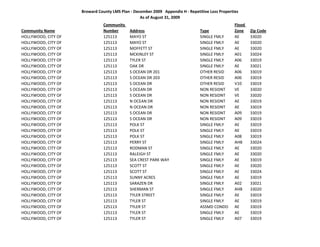
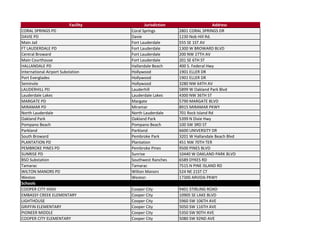
Table 4.20 profiles the potential peak gust wind speeds in miles per hour (MPH) that
could be expected in Broward County during a hurricane event for various return periods.
Table 4.20: Average Expected Hurricane Wind Speeds (Peak Gust) by Jurisdiction
Wind Speed [MPH] vs. Return Periods [Year]
Jurisdiction
10 20 50 100 200 500 1000
Coconut Creek 80 101 124 139 153 168 179
Cooper City 82 103 126 141 153 168 177
Coral Springs 81 101 123 138 151 165 176
Dania Beach 81 104 127 143 157 172 184
December 2009 Page 96](https://image.slidesharecdn.com/browardcountylmsplandecember2009includesallappendices-100923163002-phpapp02/85/Local-Mitigation-Strategy-96-320.jpg)
![Broward County Emergency Management
Local Mitigation Strategy
December 2009
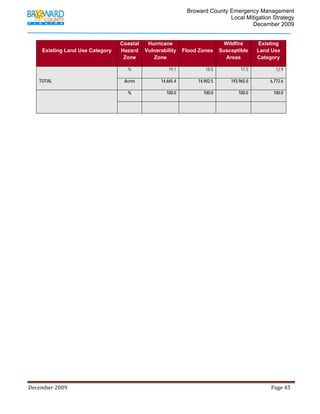
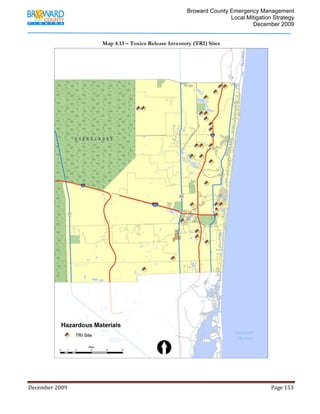
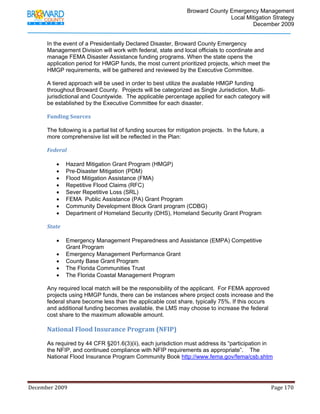
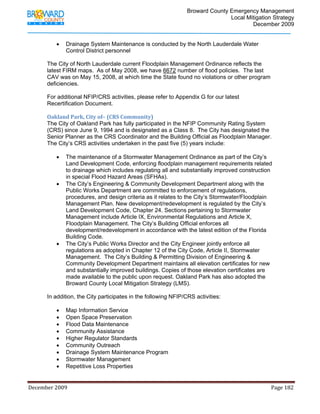
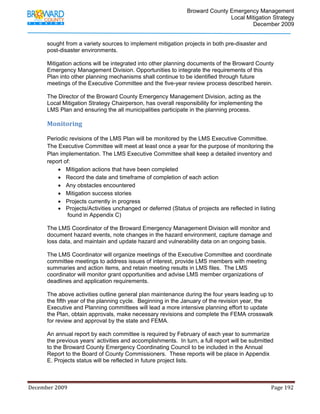
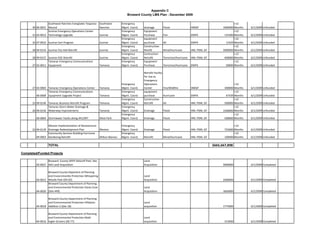
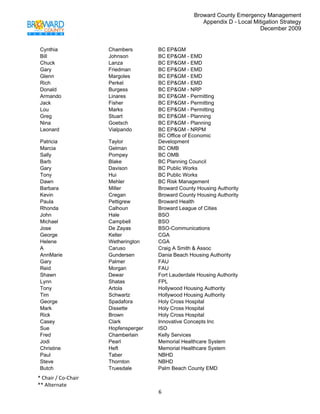
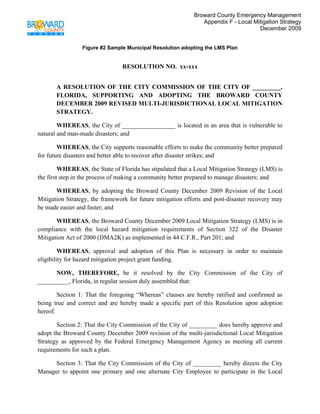
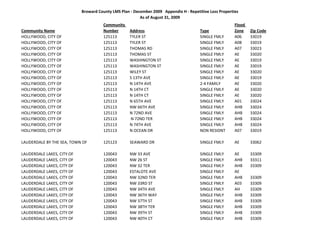
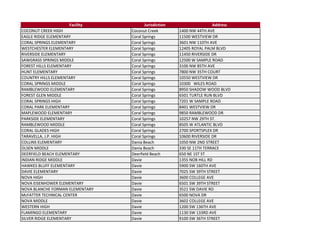
Wind Speed [MPH] vs. Return Periods [Year]
Jurisdiction
10 20 50 100 200 500 1000
Davie 82 103 126 140 153 168 177
Deerfield Beach 81 102 125 140 154 170 183
Fort Lauderdale 81 104 127 142 157 173 183
Hallandale Beach 82 105 129 144 159 175 185
Hillsboro Beach 81 103 126 142 156 173 186
Hillsboro Lighthouse 81 103 126 142 156 173 186
Hollywood 81 104 127 143 157 173 183
Lauderdale By The Sea 82 104 127 143 157 174 186
Lauderdale Lakes 81 102 125 140 155 170 179
Lauderhill 81 102 125 140 154 168 179
Lazy Lake 81 104 127 143 158 173 183
Lighthouse Point 81 103 126 142 156 172 186
Margate 80 101 124 139 153 168 178
Miramar 82 103 127 141 155 170 179
North Lauderdale 81 102 124 139 154 168 178
Oakland Park 81 103 126 141 156 172 181
Parkland 80 101 123 138 151 166 176
Pembroke Park 82 104 128 143 158 173 183
Pembroke Pines 82 103 126 140 153 168 177
Plantation 81 103 125 140 153 168 178
Pompano Beach 81 103 126 141 156 171 183
Sea Ranch Lakes 82 104 127 143 158 174 187
Seminole Tribe of Florida 81 103 126 141 155 171 181
Southwest Ranches 82 103 126 140 152 167 177
Sunrise 81 102 125 139 152 166 177
December 2009 Page 97](https://image.slidesharecdn.com/browardcountylmsplandecember2009includesallappendices-100923163002-phpapp02/85/Local-Mitigation-Strategy-97-320.jpg)
![Broward County Emergency Management
Local Mitigation Strategy
December 2009
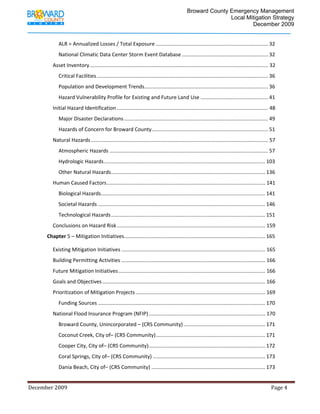
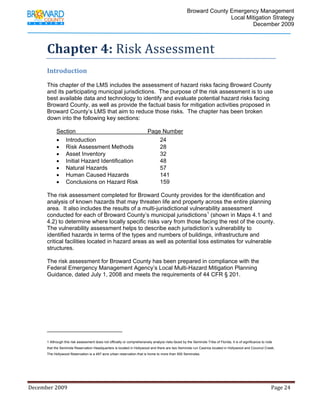
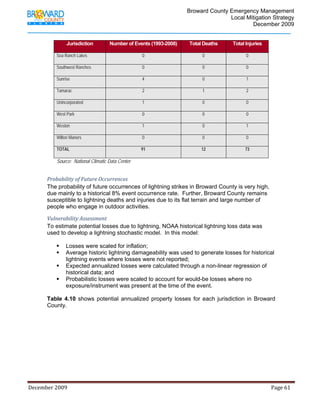
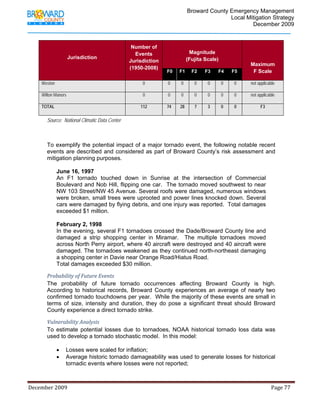
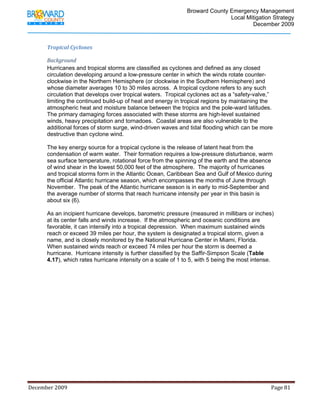
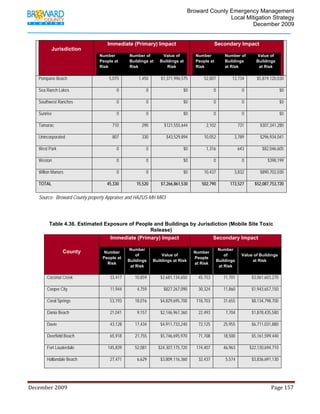
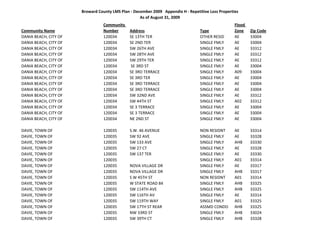
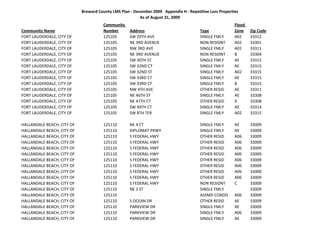
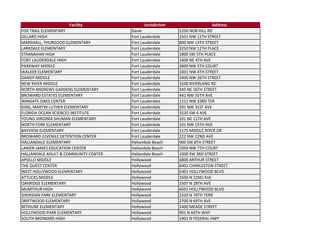
Wind Speed [MPH] vs. Return Periods [Year]
Jurisdiction 10 20 50 100 200 500 1000
Tamarac 81 102 124 139 153 167 177
Unincorporated 81 103 125 140 153 168 179
West Park 82 104 128 143 157 173 182
Weston 81 102 124 138 149 163 172
Wilton Manors 81 104 126 142 157 173 183
TOTAL 81 103 126 141 155 170 181
Source: HAZUS-MH MR2
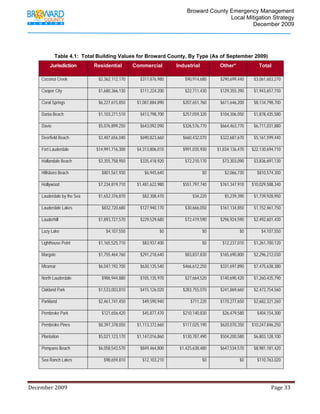
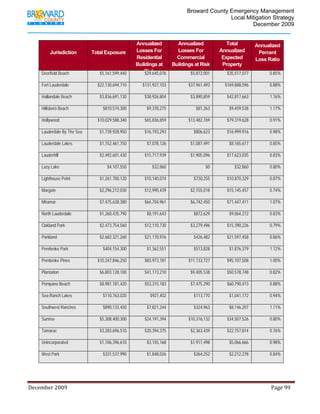
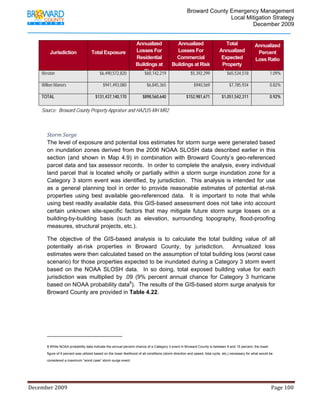
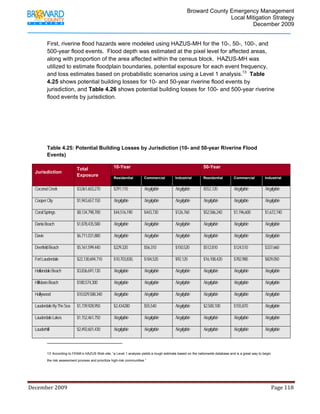
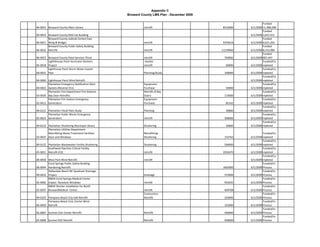
Vulnerability Assessment
Two methods were utilized to estimate potential losses caused by tropical cyclones.
HAZUS-MH was utilized to conduct a loss estimation analysis for hurricane wind, while a
separate GIS-based analysis was completed for storm surge inundation using NOAA’s
SLOSH data in combination with Broward County’s local tax assessor records. These
analyses are more thoroughly described earlier in this section under “risk assessment
methods,” and the results are provided below.
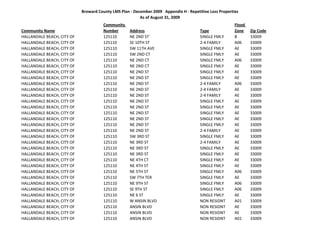
Hurricane Wind
HAZUS-MH wind speed data, inventory and damage functions, and methodology were
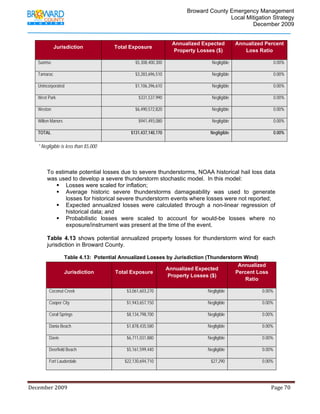
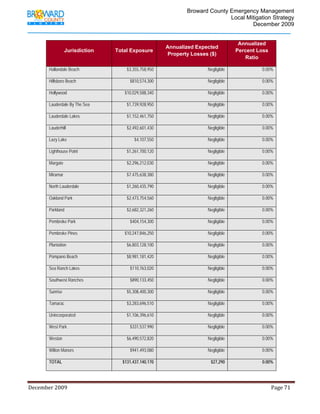
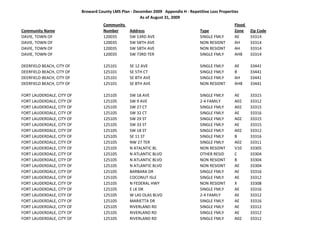
used to determine the annual expected losses due to hurricane wind. Table 4.21 shows
annualized property losses and annualized percent loss ratios by jurisdiction.
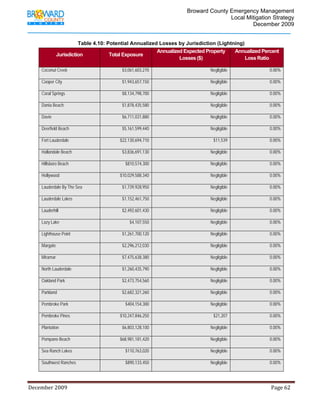
Table 4.21: Potential Annualized Losses by Jurisdiction (Hurricane Wind)
Annualized Total
Annualized
Losses For Annualized Annualized
Losses For
Jurisdiction Total Exposure Residential Expected Percent
Commercial
Buildings at Property Loss Ratio
Buildings at Risk
Risk Losses
Coconut Creek $3,061,603,270 $20,077,953 $2,701,953 $22,779,906 0.85%
Cooper City $1,943,657,150 $14,283,112 $945,406 $15,228,518 0.85%
Coral Springs $8,134,798,700 $50,443,688 $58,811,868 $59,255,556 0.81%
Dania Beach $1,878,435,580 $11,253,369 $4,220,747 $15,474,116 1.02%
Davie $6,711,031,880 $53,307,442 $6,752,467 $60,059,909 1.05%
December 2009 Page 98](https://image.slidesharecdn.com/browardcountylmsplandecember2009includesallappendices-100923163002-phpapp02/85/Local-Mitigation-Strategy-98-320.jpg)
![Broward County Emergency Management
Local Mitigation Strategy
December 2009
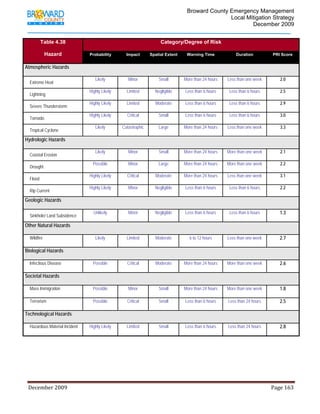
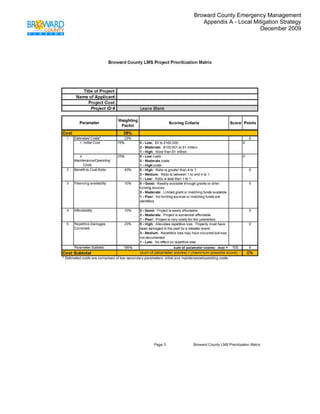
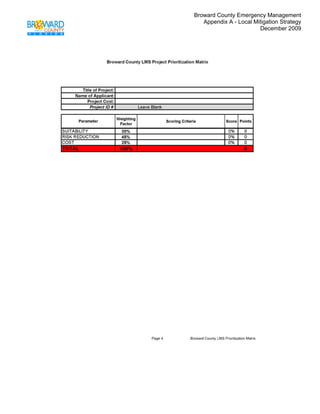
County Mitigation Task Force in gaining consensus on the determination of those
hazards that pose the most significant threat to Broward County based on a variety of
factors. The PRI is by no means scientific, but is rather meant to be utilized as an
objective planning tool for classifying and prioritizing hazard risks in Broward County
based on standardized criteria. Combined with the inventory of local assets and critical
facilities, the hazard profiles generated through the use of the PRI allows for the
prioritization of those high hazard risks for mitigation planning purposes, and more
specifically, the identification of hazard mitigation opportunities for the Broward County
Mitigation Task Force to consider as part of its proposed mitigation strategy.
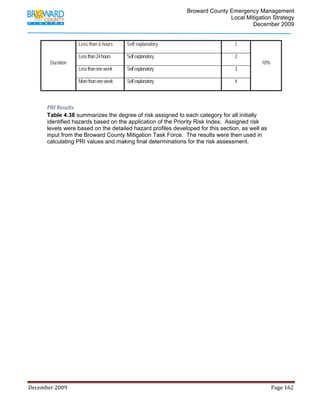
The application of the PRI results in numerical values that allow identified hazards to be
ranked against one another (the higher the PRI value, the greater the hazard risk). PRI
values are obtained by assigning varying degrees of risk to five categories for each
hazard (probability, impact, spatial extent, warning time and duration). Each degree of
risk has been assigned a value (1 to 4) and an agreed upon weighting factor16, as
summarized in Table 4.37. To calculate the PRI value for a given hazard, the assigned
risk value for each category is multiplied by the weighting factor. The sum of all five
categories equals the final PRI value, as demonstrated in the example equation below:
PRI VALUE = [(PROBABILITY x .30) + (IMPACT x .30) + (SPATIAL EXTENT x .20) + (WARNING TIME x .10) +
(DURATION x .10)]
According to the weighting scheme applied for Broward County, the highest possible PRI
value is 4.0. Prior to being finalized, PRI values for each identified hazard were reviewed
and accepted by the Broward County LMS Working Group.
16 The Broward County Mitigation Task Force, based upon any unique concerns of factors for the planning area, may also adjust the PRI weighting
scheme.
December 2009 Page 160](https://image.slidesharecdn.com/browardcountylmsplandecember2009includesallappendices-100923163002-phpapp02/85/Local-Mitigation-Strategy-160-320.jpg)
![Broward County Emergency Management
Local Mitigation Strategy
December 2009
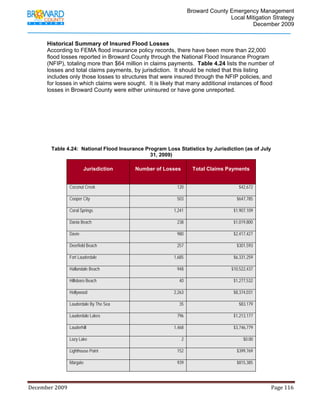
property, Flood Plain Development Permit Requirements, Flood Warning Systems
and Flood Hazard Information.
• Provide copies of Elevation Certificates when available, and Make Flood Zone
Determinations with the Special Flood Hazard Area Map.
• We continue to preserve approximately 1,134 acres in the Special Flood Hazard
Areas as open space.
• We continue to enforce the requirements that all new buildings must be elevated
above the crown of the road as shown in our City Ordinance.
• The Public Works Department has a Drainage System Maintenance Program for
the entire City.
• The Public Works Department provides site visits regarding Flooding, Drainage
and Storm Water related problems in order to address any issues and correct
them as required.
• We also have an Outreach Program to the Community thru Neighborhood
Meetings, Homeowners Association meetings, and information in our Website to
help and alert the residents and the business community about our Flood
Programs.
• Resolution 2005-23 that adopts the Broward County Local Mitigation Strategy is
updated on a yearly basis.
The City of Tamarac current Floodplain Management Ordinance reflects the latest FIRM
maps. As of May 2008 we have 15,557 number of flood policies. The last Community
Assistance Visit was on April 19, 2005 at which time the Insurance Service Office, Inc.
found no violations or other program deficiencies. The response letter dated May 25,
2005, addresses the questions raised from the ISO office on their original CAV of April
19, 2005.
For additional NFIP/CRS activities, please refer to Appendix G of our latest
Recertification Document.
West Park, City of
The City of West Park has been a participating NFIP community since 2006 and in good
standing. In 2005, we passed a Floodplain Management Ordinance that continues to
reflect the current FIRM maps. The designated Floodplain Manager is Calvin, Giordano
& Associates. Permitting in Special Flood Hazard Areas (SFHAs) is issued by Calvin,
Giordano & Associates.
A Community Assistance Visit (CAV) or Community Assistance Contact (CAC)] has not
been conducted since entering NFIP. As of May 2008, we have 5 NFIP policies in force.
Weston, City of
The City of Weston has been a CRS community since 5/1/2009. (Refer to Appendix G for
Approval Letter and Verification Report) Weston is currently a class 8. The city has
designated the Director of Public Works as the CRS Coordinator and Calvin, Giordano &
Associates as Floodplain Manager. CRS activities undertaken in the past year include:
• Review and Maintain Elevation Certificates on all new and substantially improved
buildings in our Special Flood Hazard Area.
December 2009 Page 188](https://image.slidesharecdn.com/browardcountylmsplandecember2009includesallappendices-100923163002-phpapp02/85/Local-Mitigation-Strategy-188-320.jpg)
![Broward County Emergency Management
Local Mitigation Strategy
December 2009
Chapter 6 – Plan Maintenance
Introduction
This Chapter of the LMS Plan describes the process that will ensure the Plan remains an
effective and relevant document over time. It also establishes the method and schedule
for monitoring, evaluating, and updating the LMS during a five-year plan update cycle. In
addition, the Chapter also describes how the public will continue to be involved in the
mitigation planning process.
Plan Maintenance Approach
• Incorporate hazard mitigation actions into existing planning mechanisms.
• Determine how mitigation projects and actions will be monitored.
• Establish indicators of effectiveness or success.
• Develop an evaluation/revision schedule to ensure plan is up-to-date at the end of
five-year cycle.
• Establish a process for public input and community involvement during the entire
five-year cycle.
FEMA Requirements
The LMS Working Group Planning Committee created the plan maintenance strategy
consistent with the process and steps presented in FEMA’s How-To-Guide: Bringing the
Plan to Life (FEMA 386-4) The following FEMA requirements are addressed in this
section:
• Requirement §201.6(c)(4)(i): [The plan maintenance process shall include a]
section describing the method and schedule of monitoring, evaluating, and
updating the mitigation plan with a five-year cycle.
• Requirement §201.6(c)(4)(ii): [The plan shall include a] process by which local
governments incorporate the requirements of the mitigation plan into other
planning mechanisms such as comprehensive or capital improvement plans,
where appropriate.
• Requirement §201.6(c)(4)(ii): [The plan maintenance process shall include a]
discussion on how the community will continue public participation in the plan
Implementation
Each municipality and Broward County is responsible for implementing mitigation actions
as prescribed in this plan. Under the direction of the LMS Executive Committee and the
coordination of the Broward County Emergency Management Division, funding will be
December 2009 Page 191](https://image.slidesharecdn.com/browardcountylmsplandecember2009includesallappendices-100923163002-phpapp02/85/Local-Mitigation-Strategy-191-320.jpg)


This document is Broward County's Local Mitigation Strategy (LMS) from December 2009. The LMS provides a risk assessment of hazards in Broward County and outlines initiatives to mitigate those risks. It examines Broward County's geography, demographics, economy, planning process, assets, hazards, and current mitigation efforts. The key hazards identified for Broward include hurricanes, flooding, wildfires, and human-caused threats like hazardous materials incidents. The LMS was developed through collaboration between Broward County Emergency Management and municipalities to reduce risks and prevent loss from future disasters.


