Loan portfolio manufacturing sme's statistical analysis
•
1 like•153 views

Probability of Default Model using SAS proc logistic

More Related Content
What's hot
What's hot (10)
Viewers also liked
Viewers also liked (18)
Similar to Loan portfolio manufacturing sme's statistical analysis
Similar to Loan portfolio manufacturing sme's statistical analysis (20)
Recently uploaded
Recently uploaded (20)
Loan portfolio manufacturing sme's statistical analysis
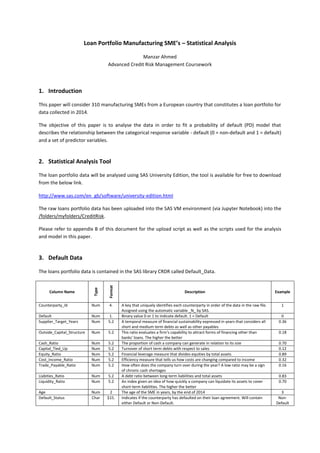
- 1. Loan Portfolio Manufacturing SME’s – Statistical Analysis Manzar Ahmed Advanced Credit Risk Management Coursework 1. Introduction This paper will consider 310 manufacturing SMEs from a European country that constitutes a loan portfolio for data collected in 2014. The objective of this paper is to analyse the data in order to fit a probability of default (PD) model that describes the relationship between the categorical response variable - default (0 = non-default and 1 = default) and a set of predictor variables. 2. Statistical Analysis Tool The loan portfolio data will be analysed using SAS University Edition, the tool is available for free to download from the below link. http://www.sas.com/en_gb/software/university-edition.html The raw loans portfolio data has been uploaded into the SAS VM environment (via Jupyter Notebook) into the /folders/myfolders/CreditRisk. Please refer to appendix B of this document for the upload script as well as the scripts used for the analysis and model in this paper. 3. Default Data The loans portfolio data is contained in the SAS library CRDR called Default_Data. Column Name Type Format Description Example Counterparty_Id Num 4. A key that uniquely identifies each counterparty in order of the data in the raw file. Assigned using the automatic variable _N_ by SAS. 1 Default Num 1. Binary value 0 or 1 to indicate default. 1 = Default 0 Supplier_Target_Years Num 5.2 A temporal measure of financial sustainability expressed in years that considers all short and medium term debts as well as other payables 0.36 Outside_Capital_Structure Num 5.2 This ratio evaluates a firm's capability to attract forms of financing other than banks' loans. The higher the better 0.18 Cash_Ratio Num 5.2 The proportion of cash a company can generate in relation to its size 0.70 Capital_Tied_Up Num 5.2 Turnover of short term debts with respect to sales 0.12 Equity_Ratio Num 5.2 Financial leverage measure that divides equities by total assets 0.89 Cost_Income_Ratio Num 5.2 Efficiency measure that tells us how costs are changing compared to income 0.32 Trade_Payable_Ratio Num 5.2 How often does the company turn over during the year? A low ratio may be a sign of chronic cash shortages 0.16 Liabities_Ratio Num 5.2 A debt ratio between long-term liabilities and total assets 0.83 Liquidity_Ratio Num 5.2 An index given an idea of how quickly a company can liquidate its assets to cover short-term liabilities. The higher the better 0.70 Age Num 2 The age of the SME in years, by the end of 2014 3 Default_Status Char $15. Indicates if the counterparty has defaulted on their loan agreement. Will contain either Default or Non-Default. Non- Default
- 2. 4. Data Analysis The data will be analysed using proc univariate, proc means and proc corr to get a look and feel for the data. 4.1 Proc Univariate The proc univariate procedure shows the distribution of the data, including the assessment of normality and discovery of outliers. In the var statement of the procedure all the predictor variables have been listed in order to get the feel for the data. The following is available from the proc univariate analysis: N, Mean, Standard Deviation, Skewness, Uncorrected Sum of Squares, Coefficient of Variation, Sum of Weights, Sum of Observations, Variance, Kurtosis, Corrected Sum of Squares and Standard Error of the Mean The UNIVARATE Procedure SupplierTargetYears OutsideCapitalStructure CashRatio CapitalTiedUp EquityRatio CostIncomeRatio TradePayablesRatio LiabilitiesRatio LiquidityRatio N 310 310 310 310 310 310 310 310 310 Mean 0.1974 0.5254 0.1265 0.0784 0.4342 0.2843 0.2407 0.6535 0.1211 Std Deviation 0.1601 0.2410 0.1018 0.0717 0.2599 0.1850 0.2083 0.2027 0.0982 Skewness 2.1444 -0.2262 1.8982 4.3089 0.3858 0.6971 1.0480 -0.5288 2.0616 Uncorrected SS 19.9969 103.4996 8.1618 3.4905 79.3137 35.6212 31.3595 145.0873 7.5213 Coeff Variation 81.1019 45.8652 80.4338 91.4701 59.8734 65.0720 86.5325 31.0113 81.0864 Sum Observations 61.1900 162.8600 39.2200 24.2900 134.5900 88.1200 74.6100 202.5900 37.5300 Variance 0.0256 0.0581 0.0104 0.0051 0.0676 0.0342 0.0434 0.0411 0.0096 Kurtosis 5.5300 -1.0363 4.6882 30.4751 -0.9059 0.2093 0.1134 -0.3641 5.7568 Corrected SS 7.9188 17.9403 3.1998 1.5873 20.8799 10.5724 13.4026 12.6915 2.9777 Std Error Mean 0.0091 0.0137 0.0058 0.0041 0.0148 0.0105 0.0118 0.0115 0.0056
- 3. 4.2 Proc Means The proc means procedure can be used analyse the mean, distribution and shape of the data by grouping the data on the response variable default (using the class statement). The results show that there is a significant difference in the mean and kurtosis of the predicator variables when grouped by counterparties which are status default and non-default. The results are as expected as we would expect the healthier counterparties to be different from the defaulted counterparties. The MEANS Procedure Default Status N Obs Variable Mean StdDev StdError Kurtosis Lower95% CLforMean Upper95% CLforMean Default 34 Supplier Target Years Outside Capital Structure Cash Ratio Capital Tied Up Equity Ratio Cost Income Ratio Trade Payable Ratio Liabilities Ratio Liquidity Ratio 0.294 0.655 0.094 0.118 0.298 0.331 0.270 0.768 0.093 0.150 0.165 0.088 0.076 0.223 0.171 0.179 0.159 0.086 0.026 0.028 0.015 0.013 0.038 0.029 0.031 0.027 0.015 -0.983 -0.207 2.164 -0.684 -0.083 -1.191 0.899 0.017 1.934 0.241 0.598 0.064 0.091 0.220 0.271 0.208 0.712 0.063 0.346 0.713 0.125 0.144 0.376 0.390 0.332 0.823 0.123 Non-Default 276 Supplier Target Years Outside Capital Structure Cash Ratio Capital Tied Up Equity Ratio Cost Income Ratio Trade Payable Ratio Liabilities Ratio Liquidity Ratio 0.186 0.509 0.130 0.074 0.451 0.279 0.237 0.639 0.124 0.157 0.244 0.103 0.070 0.260 0.186 0.212 0.203 0.099 0.009 0.015 0.006 0.004 0.016 0.011 0.013 0.012 0.006 7.475 -1.112 4.788 39.796 -0.912 0.443 0.101 -0.378 5.940 0.167 0.480 0.118 0.065 0.420 0.256 0.212 0.615 0.113 0.204 0.538 0.143 0.082 0.482 0.301 0.262 0.663 0.136
- 4. 4.3 Proc Corr The proc corr procedure can be used to analyse the correlation (Pearson’s correlation coefficient) between each predicator variables. The correlation cofficient will measure he lineasr dependence between each predicator variables to give a value between +1 and -1 inclusive, where 1 is total positive linear correlation, 0 is no linear correlation, and -1 is total negative linear correlation. The p-value tests if the correlation coefficient is significant (highlighted in red). 4.4 Pearson Correlation Coefficients The CORR Procedure Pearson Correlation Coefficients, N = 310 Prob > |r| under H0: Rho=0 SupplierTargetYears OutsideCapitalStructure CashRatio CapitalTiedUp EquityRatio CostIncomeRatio TradePayableRatio LiabilitiesRatio LiquidityRatio Supplier Target Years 1.00000 0.18792 0.0009 -0.18124 0.0014 0.34919 <.0001 -0.12503 0.0277 0.31932 <.0001 -0.16938 0.0028 0.13971 0.0138 -0.16088 0.0045 Outside Capital Structure 0.18792 0.0009 1.00000 -0.16005 0.0047 0.28974 <.0001 -0.45627 <.0001 -0.43969 <.0001 0.65225 <.0001 0.47682 <.0001 -0.11401 0.0449 Cash Ratio -0.18124 0.0014 -0.16005 0.0047 1.00000 -0.00434 0.9394 0.21627 0.0001 -0.07254 0.2028 0.13143 0.0206 -0.02776 0.6263 0.97047 <.0001 Capital Tied Up 0.34919 <.0001 0.28974 <.0001 -0.00434 0.9394 1.00000 -0.19404 0.0006 0.08843 0.1202 0.40803 <.0001 0.17815 0.0016 0.00605 0.9156 Equity Ratio -0.12503 0.0277 -0.45627 <.0001 0.21627 0.0001 -0.19404 0.0006 1.00000 0.24874 <.0001 -0.45780 <.0001 -0.92874 <.0001 0.18564 0.0010 Cost Income Ratio 0.31932 <.0001 -0.43969 <.0001 -0.07254 0.2028 0.08843 0.1202 0.24874 <.0001 1.00000 -0.50407 <.0001 -0.25646 <.0001 -0.07783 0.1717 Trade Payable Ratio -0.16938 0.0028 0.65225 <.0001 0.13143 0.0206 0.40803 <.0001 -0.45780 <.0001 -0.50407 <.0001 1.00000 0.47200 <.0001 0.15177 0.0074 Liabilities Ratio 0.13971 0.0138 0.47682 <.0001 -0.02776 0.6263 0.17815 0.0016 -0.92874 <.0001 -0.25646 <.0001 0.47200 <.0001 1.00000 0.02040 0.7205 Liquidity Ratio -0.16088 0.0045 -0.11401 0.0449 0.97047 <.0001 0.00605 0.9156 0.18564 0.0010 -0.07783 0.1717 0.15177 0.0074 0.02040 0.7205 1.00000
- 5. 4.5 Scatter Plot Matrix
- 6. 5. Probability of Default Model (PD) In this section the logistic regression function will be used to model the probability of default (PD) for the loans portfolio data. 5.1 The Logit Link Function The SAS proc logistic will be used to model the binary response variable default. The logit of the default will be used as the response in the regression equation: 𝐿𝑛 ( 𝑃 1 − 𝑃 ) = 𝛽0 + ∑ 𝛽𝑖 𝑥𝑖 10 𝑖=1 P is defined as the probability that Default = 1 (Default_Status = ‘Default’). The Xs are the predicator variables as follows: 𝑥1 Supplier Target Years 𝑥2 Outside Capital Structure 𝑥3 Cash Ratio 𝑥4 Capital Tied Up 𝑥5 Equity Ratio 𝑥6 Cost Income Ratio 𝑥7 Trader Payable Ratio 𝑥8 Liabilities Ratio 𝑥9 Liquidity Ratio 𝑥10 Age The SAS proc logistic procedure will be used to estimate the beta’s. 5.2 PD Model - Logit The full output for the proc logistic can be found in appendix 6.1. The summary of the PD model output is as follows: The binary logit model was used with Fisher’s scoring optimisation technique The model used 310 observations (counterparties) The probability model was for Default_Status = ‘Default’ The model convergence status shows it successfully converged to a solution Using a standard alpha criterion for significance of 0.05, the model is significant based on the likelihood ratio and score, since chi-square is < .0001 Testing Global Null Hypothesis: BETA=0 Test Chi- Square DF Pr > ChiSq Likelihood Ratio 39.3721 10 <.0001 Score 37.6438 10 <.0001 Wald 30.1195 10 0.0008
- 7. The Analysis of Maximum Likelihood Estimate table shows the estimates for beta in the logistic regression equation. The maximum likelihood estimate shows that the predicator variables are not significant at the 0.05 alpha level Analysis of Maximum Likelihood Estimates Parameter DF Estimate Standard Error Wald Chi- Square Pr > ChiSq Intercept 1 -11.0281 3.2990 11.1746 0.0008 Supplier_Target_Year 1 0.0976 1.5079 0.0042 0.9484 Outside_Capital_Stru 1 3.2529 1.3918 5.4624 0.0194 Cash_Ratio 1 -7.6011 22.5496 0.1136 0.7361 Capital_Tied_Up 1 5.3388 2.7314 3.8205 0.0506 Equity_Ratio 1 2.6575 2.4262 1.1997 0.2734 Cost_Income_Ratio 1 2.6339 1.4102 3.4886 0.0618 Trade_Payable_Ratio 1 -2.2046 1.5860 1.9321 0.1645 Liabilities_Ratio 1 7.0681 3.3923 4.3411 0.0372 Liquidity_Ratio 1 4.6822 22.7943 0.0422 0.8373 Age 1 0.2205 0.1934 1.2998 0.2542 The below table summarises the ability of the model to discriminate counterparties that will default on their loan agreement. A typical value to report is the concordance statistic, labelled c. This value indicates that 80% of the time the model is able to correctly predict counterparties that will default on their loan agreement. Association of Predicted Probabilities and Observed Responses Percent Concordant 80 Somers' D 0.6 Percent Discordant 20 Gamma 0.6 Percent Tied 0 Tau-a 0.118 Pairs 9384 c 0.8 The Hosmer-Lemeshow goodness of fit (GOF) test is a way to assess whether there is evidence for lack of fit in a regression model. Results from the proc logistic is, HL chi-square of 8.5784 with 8 df, yielding a p-value of 0.3791. As the p-value is greater than 0.05, it means we can reject the null hypothesis i.e. evidence for lack of fit.
- 8. 5.3 Final Model The beta estimates for the model are as follows: Beta Parameter Estimate 0 Intercept -11.0281 1 Supplier Target Year 0.0976 2 Outside Capital Structure 3.2529 3 Cash Ratio -7.6011 4 Capital Tied Up 5.3388 5 Equity Ratio 2.6575 6 Cost Income Ratio 2.6339 7 Trade Payable Ratio -2.2046 8 Liabilities Ratio 7.0681 9 Liquidity Ratio 4.6822 10 Age 0.2205 5.4 PD Calculation The SAS proc logistic procedure contains the outest option, which populates the beta’s into a sas dataset called Default_Data_Est. The below script generates the counterparty PD calculation into a new dataset called Counteryparty_PD.
- 9. 6. Appendix A 6.1 Proc Logistic Model Information Data Set CRDR.DEFAULT_DATA Response Variable Default_Status Default Status Number of Response Levels 2 Model binary logit Optimization Technique Fisher's scoring Number of Observations Read 310 Number of Observations Used 310 Response Profile Ordered Value Default_Status Total Frequency 1 Default 34 2 Non-Default 276 Probability modelled is Default_Status='Default'. Model Convergence Status Convergence criterion (GCONV=1E-8) satisfied. Model Fit Statistics Criterion Intercept Only Intercept and Covariates AIC 216.421 197.049 SC 220.158 238.151 -2 Log L 214.421 175.049 R-Square 0.1193 Max-rescaled R-Square 0.2389 Testing Global Null Hypothesis: BETA=0 Test Chi-Square DF Pr > ChiSq Likelihood Ratio 39.3721 10 <.0001 Score 37.6438 10 <.0001 Wald 30.1195 10 0.0008
- 10. Analysis of Maximum Likelihood Estimates Parameter DF Estimate Standard Error Wald Chi-Square Pr > ChiSq Intercept 1 -11.0281 3.2990 11.1746 0.0008 Supplier_Target_Year 1 0.0976 1.5079 0.0042 0.9484 Outside_Capital_Stru 1 3.2529 1.3918 5.4624 0.0194 Cash_Ratio 1 -7.6011 22.5496 0.1136 0.7361 Capital_Tied_Up 1 5.3388 2.7314 3.8205 0.0506 Equity_Ratio 1 2.6575 2.4262 1.1997 0.2734 Cost_Income_Ratio 1 2.6339 1.4102 3.4886 0.0618 Trade_Payable_Ratio 1 -2.2046 1.5860 1.9321 0.1645 Liabilities_Ratio 1 7.0681 3.3923 4.3411 0.0372 Liquidity_Ratio 1 4.6822 22.7943 0.0422 0.8373 Age 1 0.2205 0.1934 1.2998 0.2542 Odds Ratio Estimates Effect Point Estimate 95% Wald Confidence Limits Supplier_Target_Year 1.103 0.057 21.181 Outside_Capital_Stru 25.865 1.690 395.735 Cash_Ratio <0.001 <0.001 >999.999 Capital_Tied_Up 208.264 0.986 >999.999 Equity_Ratio 14.261 0.123 >999.999 Cost_Income_Ratio 13.928 0.878 220.913 Trade_Payable_Ratio 0.110 0.005 2.469 Liabilities_Ratio >999.999 1.521 >999.999 Liquidity_Ratio 108.003 <0.001 >999.999 Age 1.247 0.853 1.821 Association of Predicted Probabilities and Observed Responses Percent Concordant 80.0 Somers' D 0.600 Percent Discordant 20.0 Gamma 0.600 Percent Tied 0.0 Tau-a 0.118 Pairs 9384 c 0.800
- 11. Partition for the Hosmer and Lemeshow Test Group Total Default_Status = Default Default_Status = Non-Default Observed Expected Observed Expected 1 31 0 0.22 31 30.78 2 31 2 0.60 29 30.40 3 31 1 0.97 30 30.03 4 31 0 1.35 31 29.65 5 31 1 1.74 30 29.26 6 31 4 2.31 27 28.69 7 31 1 2.96 30 28.04 8 31 5 4.24 26 26.76 9 31 6 6.83 25 24.17 10 31 14 12.79 17 18.21 Hosmer and Lemeshow Goodness-of-Fit Test Chi-Square DF Pr > ChiSq 8.5784 8 0.3791 0.00 0.25 0.50 0.75 1.00 Sensitivity 0.00 0.25 0.50 0.75 1.00 1 - Specificity ROC Curve for M odel AreaUnder theCurve= 0.8002
- 12. Influence Diagnostics DefaultNon-DefaultDefault_Status -2 -1 0 1 2 3 StdizedDevianceResidual -2 0 2 4 6 StdizedPearsonResidual -1 0 1 2 3 DevianceResidual -2 0 2 4 6 PearsonResidual 0 100 200 300 CaseNumber 0 100 200 300 CaseNumber Influence Diagnostics DefaultNon-DefaultDefault_Status 0.0 0.2 0.4 0.6 0.8 CIDisplacementsCBar 0.00 0.25 0.50 0.75 1.00 1.25 CIDisplacementsC 0.0 0.1 0.2 0.3 0.4 0.5 Leverage -2 -1 0 1 2 3 LikelihoodResidual 0 100 200 300 CaseNumber 0 100 200 300 CaseNumber
- 13. Influence Diagnostics DefaultNon-DefaultDefault_Status 0 2 4 6 8 DevianceDeletionDifference 0 10 20 30 40 Chi-squareDeletionDifference 0 100 200 300 CaseNumber 0 100 200 300 CaseNumber Influence Diagnostics DefaultNon-DefaultDefault_Status DfBetas Cash_RatioOutside_Capital_Structure Supplier_Target_YearsIntercept -0.2 0.0 0.2 0.4 -0.2 0.0 0.2 0.4 0 100 200 300 CaseNumber 0 100 200 300 CaseNumber
- 14. Influence Diagnostics DefaultNon-DefaultDefault_Status DfBetas Trade_Payable_RatioCost_Income_Ratio Equity_RatioCapital_Tied_Up -0.75 -0.50 -0.25 0.00 0.25 0.50 -0.75 -0.50 -0.25 0.00 0.25 0.50 0 100 200 300 CaseNumber 0 100 200 300 CaseNumber Influence Diagnostics DefaultNon-DefaultDefault_Status DfBetas AgeLiquidity_Ratio Liabilities_Ratio -0.4 -0.2 0.0 0.2 -0.4 -0.2 0.0 0.2 0 100 200 300 CaseNumber 0 100 200 300 CaseNumber
- 15. PredictedProbability Diagnostics DefaultNon-DefaultDefault_Status 0.0 0.1 0.2 0.3 0.4 0.5 Leverage 0.00 0.25 0.50 0.75 1.00 1.25 CIDisplacementsC 0 2 4 6 8 DevianceDeletionDifference 0 10 20 30 40 Chi-squareDeletionDifference 0.0 0.2 0.4 0.6 0.8 Predicted Probability 0.0 0.2 0.4 0.6 0.8 Predicted Probability Leverage Diagnostics DefaultNon-DefaultDefault_Status 0.0 0.2 0.4 0.6 0.8 PredictedProbability 0.00 0.25 0.50 0.75 1.00 1.25 CIDisplacementsC 0 2 4 6 8 DevianceDeletionDifference 0 10 20 30 40 Chi-squareDeletionDifference 0.0 0.1 0.2 0.3 0.4 0.5 Leverage 0.0 0.1 0.2 0.3 0.4 0.5 Leverage
- 16. Influence onthe M odel Fit andParameter Estimates DefaultNon-DefaultDefault_Status 0.25 0.50 0.75 1.00 1.25 CIDisplacementC 0.0 0.2 0.4 0.6 0.8 Predicted Probability 0 2 4 6 8 DevianceDifference 0.0 0.2 0.4 0.6 0.8 Predicted Probability 0 10 20 30 40 PearsonChi-SquareDifference 0.00 0.25 0.50 0.75 1.00 Probability 0 2.5E-1 5E-1 7.5E-1 1E0 Supplier Target Years PredictedObserved PredictedProbabilitiesfor Default_Status=Default with95% Confidence Limits At Outside_Capital_Structure=0.525Cash_Ratio=0.127Capital_Tied_Up=0.078Equity_Ratio=0.434 Cost_Income_Ratio=0.284Trade_Payable_Ratio=0.241Liabilities_Ratio=0.654Liquidity_Ratio=0.121Age=2.758
- 17. 7. Appendix B 7.1 Data Step to Create Default Data
- 18. 7.2 Proc Univariate 7.3 Proc Means
- 19. 7.4 Proc Corr 7.5 Proc Logistic