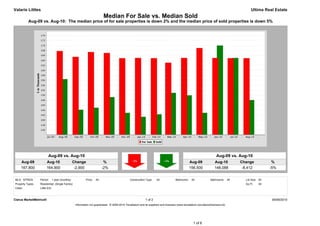
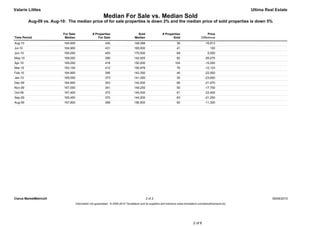
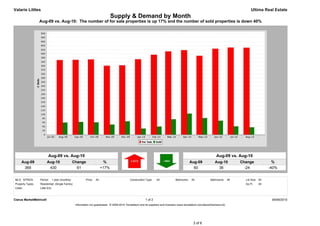
Valarie Littles                                                                                                                                                                              Ultima Real Estate
                                                                          Median For Sale vs. Median Sold
          Aug-09 vs. Aug-10: The median price of for sale properties is down 2% and the median price of sold properties is down 5%


                         Aug-09 vs. Aug-10                                                                                                                            Aug-09 vs. Aug-10
     Aug-09            Aug-10                     Change                   %                                                                     Aug-09             Aug-10             Change             %
     167,800           164,900                     -2,900                 -2%                                                                    156,500            148,088             -8,412           -5%


MLS: NTREIS       Period:      1 year (monthly)            Price:   All                        Construction Type:    All             Bedrooms:    All            Bathrooms:      All     Lot Size: All
Property Types:   Residential: (Single Family)                                                                                                                                           Sq Ft:    All
Cities:           Little Elm


Clarus MarketMetrics®                                                                                       1 of 2                                                                                        09/06/2010
                                                   Information not guaranteed. © 2009-2010 Terradatum and its suppliers and licensors (www.terradatum.com/about/licensors.td).


                                                                                                                                                   1 of 6
Valarie Littles                                                                                                                                                    Ultima Real Estate
                                                           Median For Sale vs. Median Sold
         Aug-09 vs. Aug-10: The median price of for sale properties is down 2% and the median price of sold properties is down 5%

                          For Sale                # Properties                         Sold                 # Properties                        Price
Time Period                Median                     For Sale                       Median                        Sold                    Difference
Aug-10                    164,900                            430                    148,088                            36                     -16,813
Jul-10                    164,900                            431                    165,000                            41                         100
Jun-10                    165,000                            425                    170,000                            69                       5,000
May-10                    169,000                            390                    142,925                            82                     -26,075
Apr-10                    165,000                            418                    150,000                           104                     -15,000
Mar-10                    163,100                            412                    150,978                            76                     -12,123
Feb-10                    164,900                            395                    142,350                            40                     -22,550
Jan-10                    165,000                            373                    141,350                            30                     -23,650
Dec-09                    164,900                            343                    142,930                            66                     -21,970
Nov-09                    167,000                            341                    149,250                            50                     -17,750
Oct-09                    167,400                            372                    145,000                            61                     -22,400
Sep-09                    165,450                            370                    144,200                            63                     -21,250
Aug-09                    167,800                            369                    156,500                            60                     -11,300


Clarus MarketMetrics®                                                                         2 of 2                                                                         09/06/2010
                                     Information not guaranteed. © 2009-2010 Terradatum and its suppliers and licensors (www.terradatum.com/about/licensors.td).


                                                                                                                                     2 of 6
Valarie Littles                                                                                                                                                                              Ultima Real Estate
                                                                                 Supply & Demand by Month
                  Aug-09 vs. Aug-10: The number of for sale properties is up 17% and the number of sold properties is down 40%


                         Aug-09 vs. Aug-10                                                                                                                            Aug-09 vs. Aug-10
     Aug-09             Aug-10                    Change                   %                                                                     Aug-09              Aug-10            Change              %
      369                430                        61                    +17%                                                                     60                  36                -24             -40%


MLS: NTREIS       Period:      1 year (monthly)            Price:   All                        Construction Type:    All             Bedrooms:    All            Bathrooms:      All     Lot Size: All
Property Types:   Residential: (Single Family)                                                                                                                                           Sq Ft:    All
Cities:           Little Elm


Clarus MarketMetrics®                                                                                       1 of 2                                                                                        09/06/2010
                                                   Information not guaranteed. © 2009-2010 Terradatum and its suppliers and licensors (www.terradatum.com/about/licensors.td).


                                                                                                                                                   3 of 6
Valarie Littles                                                                                                                                                      Ultima Real Estate
                                                                   Supply & Demand by Month
                Aug-09 vs. Aug-10: The number of for sale properties is up 17% and the number of sold properties is down 40%

                        # Properties              Average DOM                    # Properties               Average DOM
Time Period                 For Sale                   For Sale                         Sold                        Sold
Aug-10                          430                             95                           36                          91
Jul-10                          431                            111                           41                          54
Jun-10                          425                            125                           69                          45
May-10                          390                            159                           82                          66
Apr-10                          418                            157                         104                           55
Mar-10                          412                            161                           76                          54
Feb-10                          395                            169                           40                          67
Jan-10                          373                            182                           30                          61
Dec-09                          343                            198                           66                          66
Nov-09                          341                            201                           50                          71
Oct-09                          372                            192                           61                          50
Sep-09                          370                            189                           63                          52
Aug-09                          369                            190                           60                          89


Clarus MarketMetrics®                                                                             2 of 2                                                                       09/06/2010
                                       Information not guaranteed. © 2009-2010 Terradatum and its suppliers and licensors (www.terradatum.com/about/licensors.td).


                                                                                                                                       4 of 6
Valarie Littles                                                                                                                                                                           Ultima Real Estate
                                                                              Months Supply of Inventory
                                                    Aug-09 vs. Aug-10: The average months supply of inventory is up 135%


                                                                                   Aug-09 vs. Aug-10
                  Aug-09                                             Aug-10                                         Change                                             %
                   4.0                                                9.5                                             5.5                                            +135%


MLS: NTREIS       Period:      1 year (monthly)           Price:   All                        Construction Type:    All            Bedrooms:    All             Bathrooms:      All   Lot Size: All
Property Types:   Residential: (Single Family)                                                                                                                                        Sq Ft:    All
Cities:           Little Elm


Clarus MarketMetrics®                                                                                      1 of 2                                                                                     09/06/2010
                                                  Information not guaranteed. © 2009-2010 Terradatum and its suppliers and licensors (www.terradatum.com/about/licensors.td).


                                                                                                                                                  5 of 6
Valarie Littles                                                                                                                                                            Ultima Real Estate
                                                                         Months Supply of Inventory
                                               Aug-09 vs. Aug-10: The average months supply of inventory is up 135%

                          # Units For Sale          # UC Units                                   UC Average
Time Period             Last Day of Month         During Month                      MSI                DOM
Aug-10                      342                                 36                   9.5                       65
Jul-10                      347                                 44                   7.9                       79
Jun-10                      331                                 56                   5.9                       72
May-10                      316                                 33                   9.6                       49
Apr-10                      281                               103                    2.7                       61
Mar-10                      289                                 93                   3.1                       51
Feb-10                      290                                 79                   3.7                       63
Jan-10                      281                                 57                   4.9                       57
Dec-09                      268                                 38                   7.1                       63
Nov-09                      278                                 38                   7.3                       54
Oct-09                      272                                 63                   4.3                       67
Sep-09                      267                                 65                   4.1                       58
Aug-09                      263                                 65                   4.0                       60


Clarus MarketMetrics®                                                                                 2 of 2                                                                         09/06/2010
                                             Information not guaranteed. © 2009-2010 Terradatum and its suppliers and licensors (www.terradatum.com/about/licensors.td).


                                                                                                                                             6 of 6

Little Elm TX - Housing Market Report - August 2010

  • 1.
    Valarie Littles Ultima Real Estate Median For Sale vs. Median Sold Aug-09 vs. Aug-10: The median price of for sale properties is down 2% and the median price of sold properties is down 5% Aug-09 vs. Aug-10 Aug-09 vs. Aug-10 Aug-09 Aug-10 Change % Aug-09 Aug-10 Change % 167,800 164,900 -2,900 -2% 156,500 148,088 -8,412 -5% MLS: NTREIS Period: 1 year (monthly) Price: All Construction Type: All Bedrooms: All Bathrooms: All Lot Size: All Property Types: Residential: (Single Family) Sq Ft: All Cities: Little Elm Clarus MarketMetrics® 1 of 2 09/06/2010 Information not guaranteed. © 2009-2010 Terradatum and its suppliers and licensors (www.terradatum.com/about/licensors.td). 1 of 6
  • 2.
    Valarie Littles Ultima Real Estate Median For Sale vs. Median Sold Aug-09 vs. Aug-10: The median price of for sale properties is down 2% and the median price of sold properties is down 5% For Sale # Properties Sold # Properties Price Time Period Median For Sale Median Sold Difference Aug-10 164,900 430 148,088 36 -16,813 Jul-10 164,900 431 165,000 41 100 Jun-10 165,000 425 170,000 69 5,000 May-10 169,000 390 142,925 82 -26,075 Apr-10 165,000 418 150,000 104 -15,000 Mar-10 163,100 412 150,978 76 -12,123 Feb-10 164,900 395 142,350 40 -22,550 Jan-10 165,000 373 141,350 30 -23,650 Dec-09 164,900 343 142,930 66 -21,970 Nov-09 167,000 341 149,250 50 -17,750 Oct-09 167,400 372 145,000 61 -22,400 Sep-09 165,450 370 144,200 63 -21,250 Aug-09 167,800 369 156,500 60 -11,300 Clarus MarketMetrics® 2 of 2 09/06/2010 Information not guaranteed. © 2009-2010 Terradatum and its suppliers and licensors (www.terradatum.com/about/licensors.td). 2 of 6
  • 3.
    Valarie Littles Ultima Real Estate Supply & Demand by Month Aug-09 vs. Aug-10: The number of for sale properties is up 17% and the number of sold properties is down 40% Aug-09 vs. Aug-10 Aug-09 vs. Aug-10 Aug-09 Aug-10 Change % Aug-09 Aug-10 Change % 369 430 61 +17% 60 36 -24 -40% MLS: NTREIS Period: 1 year (monthly) Price: All Construction Type: All Bedrooms: All Bathrooms: All Lot Size: All Property Types: Residential: (Single Family) Sq Ft: All Cities: Little Elm Clarus MarketMetrics® 1 of 2 09/06/2010 Information not guaranteed. © 2009-2010 Terradatum and its suppliers and licensors (www.terradatum.com/about/licensors.td). 3 of 6
  • 4.
    Valarie Littles Ultima Real Estate Supply & Demand by Month Aug-09 vs. Aug-10: The number of for sale properties is up 17% and the number of sold properties is down 40% # Properties Average DOM # Properties Average DOM Time Period For Sale For Sale Sold Sold Aug-10 430 95 36 91 Jul-10 431 111 41 54 Jun-10 425 125 69 45 May-10 390 159 82 66 Apr-10 418 157 104 55 Mar-10 412 161 76 54 Feb-10 395 169 40 67 Jan-10 373 182 30 61 Dec-09 343 198 66 66 Nov-09 341 201 50 71 Oct-09 372 192 61 50 Sep-09 370 189 63 52 Aug-09 369 190 60 89 Clarus MarketMetrics® 2 of 2 09/06/2010 Information not guaranteed. © 2009-2010 Terradatum and its suppliers and licensors (www.terradatum.com/about/licensors.td). 4 of 6
  • 5.
    Valarie Littles Ultima Real Estate Months Supply of Inventory Aug-09 vs. Aug-10: The average months supply of inventory is up 135% Aug-09 vs. Aug-10 Aug-09 Aug-10 Change % 4.0 9.5 5.5 +135% MLS: NTREIS Period: 1 year (monthly) Price: All Construction Type: All Bedrooms: All Bathrooms: All Lot Size: All Property Types: Residential: (Single Family) Sq Ft: All Cities: Little Elm Clarus MarketMetrics® 1 of 2 09/06/2010 Information not guaranteed. © 2009-2010 Terradatum and its suppliers and licensors (www.terradatum.com/about/licensors.td). 5 of 6
  • 6.
    Valarie Littles Ultima Real Estate Months Supply of Inventory Aug-09 vs. Aug-10: The average months supply of inventory is up 135% # Units For Sale # UC Units UC Average Time Period Last Day of Month During Month MSI DOM Aug-10 342 36 9.5 65 Jul-10 347 44 7.9 79 Jun-10 331 56 5.9 72 May-10 316 33 9.6 49 Apr-10 281 103 2.7 61 Mar-10 289 93 3.1 51 Feb-10 290 79 3.7 63 Jan-10 281 57 4.9 57 Dec-09 268 38 7.1 63 Nov-09 278 38 7.3 54 Oct-09 272 63 4.3 67 Sep-09 267 65 4.1 58 Aug-09 263 65 4.0 60 Clarus MarketMetrics® 2 of 2 09/06/2010 Information not guaranteed. © 2009-2010 Terradatum and its suppliers and licensors (www.terradatum.com/about/licensors.td). 6 of 6