The document compares median home prices and housing inventory statistics from April 2009 to April 2010 in Heath, Texas. It shows that the median price of homes for sale decreased by 13% while the median price of homes sold decreased by 17% in that period. The number of homes for sale decreased by 2% while the number of homes sold decreased by 27%. Additionally, the average months of inventory decreased by 4%.
The document compares housing market data from April 2009 to April 2010 in Corinth, Texas. It states that the median price of for-sale properties increased 1% while the median price of sold properties rose 16%. The number of for-sale properties decreased 8% and the number of properties sold decreased 7%. Additionally, the average months supply of inventory, a measure of housing demand and supply balance, increased 27% from April 2009 to April 2010.
The document compares housing market data from May 2009 to May 2010 in Farmers Branch, Texas. It states that the median price of for-sale properties increased by 8%, while the median price of sold properties decreased by 5%. The number of for-sale properties rose by 13%, but the number of sold properties fell by 9%. Additionally, the average months of inventory increased by 85% from 4.3 months to 7.9 months.
The document contains real estate data for Murphy, Texas comparing April 2009 to April 2010. It shows that the median price of for-sale properties decreased 4% while the median price of sold properties decreased 23%. The number of for-sale properties increased 5% while the number of properties sold decreased 45%. Additionally, the average months supply of inventory decreased 35% from 4.6 months in April 2009 to 3 months in April 2010.
The median price of for sale properties in March 2010 was unchanged from March 2009 at $214,900. However, the median price of sold properties decreased 3% from $185,609 in March 2009 to $180,000 in March 2010. Additionally, the number of for sale properties decreased 4% from 501 in March 2009 to 483 in March 2010, while the number of sold properties remained unchanged at 49.
The median price of for-sale properties in May 2010 was down 11% from May 2009, while the median price of sold properties was up 20%. The number of for-sale properties increased 2% from 168 in May 2009 to 171 in May 2010, while the number of sold properties remained unchanged at 9. The average months supply of inventory decreased 53% from 20.9 months in May 2009 to 9.8 months in May 2010.
The median price of for-sale properties decreased 3% from May 2009 to May 2010, while the median price of sold properties decreased 10% over the same period. The number of for-sale properties decreased 14% from 143 in May 2009 to 123 in May 2010, while the number of sold properties increased 4% from 24 to 25 over the same period. Additionally, the average months supply of inventory, a measure of housing demand and supply balance, increased 36% from 5.3 months in May 2009 to 7.2 months in May 2010.
The document compares median home prices and housing inventory from April 2009 to April 2010 in Mckinney, Texas. It finds that the median price of homes for sale decreased 5% while the median price of homes sold increased 2%. The number of homes for sale decreased 8% and the number of homes sold decreased 6%. Additionally, the average months of inventory decreased 12%.
The median price of for-sale properties in March 2010 was down 5% from March 2009, while the median price of sold properties was up 11%. The number of for-sale properties decreased by 8% from March 2009 to March 2010, and the number of sold properties decreased by 6% over the same period.
The document compares median home prices and housing inventory in April 2009 to April 2010 in Frisco, Texas. It finds that the median price of for-sale homes decreased 2% from $300,000 to $295,000 while the median price of sold homes decreased 7% from $241,500 to $225,000 over this period. The number of for-sale homes decreased 1% from 1,486 to 1,475 homes, while the number of homes sold decreased slightly from 202 to 201. The average months of inventory decreased 19% from 5.5 to 4.5 months.
The document contains information about the real estate market in Rockwall, Texas from April 2009 to April 2010. It shows that the median price of for-sale properties decreased 2% from $219,450 to $214,900 while the median price of sold properties decreased 3% from $195,000 to $188,588 over this period. The number of for-sale properties increased 2% from 496 to 507 units while the number of properties sold remained the same at 37 units. Additionally, the average months supply of inventory decreased 3% from 7.1 to 6.9 months.
- The median price of for-sale properties increased 1% from May 2009 to May 2010, while the median price of sold properties decreased 9% over the same period.
- The number of for-sale properties decreased 5% from May 2009 to May 2010, while the number of sold properties increased 45% over the same period.
- The average months supply of inventory, a measure of how long it will take to sell current for-sale inventory, increased 140% from May 2009 to May 2010.
The document compares housing market data from June 2009 to June 2010 in Heath, Texas. It finds that the median price of for-sale properties decreased 2% while the median price of sold properties increased 14%. The number of for-sale properties rose 3% and the number of sold properties increased 73%. Additionally, the average months of inventory increased 49%.
The document compares real estate data from April 2009 to April 2010 in Carrollton, Texas. It finds that the median price of for-sale properties was unchanged, while the median price of sold properties increased 10%. The number of for-sale properties increased 13% and the number of sold properties rose 6%. Additionally, the average months of inventory decreased 11%.
The median price of for-sale properties in March 2010 was down 8% from March 2009, while the median price of sold properties was up 3%. The number of for-sale properties was down 6% from March 2009 to March 2010, and the number of sold properties was down 1%. The document provides data on median prices and number of units for both for-sale and sold residential properties in Allen, Texas from March 2009 to March 2010.
The document summarizes real estate data for Allen, Texas from April 2009 to April 2010. It shows that the median price of for-sale properties decreased 4% from April 2009 to April 2010, while the median price of sold properties increased 3% in that time period. The number of for-sale properties decreased 1% from 677 to 672 units, while the number of sold properties increased 5% from 114 to 120 units. Additionally, the average months supply of inventory, a measure of housing demand and supply, increased 9% from 3.4 to 3.8 months over the one-year period.
The median price of for-sale properties in May 2010 was down 5% from May 2009, and the median price of sold properties was down 3%. The number of for-sale properties was down 2% from May 2009 to May 2010, while the number of sold properties was down 6%. Additionally, the average months supply of inventory was up 7% from May 2009 to May 2010.
The median price of for-sale properties in March 2010 was down 2% from March 2009, and the median price of sold properties was down 3%. The number of for-sale properties was down 3% from March 2009 to March 2010, while the number of sold properties was down 9%. The document provides data on housing prices and supply/demand in the city of Frisco from March 2009 to March 2010.
The document compares housing market data from June 2009 to June 2010 in Corinth, Texas. It states that the median price of for-sale properties decreased 3% while the median price of sold properties increased 5%. The number of for-sale properties decreased 2% and the number of sold properties decreased 21%. Additionally, the average months of inventory increased 91% from 4.3 to 8.2 months.
The document compares housing market data from April 2009 to April 2010 in Forney, Texas. It states that the median price of for-sale properties decreased 3% while the median price of sold properties increased 14%. Additionally, the number of for-sale properties increased 12% while the number of properties sold decreased 8%. Finally, the average months supply of inventory decreased 4% over this time period.
The document compares housing market data from June 2009 to June 2010 in Murphy, Texas. It states that the median price of for-sale properties decreased 5% while the median price of sold properties increased 4%. The number of for-sale properties decreased 13% and the number of sold properties increased 19%. Additionally, the average months of inventory increased 39% from 3.5 to 4.8 months.
The median price of for-sale properties in March 2010 decreased 4% from March 2009, while the median price of sold properties increased 1%. The number of for-sale properties increased 8% from March 2009 to March 2010, while the number of sold properties decreased 4%. Additionally, the average months of inventory increased 12% from March 2009 to March 2010.
The document compares housing data from May 2009 to May 2010 in The Colony, Texas. It states that the median price of for-sale properties was unchanged, while the median price of sold properties increased 6%. The number of for-sale properties decreased 16% while the number of sold properties rose 4%. Additionally, the average months of inventory increased 93% from 3.7 to 7.1 months.
The document compares median home prices and housing inventory levels in April 2009 to April 2010 in Plano, Texas. It finds that the median price of homes for sale decreased 4% while the median price of homes sold decreased 5%. The number of homes for sale increased 11% and the number of homes sold increased 9%. Additionally, the average months of inventory increased 21%.
The document compares housing data from April 2009 to April 2010 in The Colony. It shows that the median price of for-sale properties decreased 2% while the median price of sold properties increased 10%. The number of for-sale properties increased 6% while the number of properties sold decreased 25%. Additionally, the average months supply of inventory, a measure of housing demand and supply balance, increased 43% from April 2009 to April 2010.
The document compares housing market data from April 2009 to April 2010 in Heartland. It shows that:
- The median price of for-sale properties increased 6% while the median price of sold properties rose 16%.
- The number of for-sale properties was up 26% whereas the number of properties sold declined 38%.
- The average months supply of inventory, a measure of how long it will take to sell all listed homes, increased 53% from 2.8 months to 4.2 months.
The document summarizes real estate data for Rowlett, Texas from April 2009 to April 2010. It states that the median price of for-sale properties increased 3% from $159,945 to $164,950 while the median price of sold properties rose 8% from $129,900 to $140,000 over this period. The number of for-sale properties decreased slightly by 2 units but the number of properties sold declined by 2%. The average months of inventory increased 10% from 3.7 to 4.1 months.
The median price of for-sale properties in May 2010 was up 1% from May 2009, while the median price of sold properties was down 8%. The number of for-sale properties decreased 7% from May 2009 to May 2010, while the number of sold properties increased 9%. Additionally, the average months supply of inventory increased 52% from May 2009 to May 2010.
The document compares housing market data from May 2009 to May 2010 in Carrollton, Texas. It shows that the median price of for-sale properties was unchanged, while the median price of sold properties decreased by 4%. The number of for-sale properties decreased by 2% and the number of sold properties also decreased by 2%. Additionally, the average months of inventory increased by 84% from 4.1 months to 7.6 months.
The document lists culinary classes being offered in September by Now We're Cookin' in Evanston, Illinois. There are classes on knife skills and decorative garnishes, canning and preserving fruits, cooking dishes using seasonal farmers market ingredients, Italian cuisine for the Feast of San Gennaro, designing apple pies, and another farmers market cooking class. All classes are hands-on, held evenings and some include meals. Advance registration is required on the website or by phone.
This document provides an overview of opportunities for becoming an Allstate Exclusive Agent. It discusses the benefits of working with Allstate such as brand recognition, education programs, and support services. It outlines requirements for becoming an agent, options for purchasing an existing agency or starting a new one, and considerations for evaluating and running an agency business. The document also reviews Allstate's compensation structure and programs that reward high-performing agencies.
Classrooms in a connected world philly tech weekMeenoo Rami
This document discusses connecting classrooms to the world through modeling relevant learning, finding audiences to empower students, and providing additional resources like websites and hashtags to help students thrive and engage in education. It also includes contact information for Meenoo Rami who works to connect classrooms.
Public Engagement: Survive and Thrive in a Bigger Society Vol. 3Edelman Digital
The third volume of Edelman’s annual publication, Public Engagement: Survive and Thrive in a Bigger Society, is a collection of thought pieces written by the UK team in which we continue to explore the shifting media, thought and working landscapes that we inhabit, as well as the increasingly complex relationship between businesses, brands, government, the media and society.
Rachel Melia is an online marketing consultant with over 14 years of experience working with major companies. She gave a presentation on social media marketing which included an overview of key platforms like Facebook, Twitter, LinkedIn and YouTube. For each platform, she provided statistics on user numbers and engagement as well as best practices for companies to utilize the platforms for marketing purposes. She also discussed blogging, geo-location marketing and tools for measuring social media marketing efforts. The presentation aimed to educate attendees on utilizing various social media channels for interactive marketing.
The document contains information from a real estate report comparing housing market statistics from May 2009 to May 2010 in Richardson, Texas. It states that the median price of for-sale properties decreased 2% from May 2009 to May 2010, while the median price of sold properties decreased 7% in that period. Additionally, the number of for-sale properties increased 17% from May 2009 to May 2010, while the number of sold properties decreased 7%. Finally, the average months supply of inventory, a measure of housing demand and supply, increased 144% from May 2009 to May 2010.
Providence Village TX - Housing Market Report - August 2010Valarie Littles
The document compares housing market data from August 2009 to August 2010 in Providence Village. It finds that the median price of for-sale properties increased 2% while the median price of sold properties decreased 2%. Additionally, the number of for-sale properties rose 37% while the number of sold properties fell 45%. Finally, the average months of inventory increased 125% from 4.0 to 9.0 months.
The document discusses Meenoo Rami, an English teacher at Science Leadership Academy in Philadelphia. It provides statistics from surveys of her students that show they are part of the Millennial generation, who are highly technology literate and use computers and cell phones regularly. The surveys found that most students want to use technology more in school and believe computer proficiency is important. The document also discusses how Rami uses blogs and social media like Twitter to connect with students and other teachers for professional development opportunities.
Providence Village TX - Housing Market Report - November 2010Valarie Littles
The document compares housing market data from November 2009 to November 2010 in Providence Village. It finds that:
1) The median price of homes for sale increased 2% while the median price of homes sold decreased 14%.
2) The number of homes for sale increased 56% while the number of homes sold decreased 50%.
3) The document provides a table showing housing supply and demand metrics for the area over a 12 month period from November 2009 to November 2010.
Climate change impact in coastal areas of the Rio de la Plata River, Actions ...IIED
This document summarizes the key findings of a project studying climate change impacts in coastal areas of the Rio de la Plata River. The project used a participatory approach, training local stakeholders to identify vulnerable areas and understand risk perception. Modeling found housing damage costs could increase by 20-33% due to climate change. The study also identified institutional barriers to adaptation, including a lack of integration between climate and development planning, limited technical capacity, and tensions between scientific and local information needs. However, opportunities exist to address these barriers through community involvement, improved urban planning, and raising awareness among decision-makers.
Richardson TX - January 2011 - Housing Market ReportValarie Littles
The document compares housing market data from January 2010 to January 2011 in Richardson, Texas. It shows that the median price of for-sale properties was unchanged, while the median price of sold properties decreased by 17%. The number of for-sale properties increased by 33%, while the number of properties sold decreased by 33%.
Equity workshop: Safeguards and standards for equity in redd+IIED
Safeguards and standards for equity in REDD+
A presentation by Phil Franks, IIED/REDD+ SES Secretariat
This presentation was given at the Expert Workshop on Equity, Justice and Well-being in Ecosystem Governance, held at the International Institute for Environment and Development (IIED) in London, March, 2015.
The document summarizes real estate data from May 2009 to May 2010 in Plano, Texas. It states that the median price of for-sale properties decreased 2% from May 2009 to May 2010, while the median price of sold properties increased 6% in that period. The number of for-sale properties decreased 0% while the number of sold properties decreased 10%. Additionally, the average months of inventory increased 99% from May 2009 to May 2010.
Farmers Branch TX - June 2010 - Market ReportValarie Littles
The document compares housing market data from June 2009 to June 2010 in Farmers Branch, Texas. It reports that:
- The median price of for-sale properties increased 2% while the median price of sold properties increased 38%.
- The number of for-sale properties increased 5% while the number of sold properties also increased 5%.
- The average months of inventory increased 60%, rising from 4.5 months in June 2009 to 7.2 months in June 2010.
This document introduces an opportunity manager app for Salesforce that provides powerful features to help users manage opportunities. The app allows users to view all opportunities on a single page, update records quickly, and view opportunities distributed by stage. It also introduces info-graphics tools to display data via interactive charts. The app aims to minimize time spent on records while providing a consolidated and compact view of opportunities.
[POMP FORUM 2015] ZAKAJ NA PODROČJU JAVNEGA IN STRATEŠKEGA KOMUNICIRANJA VRE?...PM, poslovni mediji
8 let, 40 držav, revolucionarni premiki in po rezultatih raziskave je Slovenija na dnu Evrope. V svetu se odvija temeljno preoblikovanje javnega in strateškega komuniciranja, Slovenci pa … nič! A za vsakim problemom se skriva rešitev. Vas zanima, kakšna?
Allen TX - January 2011 - Housing Market ReportValarie Littles
The document compares housing market data from January 2010 to January 2011 in Allen, Texas. It finds that:
- The median price of homes for sale decreased 5% while the median price of homes sold increased 6% between January 2010 and January 2011.
- The number of homes for sale increased 7% while the number of homes sold increased 5% between January 2010 and January 2011.
Forney TX - Housing Market Report - August 2010Valarie Littles
The median price of for-sale properties in August 2010 decreased 2% from August 2009, while the median price of sold properties increased 20%. The number of for-sale properties rose 29% from 300 to 388 between August 2009 and August 2010, while the number of sold properties declined 44% from 52 to 29.
- The median price of for-sale properties increased 2% from June 2009 to June 2010, while the median price of sold properties decreased 24% over the same period.
- The number of for-sale properties increased 19% from June 2009 to June 2010, while the number of sold properties increased 50% over the same period.
- The average months supply of inventory, a measure of housing demand and supply balance, increased 69% from June 2009 to June 2010.
Understanding your tax -The April 30 deadline looms for taxpayers to file their returns. Tax consultant Dr Choong Kwai Fatt from the Faculty of Business, Universiti Malaya, takes you through the basic issues in understanding your tax issues.
The document contains three real estate market reports from Ultima Real Estate for Valarie Littles comparing April 2009 to April 2010. It shows that the median price of for sale properties decreased 1% while the median price of sold properties decreased 2%. The number of for sale properties increased 1% and the number of sold properties increased 23%. Finally, the average months supply of inventory decreased 28%.
The median price of for sale properties increased 1% from May 2009 to May 2010, while the median price of sold properties increased 7% over the same period. The number of for sale properties decreased 1% from 328 to 326 properties, while the number of sold properties decreased 27% from 48 to 35 properties sold. Additionally, the average months supply of inventory, a measure of housing demand and supply balance, increased 77% from 4.8 months in May 2009 to 8.4 months in May 2010.
The document summarizes real estate data from May 2009 to May 2010 in Savannah, Georgia. It shows that during this period:
- The median price of for-sale properties decreased 5% (from $162,445 to $155,000) while the median price of sold properties decreased 8% (from $139,900 to $129,000).
- The number of for-sale properties increased 26% (from 54 to 68 properties) while the number of sold properties increased 71% (from 7 to 12 properties).
- The average months of inventory increased 418% (from 3.8 months to 19.7 months).
The median price of for-sale properties in May 2010 was down 2% from May 2009, while the median price of sold properties was down 7%. The number of for-sale properties was down 10% from May 2009 to May 2010, while the number of sold properties was up 3%. Additionally, the average months supply of inventory was up 74% from May 2009 to May 2010.
The document compares housing market data from May 2009 to May 2010 in Addison, Texas. It shows that the median price of for-sale properties increased 2% while the median price of sold properties decreased 3%. The number of for-sale properties increased 16% while the number of sold properties remained the same. Additionally, the average months of inventory increased 21%.
The document compares real estate data from March 2009 to March 2010 in Carrollton. It shows that:
- The median price of for-sale properties increased 6% while the median price of sold properties rose 3%.
- The number of for-sale properties grew 17% while the number of sold properties declined slightly by 2%.
- The average months of inventory decreased 15% from 4.1 months in March 2009 to 3.5 months in March 2010.
The document contains real estate data from June 2009 to June 2010 for Savannah, GA. It shows that during this period:
- The median price of for-sale properties decreased 3% while the median price of sold properties increased 2%.
- The number of for-sale properties increased 20% while the number of sold properties increased 50%.
- The average months of inventory increased 104%, from 5.5 months in June 2009 to 11.2 months in June 2010.
The document compares housing market data from June 2009 to June 2010 in Providence Village. It finds that the median price of for-sale properties increased 2% while the median price of sold properties decreased 16%. The number of for-sale properties rose 25% but the number of sold properties declined 65%. Additionally, the average months of inventory increased 106% from 3.5 to 7.2 months.
The document compares housing market data from May 2009 to May 2010 in Allen, Texas. It finds that the median price of for-sale properties increased 1% while the median price of sold properties decreased 4%. The number of for-sale properties decreased 7% and the number of sold properties increased 37%. Additionally, the average months of inventory increased 64% from 3.7 to 6.1 months.
The document compares median home prices and housing inventory in June 2009 to June 2010 in Frisco, Texas. It finds that the median price of for-sale homes was unchanged, while the median price of homes sold increased by 9%. The number of for-sale homes decreased by 7% and the number of homes sold decreased by 13%. The average months of inventory increased by 52% from June 2009 to June 2010.
The document compares real estate data from April 2009 to April 2010 in Addison, Texas. It states that the median price of for-sale properties increased 3% while the median price of sold properties decreased 32%. Additionally, the number of for-sale properties rose 35% but the number of sold properties declined 57%. Finally, the average months supply of inventory, a measure of housing demand and supply balance, increased 69% from April 2009 to April 2010.
Similar to Heath TX - April 2010 - Market Report (11)
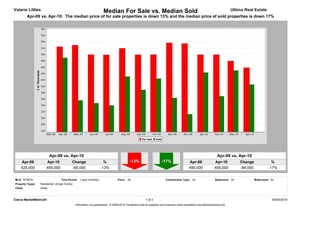
The document compares housing market data from March 2010 to March 2011 in The Colony, Texas. It finds that the median price of for-sale properties was unchanged, while the median price of sold properties declined 17%. The number of for-sale properties increased 12% from March 2010 to March 2011, while the number of properties sold declined 62% over the same period.
The document compares real estate data from March 2010 to March 2011 in Rockwall, Texas. It finds that the median price of for-sale properties decreased 4% while the median price of sold properties decreased 13%. Additionally, the number of for-sale properties decreased 5% and the number of sold properties decreased 41%. The average months of inventory increased 12% from March 2010 to March 2011.
The document compares real estate data from March 2010 to March 2011 in McKinney, Texas. It finds that the median price of for-sale properties decreased 5% while the median price of sold properties increased 4%. Additionally, the number of for-sale properties decreased 8% and the number of properties sold decreased 34%. Finally, the average months of inventory increased 19% from March 2010 to March 2011.
Plano TX - Feb/March 2011 - Housing Market ReportValarie Littles
The document compares housing market data from March 2010 to March 2011 in Plano, Texas. It finds that the median price of for-sale properties decreased 2% while the median price of sold properties increased 1%. Additionally, the number of for-sale properties decreased 6% and the number of properties sold decreased 15% from one year ago.
Little Elm - Feb/March 2011 - Housing Market ReportValarie Littles
The document compares real estate data from March 2010 to March 2011 in Little Elm, Texas. It finds that the median price of for-sale properties decreased 2% while the median price of sold properties decreased 13%. The number of for-sale properties increased 3% while the number of properties sold decreased 46%.
The document compares real estate data from March 2010 to March 2011 in Heath, Texas. It shows that the median price of for-sale properties increased 2% while the median price of sold properties decreased 11%. The number of for-sale properties increased 2% and the number of sold properties increased 33%. Additionally, the average months of inventory decreased 13% from March 2010 to March 2011.
The document contains two tables comparing housing market data from March 2010 to March 2011 in a certain region:
1) The median price of for-sale properties decreased 10% while the median price of sold properties increased 2%.
2) The number of for-sale properties increased 30% while the number of properties sold decreased 80%.
The document compares real estate market data from March 2010 to March 2011 in Frisco, Texas. It shows that the median price of for-sale properties was unchanged, while the median price of sold properties decreased slightly. The number of for-sale properties decreased 10% from March 2010 to March 2011, while the number of properties sold decreased more sharply at 40%.
The document summarizes real estate data from March 2010 to March 2011 in Forney, Texas. It shows that the median price of for-sale properties decreased 3% from March 2010 to March 2011, while the median price of sold properties decreased 12%. The number of for-sale properties increased 5% while the number of sold properties decreased 34%. Additionally, the average months of inventory increased 2% from March 2010 to March 2011.
The document compares real estate data from March 2010 to March 2011 in Carrollton, Texas. It finds that the median price of for-sale properties decreased 3% from $179,000 to $173,950, while the median price of sold properties decreased 1% from $164,750 to $163,500. The number of for-sale properties increased 12% from 563 to 630, while the number of properties sold decreased 44% from 98 to 55.
Allen TX - Feb/March 2011 - Housing Market ReportValarie Littles
The document contains real estate data for Allen, Texas from March 2010 to March 2011. It shows that:
1) The median price of homes for sale increased 2% from March 2010 to March 2011, while the median price of homes sold increased 6%.
2) The number of homes for sale decreased 7% from March 2010 to March 2011, while the number of homes sold decreased 35% over the same period.
3) Both the supply of homes for sale and demand as measured by homes sold declined from March 2010 to March 2011 in Allen, Texas according to the data presented.
The document compares real estate data from March 2010 to March 2011 in Rowlett, Texas. It finds that the median price of for-sale properties decreased 1% while the median price of sold properties increased 1%. The number of for-sale properties decreased slightly by 0% while the number of properties sold decreased more sharply by 38%. Finally, the average months of inventory increased by 32% from 3.9 to 5.1 months.
Plano TX - January 2011 - Housing Market ReportValarie Littles
The median price of for-sale properties in January 2011 was down 7% from January 2010, while the median price of sold properties was up 6%. The number of for-sale properties increased 11% from January 2010 to January 2011, and the number of sold properties was up 17%. Additionally, the average months supply of inventory was up 27% in January 2011 compared to January 2010.
Forney TX - January 2011 - Housing Market ReportValarie Littles
The document summarizes real estate data from January 2010 to January 2011 for Forney, Texas. It shows that the median price of for-sale properties decreased 11% from January 2010 to January 2011, while the median price of sold properties decreased 18%. Additionally, the number of for-sale properties increased 15% from January 2010 to January 2011, while the number of sold properties decreased 21% over the same period.
Rowlett TX - January 2011 - Housing Market ReportValarie Littles
The document compares real estate data from January 2010 to January 2011 in Rowlett, Texas. It finds that the median price of for-sale properties decreased 6% while the median price of sold properties increased 14%. Additionally, the number of for-sale properties increased 17% while the number of properties sold decreased 8%.
Rockwall TX - January 2011 - Housing Market ReportValarie Littles
The document compares housing market data from January 2010 to January 2011 in Rockwall, Texas. It finds that the median price of homes for sale decreased 9% from $219,500 to $200,000 over this period, while the median price of homes sold decreased 6% from $180,250 to $170,000. The number of homes for sale increased 7% from 417 to 447 properties, while the number of homes sold decreased 13% from 30 to 26 properties over the same period.
Rowlett TX - January 2011 - Housing Market ReportValarie Littles
The document compares real estate data from January 2010 to January 2011 in Rowlett, Texas. It finds that the median price of for-sale properties decreased 6% while the median price of sold properties increased 14%. Additionally, the number of for-sale properties increased 17% while the number of properties sold decreased 8%.
McKinney TX - January 2011 - Housing Market ReportValarie Littles
The number of properties for sale increased 4% from January 2010 to January 2011, while the number of properties sold increased 1%. The average months of inventory, which measures the supply and demand of properties, increased 3% from 4.9 months in January 2010 to 5.0 months in January 2011.
Little Elm - January 2011 - Housing Market ReportValarie Littles
The document compares housing market data from January 2010 to January 2011 in Little Elm, Texas. It finds that the median price of for-sale properties decreased 4% while the median price of sold properties increased 13%. Additionally, the number of for-sale properties rose 2% while the number of properties sold fell 13%.
Heath TX - January 2011 - Housing Market ReportValarie Littles
The median price of for-sale properties in January 2011 was down 2% from January 2010, and the median price of sold properties was down 6% over the same period. The number of for-sale properties decreased 5% from January 2010 to January 2011, while the number of properties sold remained the same. The average months of inventory increased 8% from January 2010 to January 2011.
The SVN® organization shares a portion of their new weekly listings via their SVN Live® Weekly Property Broadcast. Visit https://svn.com/svn-live/ if you would like to attend our weekly call, which we open up to the brokerage community.
Stark Builders: Where Quality Meets Craftsmanship!shuilykhatunnil
At Stark Builders our vision is to redefine the renovation experience by combining both stunning design and high quality construction skills. We believe that by delivering both these key aspects together we are able to achieve incredible results for our clients and ensure every project reflects their vision and enhances their lifestyle.
Although we are not all related by blood we have created a team of highly professional and hardworking individuals who share the common goal of delivering beautiful and functional renovated spaces. Our tight nit team are able to work together in a way where we pour our passion into each and every project as we have a love for what we do. Building is our life.
Serviced Apartment Ho Chi Minh For RentalGVRenting
GVRenting is the leading rental real estate company in Vietnam. We help you to find a serviced apartment for rent in Ho Chi Minh & Saigon. Discover our broad range of rental properties in Vietnam.
For more details https://gvrenting.com/
BEST FARMLAND FOR SALE | FARM PLOTS NEAR BANGALORE | KANAKAPURA | CHICKKABALP...knox groups real estate
welcome to knox groups real estate company in Bangalore. best farm land for sale near Bangalore and madhugiri . Managed farmland near Kanakapura and Chickkabalapur get know more details about the projects .Knox groups is a leading real estate company dedicated to helping individuals and businesses navigate the dynamic real estate market. With our extensive knowledge, experience, and commitment to excellence, we deliver exceptional results for our clients. Discover the perfect foundation for your agricultural aspirations with KNOX Groups' prime farm lands. These aren't just plots; they're the fertile grounds where vibrant crops flourish, livestock thrives, and unique agricultural ventures come to life. At KNOX, we go beyond selling land we curate sustainable ecosystems, ensuring that your journey toward agricultural success is seamless and prosperous.
Recent Trends Fueling The Surge in Farmhouse Demand in IndiaFarmland Bazaar
Embarking on the journey to acquire a farmhouse for sale is just the beginning; the real investment lies in crafting an environment that contributes to our mental and physical well-being while satisfying the soul. At Farmlandbazaar.com, India’s leading online marketplace dedicated to farm land, farmhouses, and agricultural lands, we understand the importance of transforming a humble farmland into a warm and inviting sanctuary. Let's explore the fundamental aspects that can elevate your farmhouse into a tranquil haven.
AVRUPA KONUTLARI ESENTEPE - ENGLISH - Listing TurkeyListing Turkey
Looking for a new home in Istanbul? Look no further than Avrupa Konutlari Esentepe! Our beautifully designed homes provide the perfect blend of luxury and comfort, making them the perfect choice for anyone looking for a high-quality home in the city.
With a wide range of apartment types available, from 1+1 to 4+1, we have something to suit every need and budget. Each apartment is designed with attention to detail and features spacious and bright living areas, making them the perfect place to relax and unwind after a long day.
One of the things that sets Avrupa Konutlari Esentepe apart from other developments is our focus on creating a community that is both comfortable and convenient. Our homes are surrounded by lush green spaces, perfect for enjoying a peaceful stroll or having a picnic with friends and family. Additionally, our complex includes a variety of social and recreational amenities, such as swimming pools, sports fields, and playgrounds, making it easy for residents to stay active and socialize with their neighbors.
https://listingturkey.com/property/avrupa-konutlari-esentepe/
Dholera Smart City Latest Development Status 2024.pdfShivgan Infratech
Explore the latest development status of Dholera Smart City in 2024. Discover the progress, infrastructure, and future plans of India's first greenfield smart city.