Download to read offline
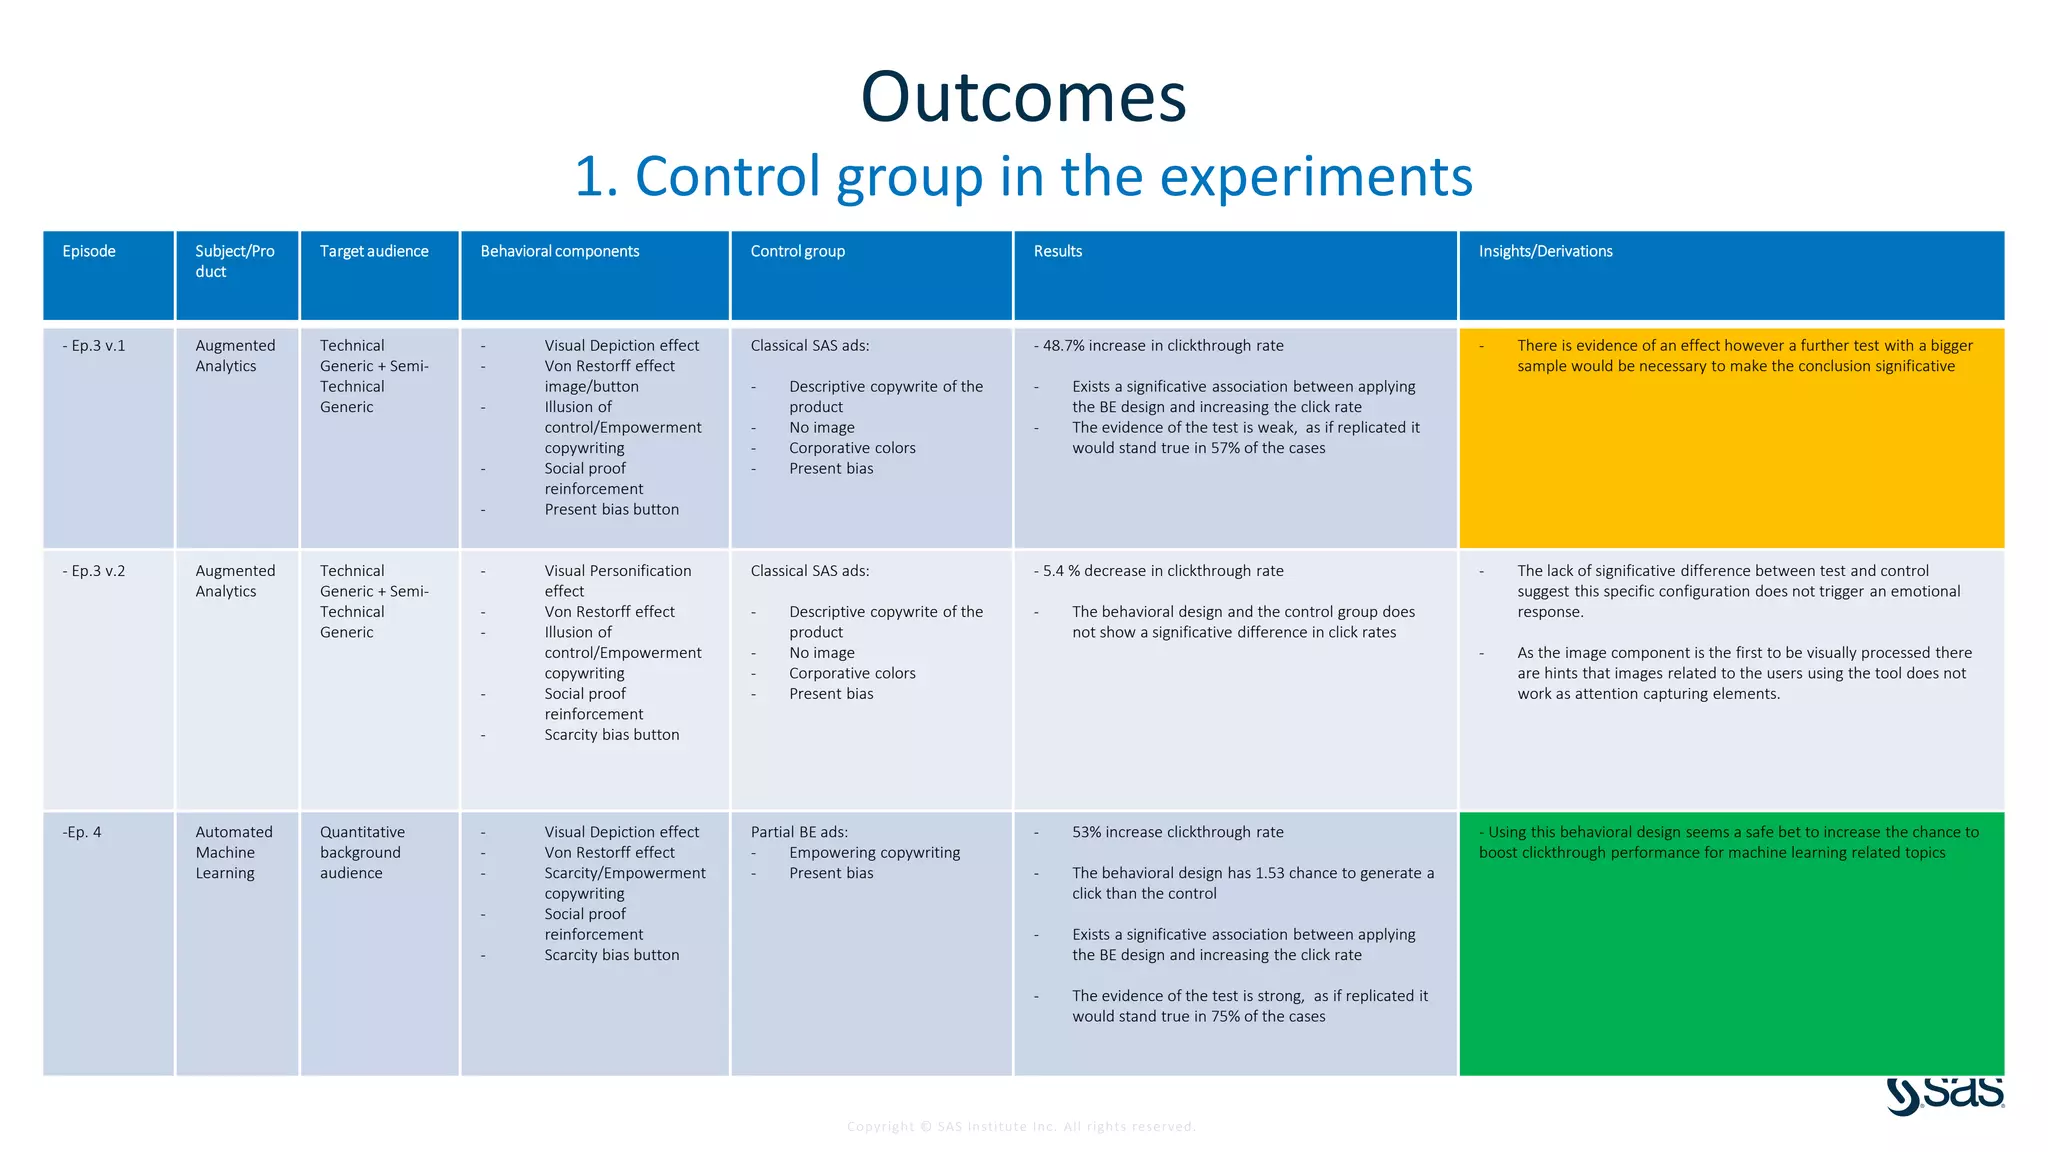
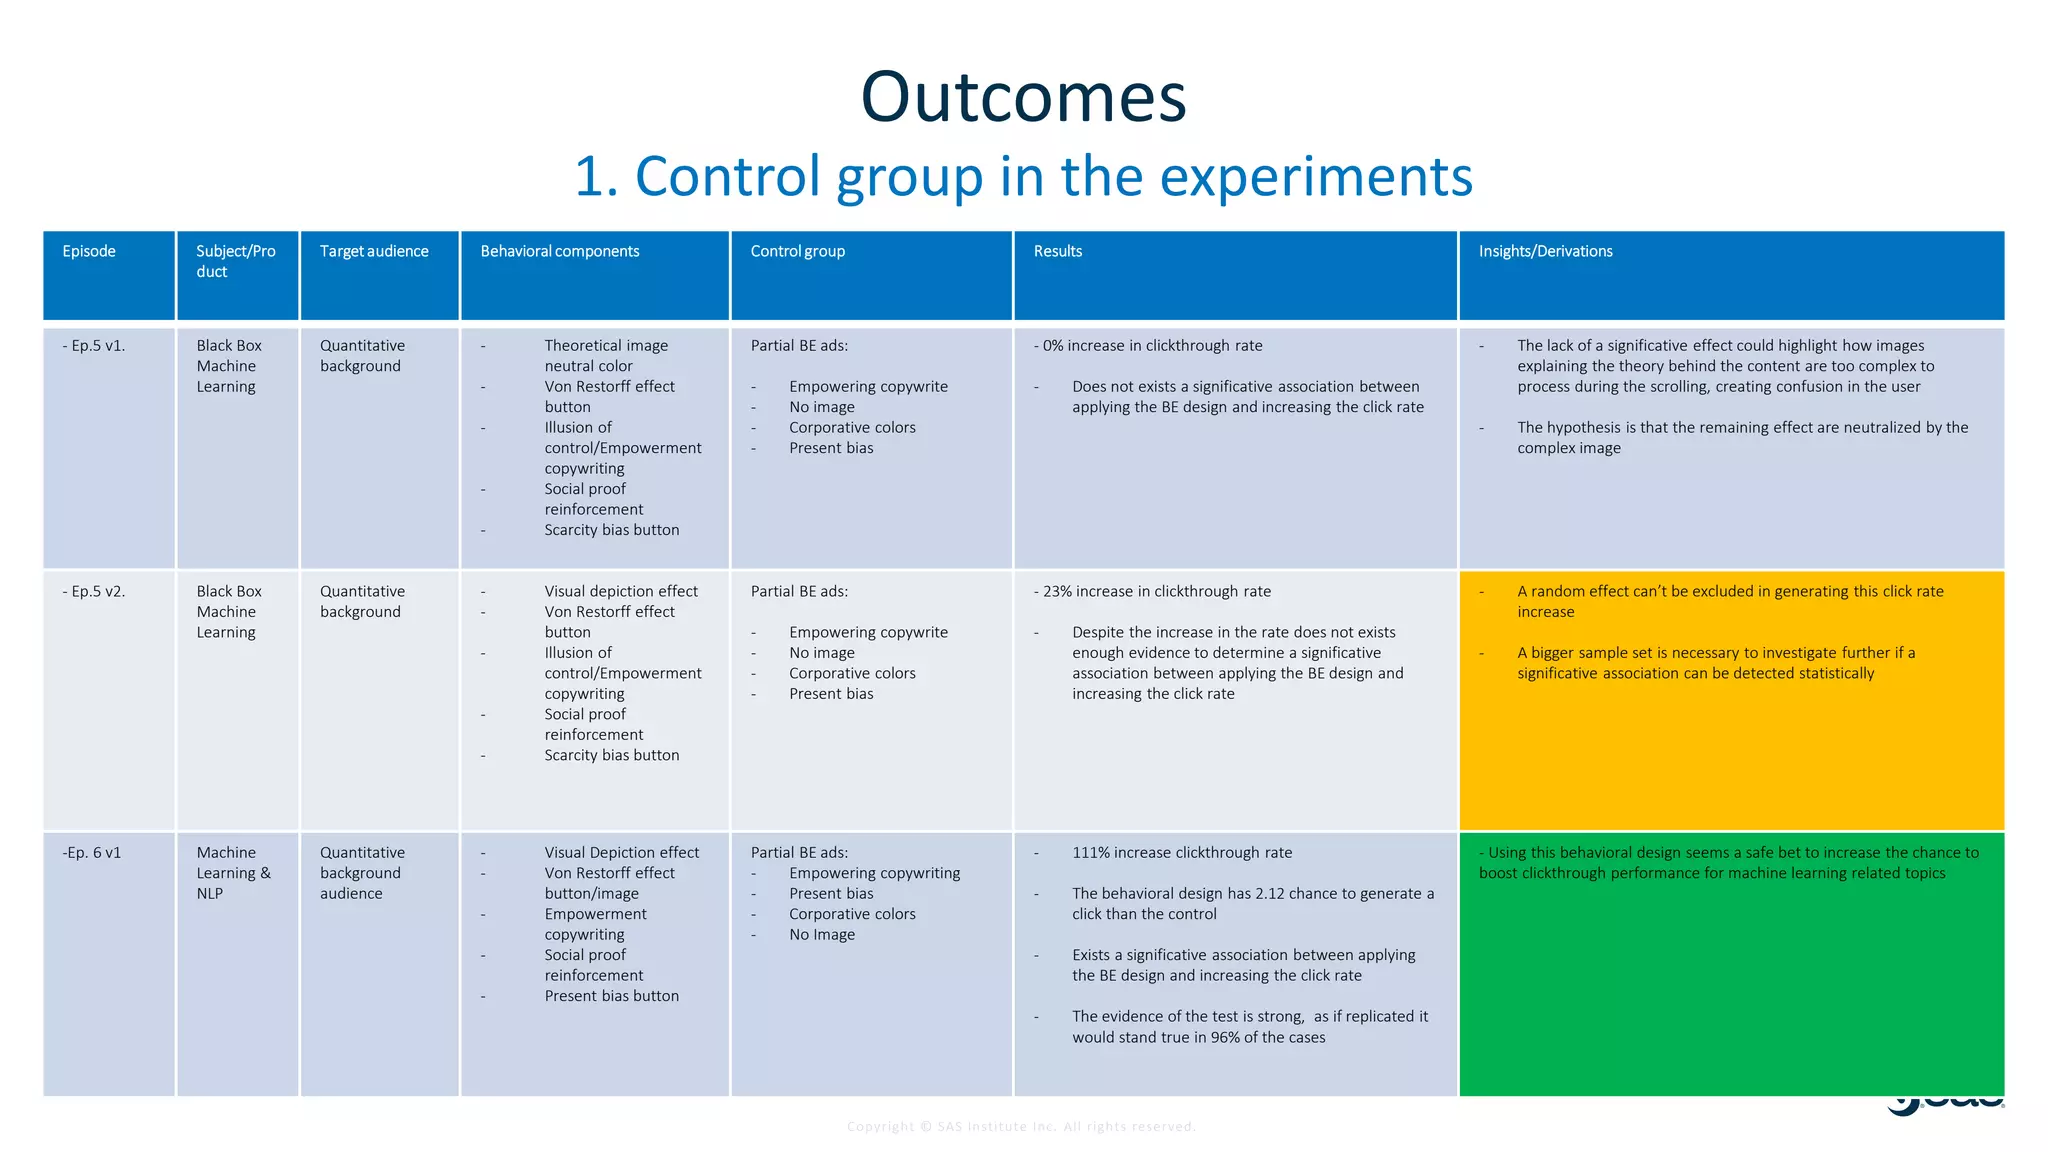
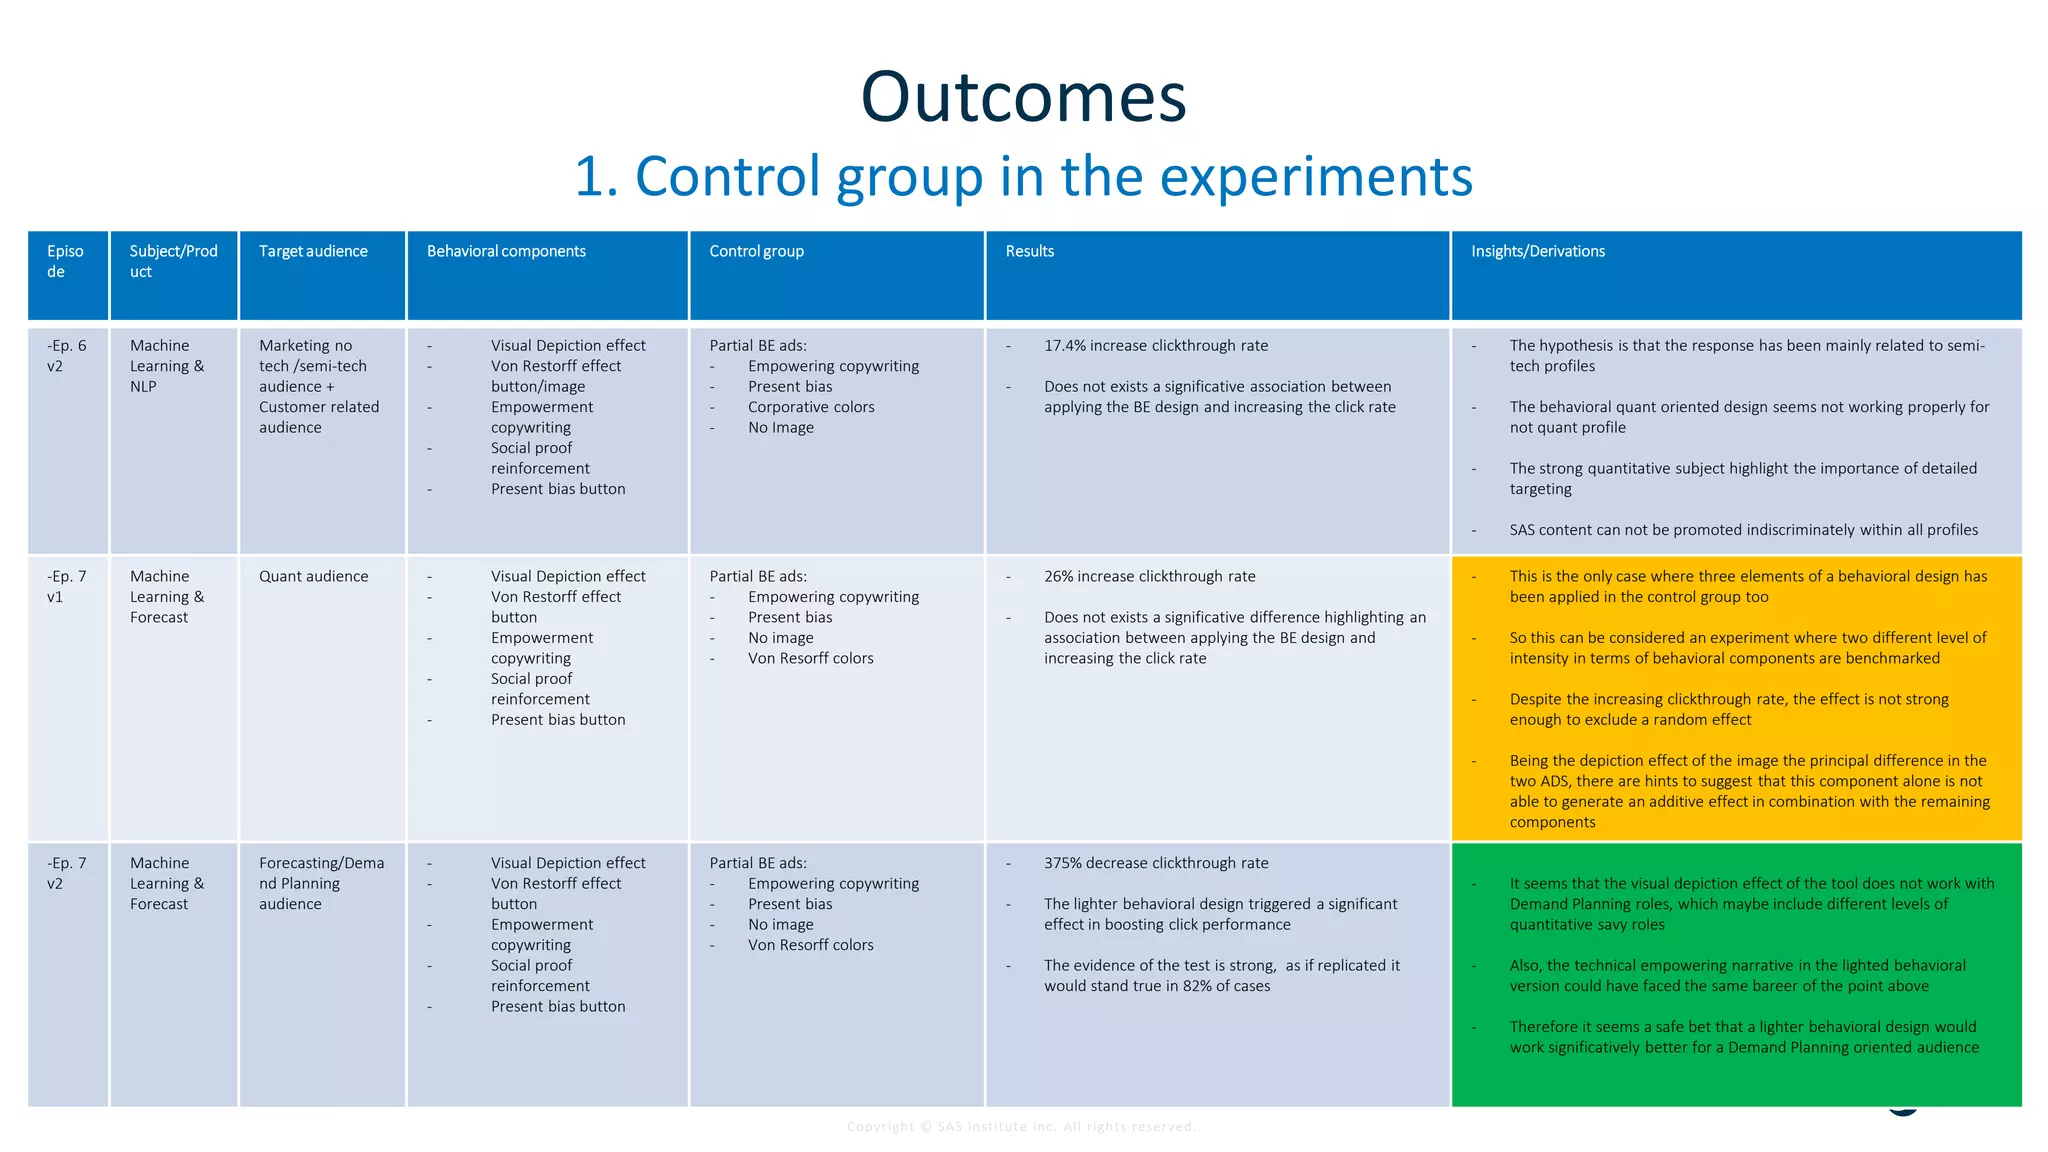
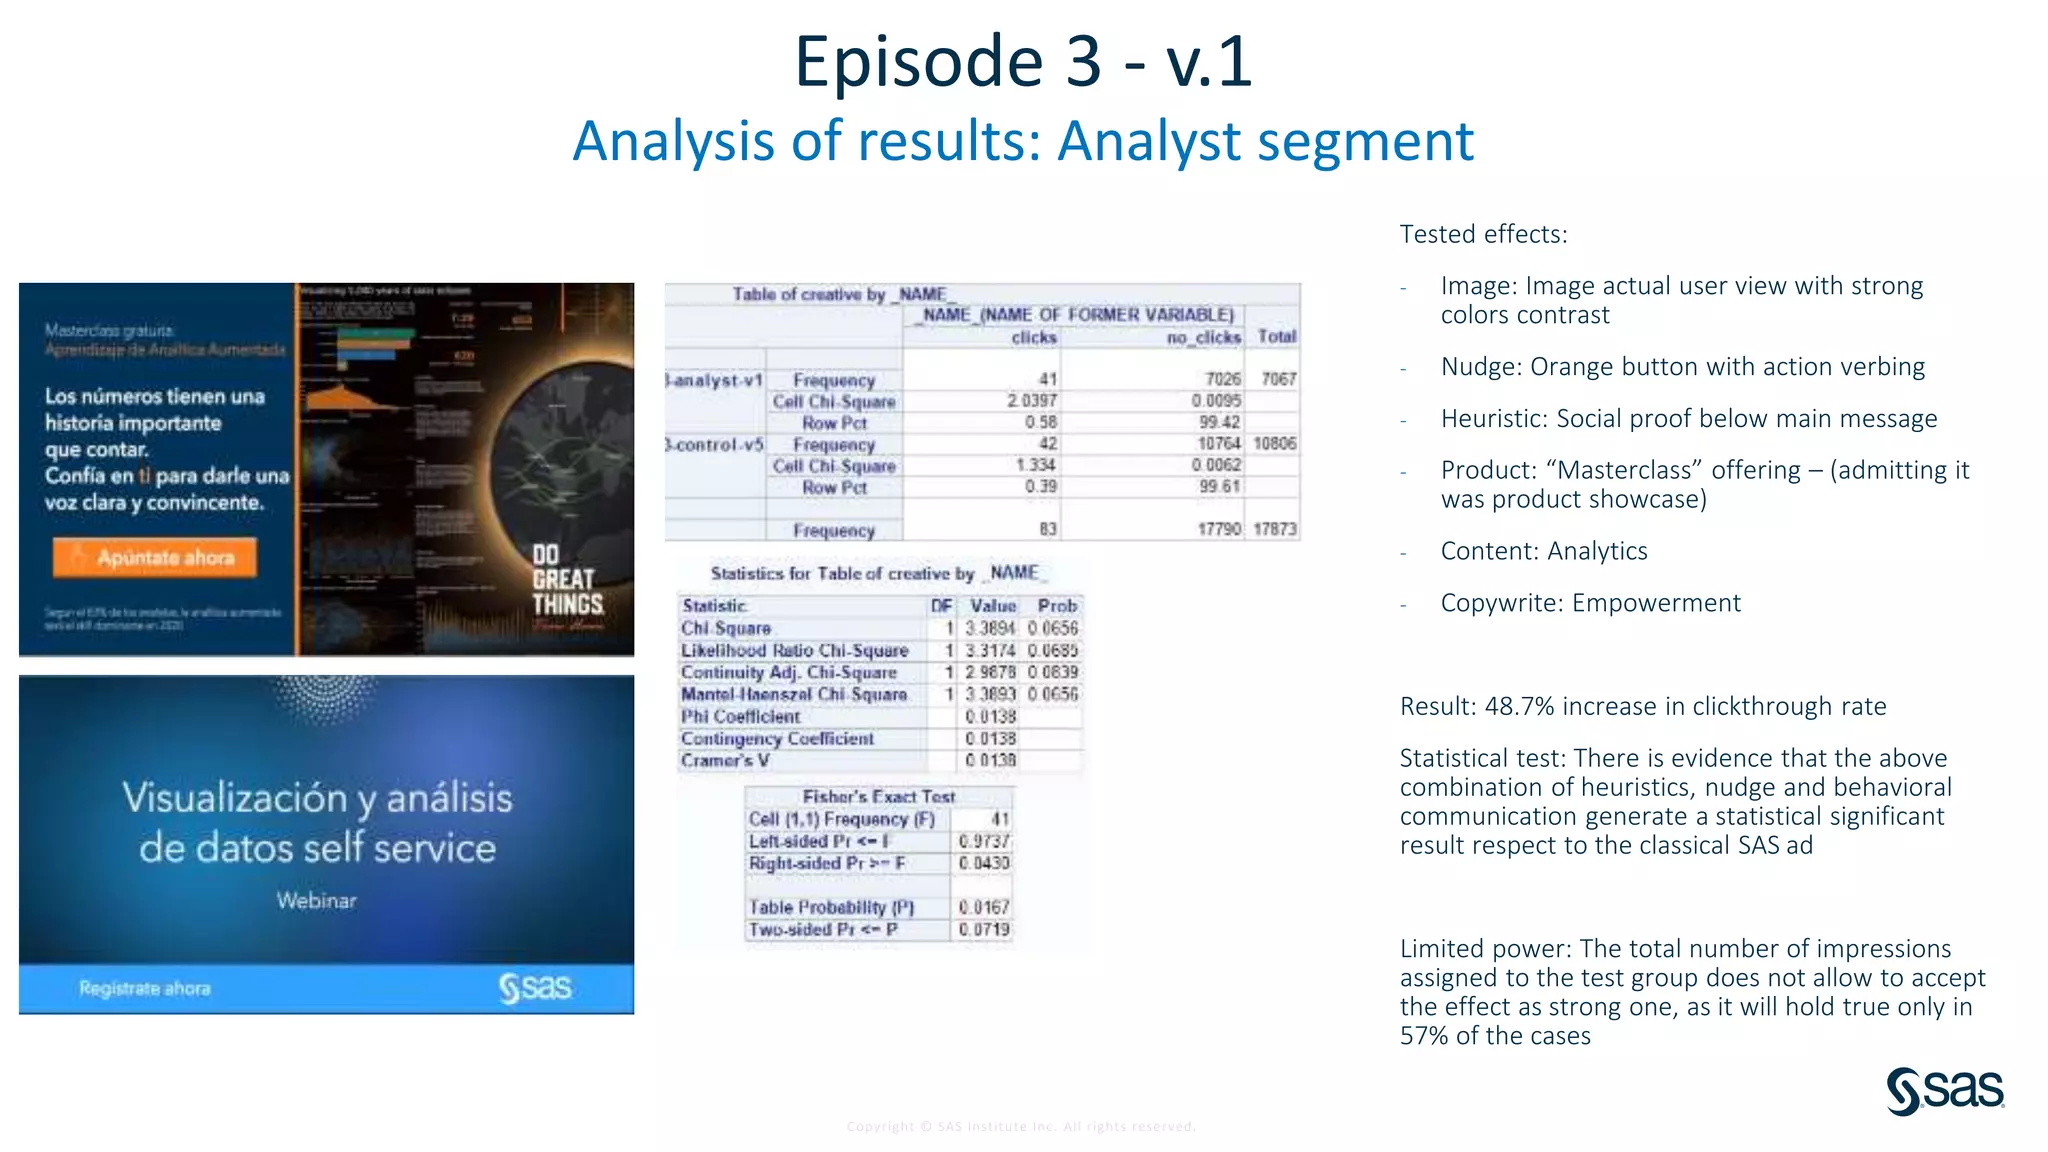
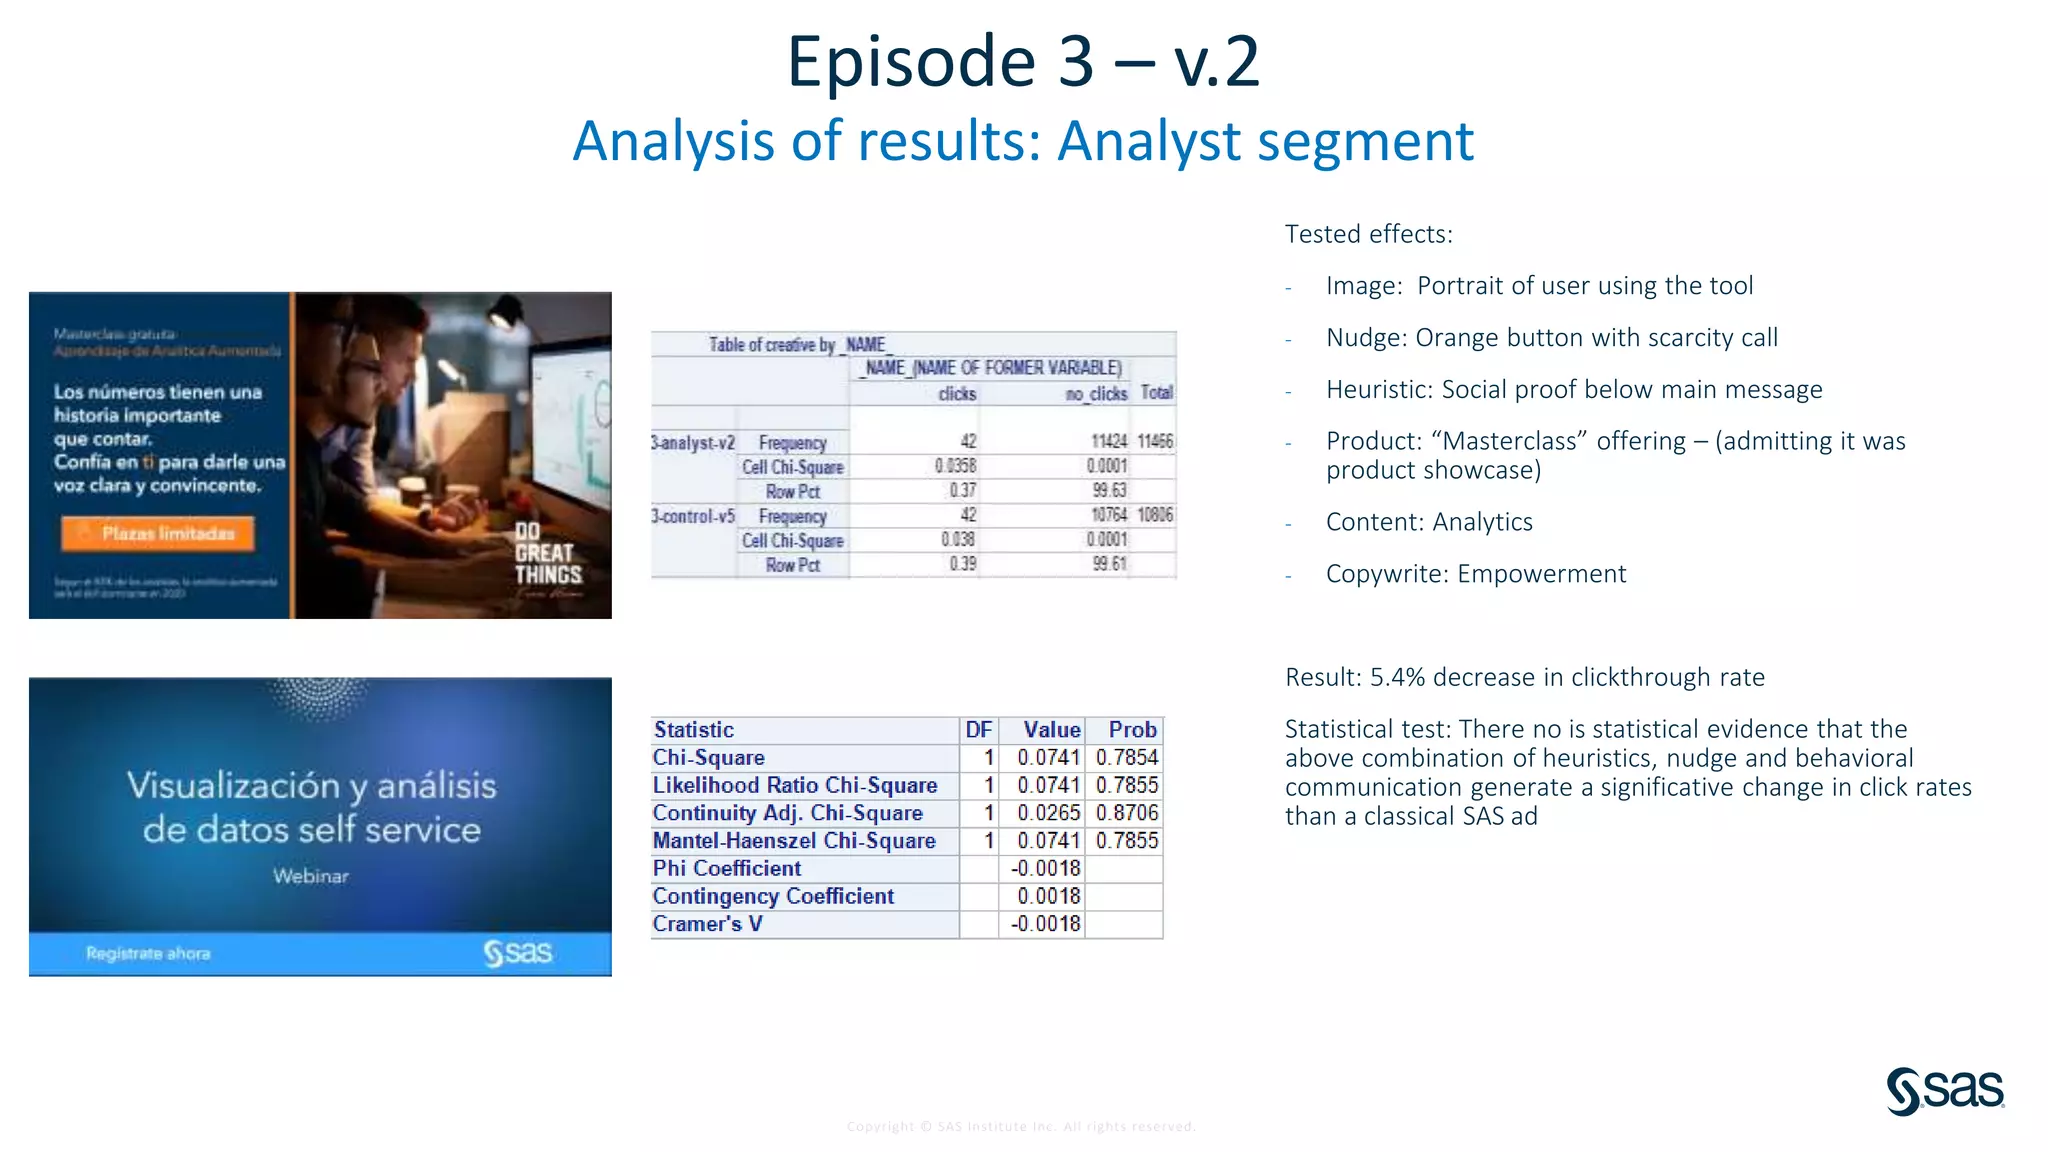
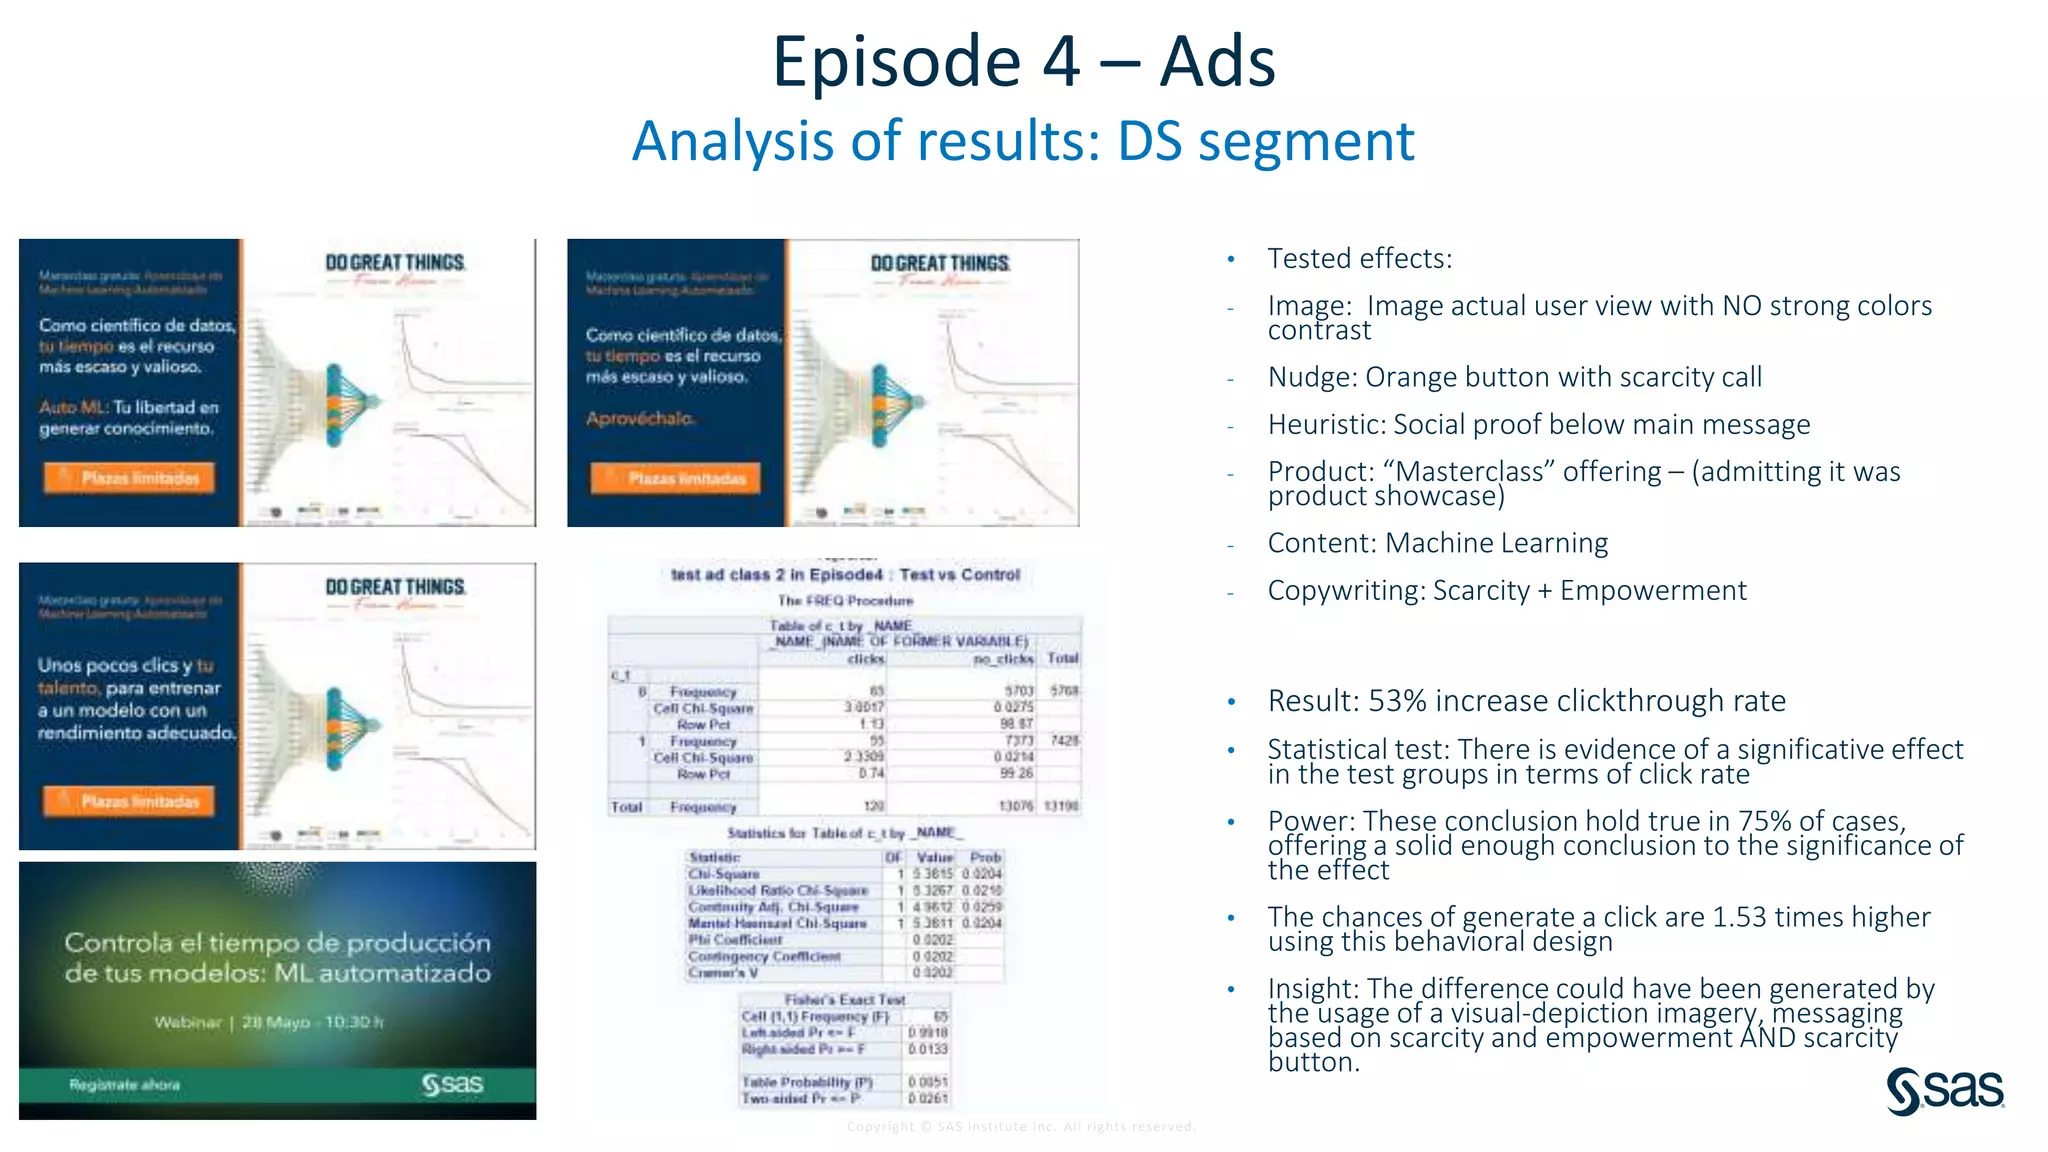
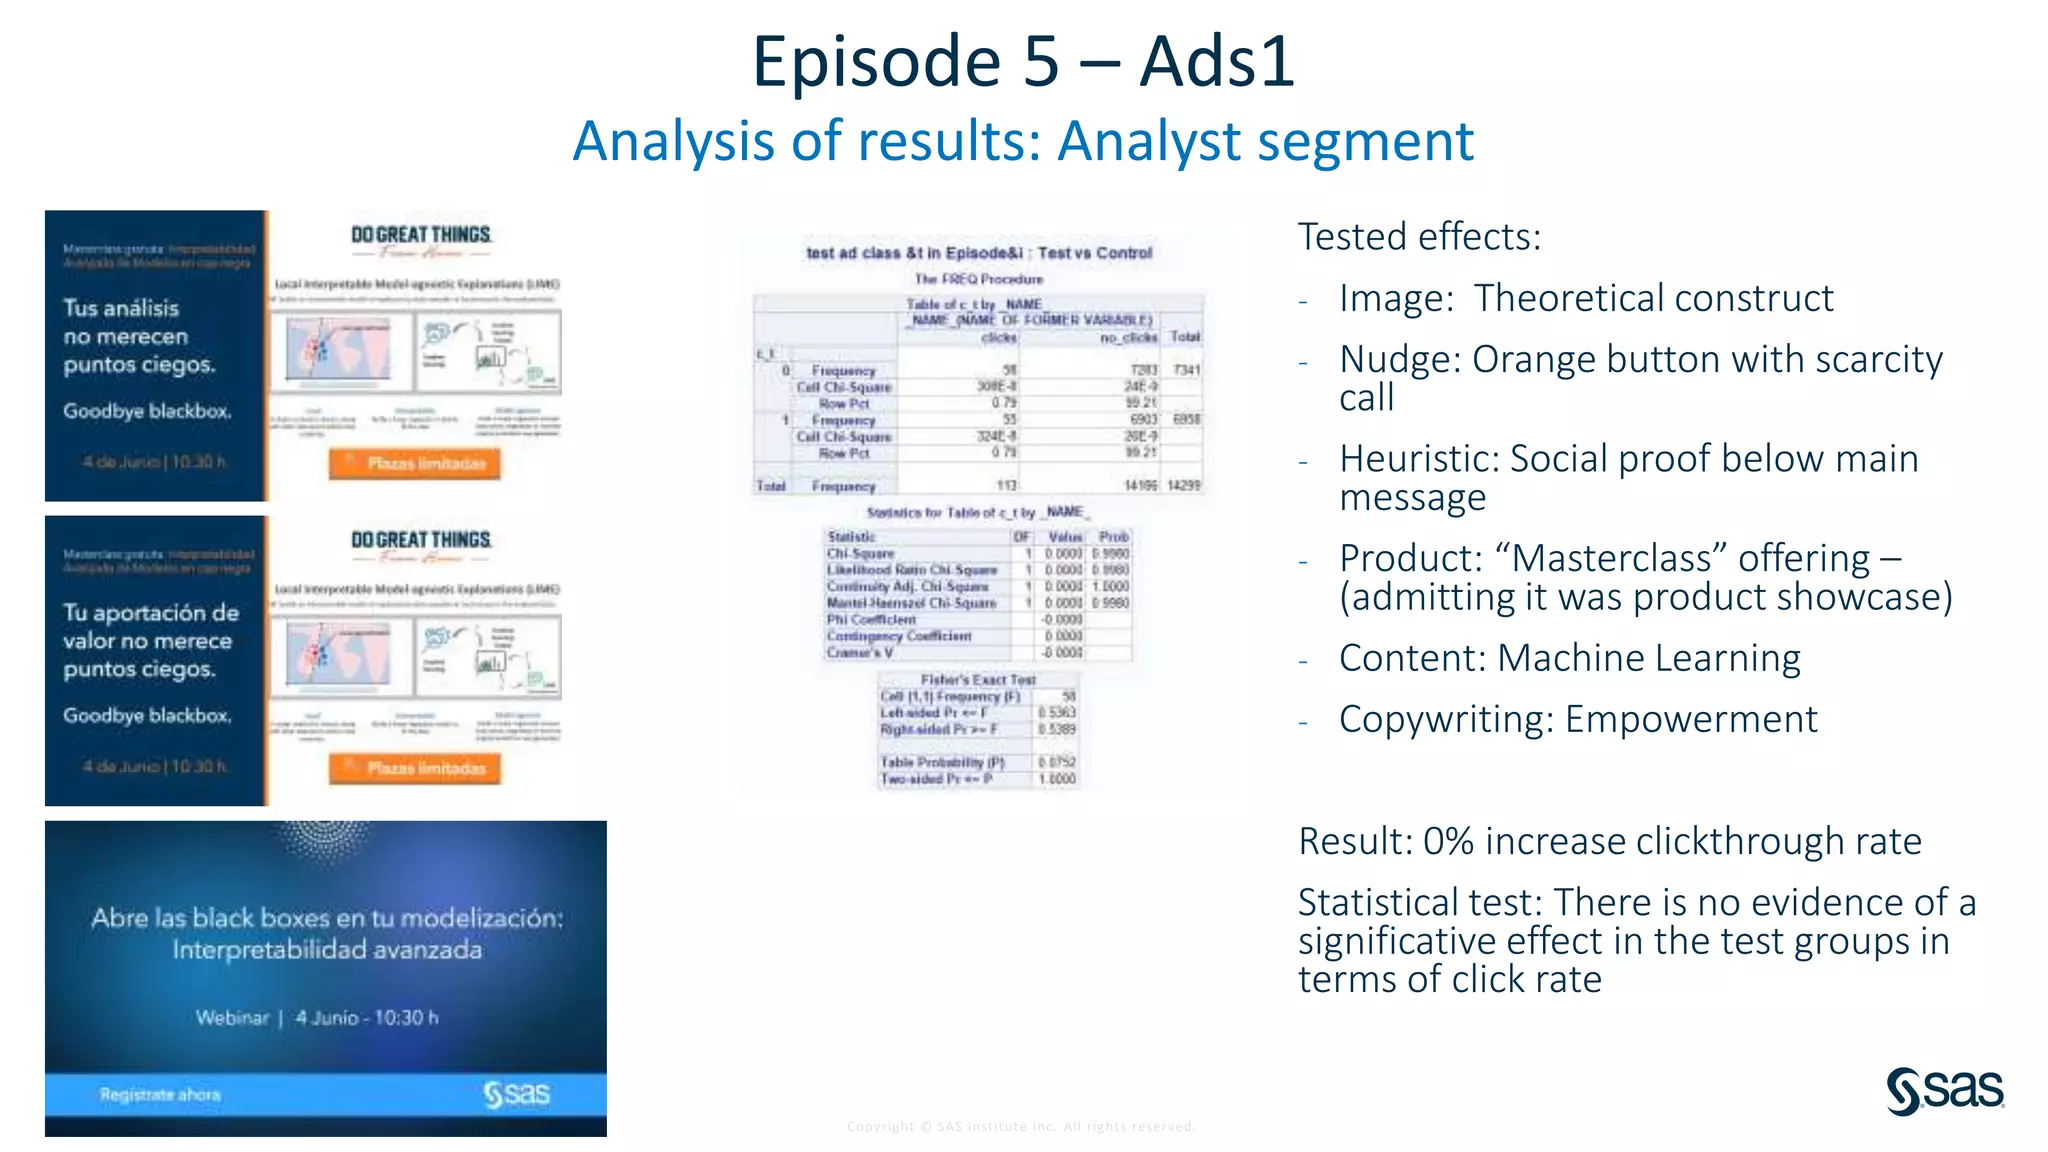
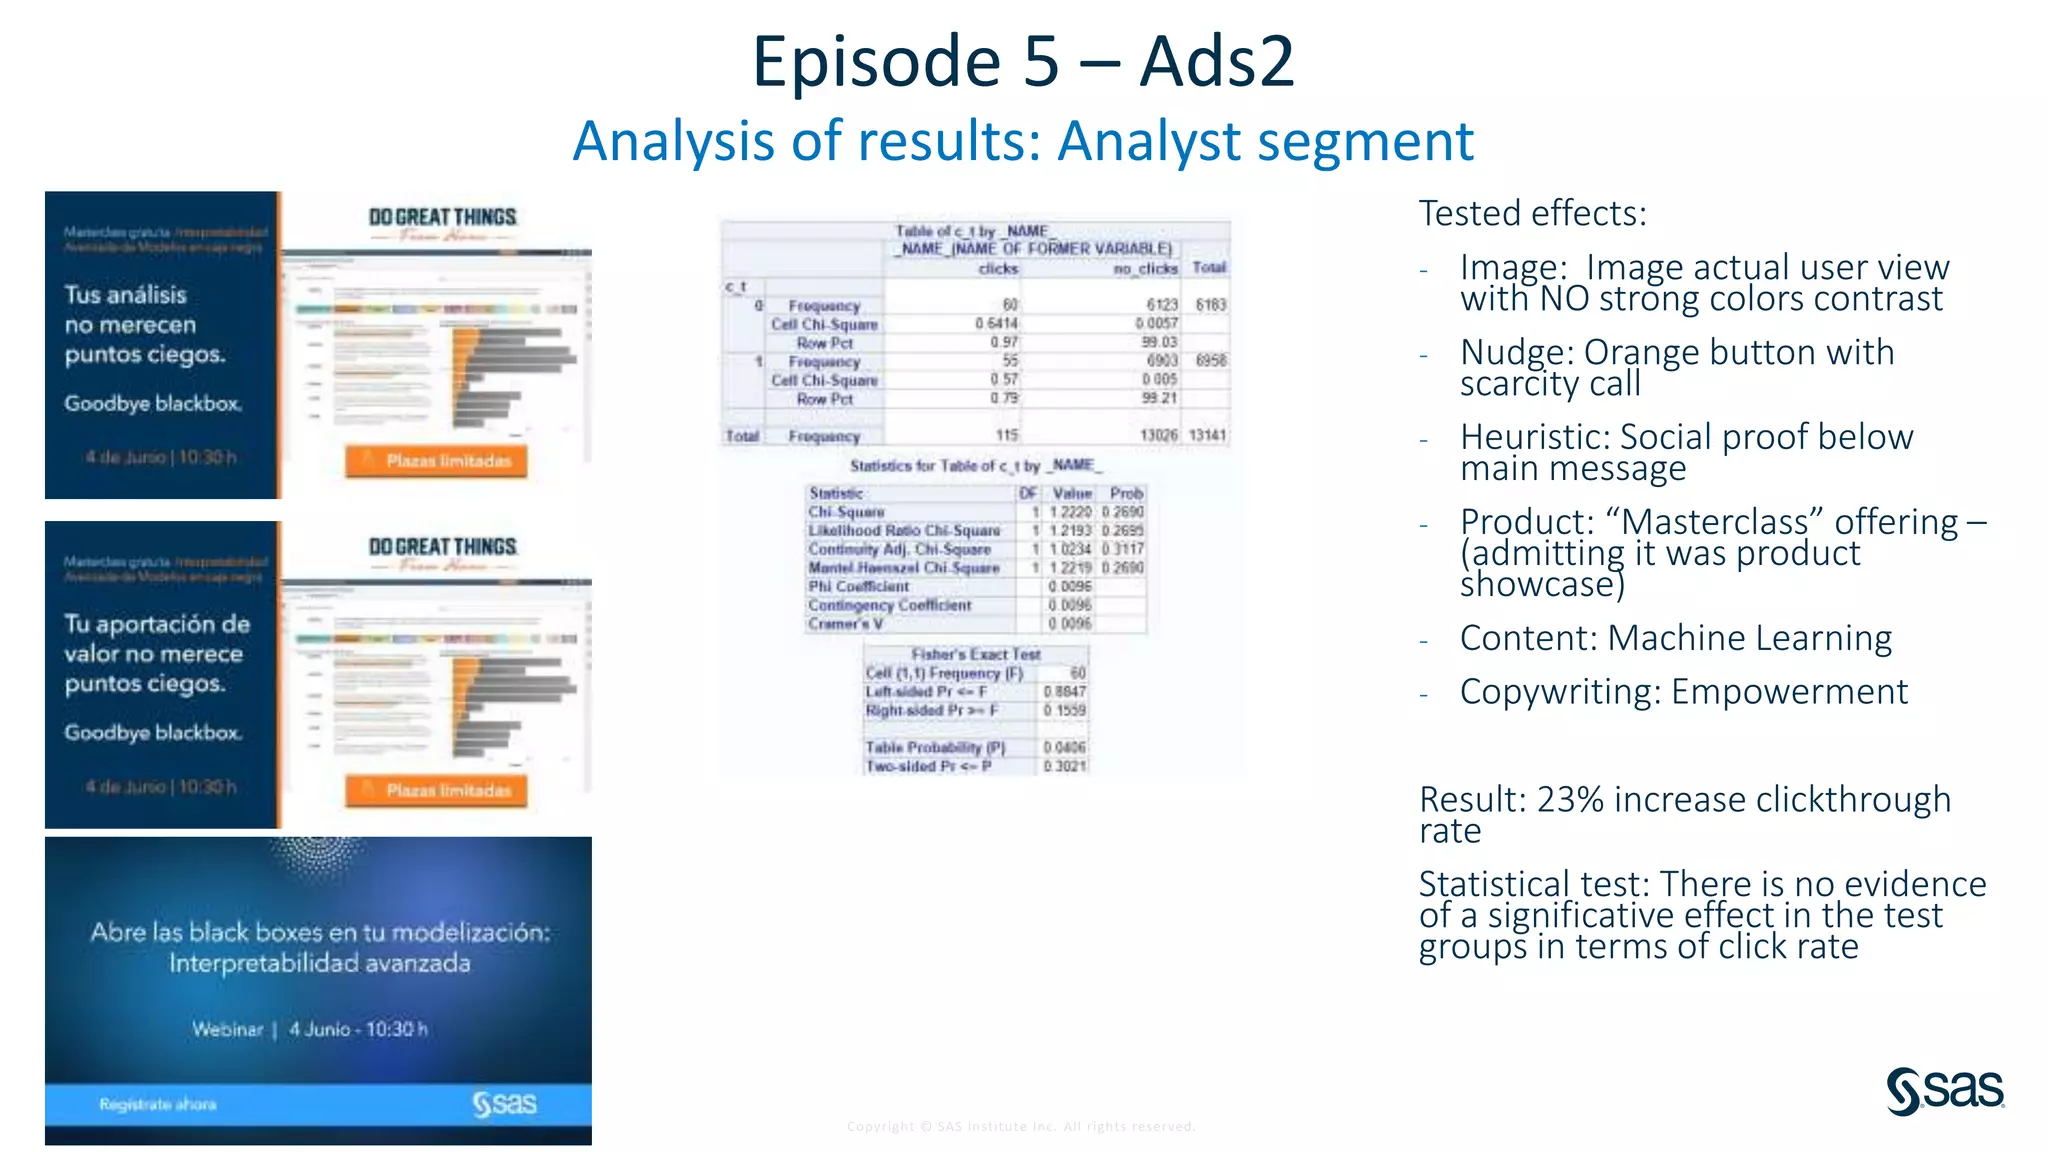
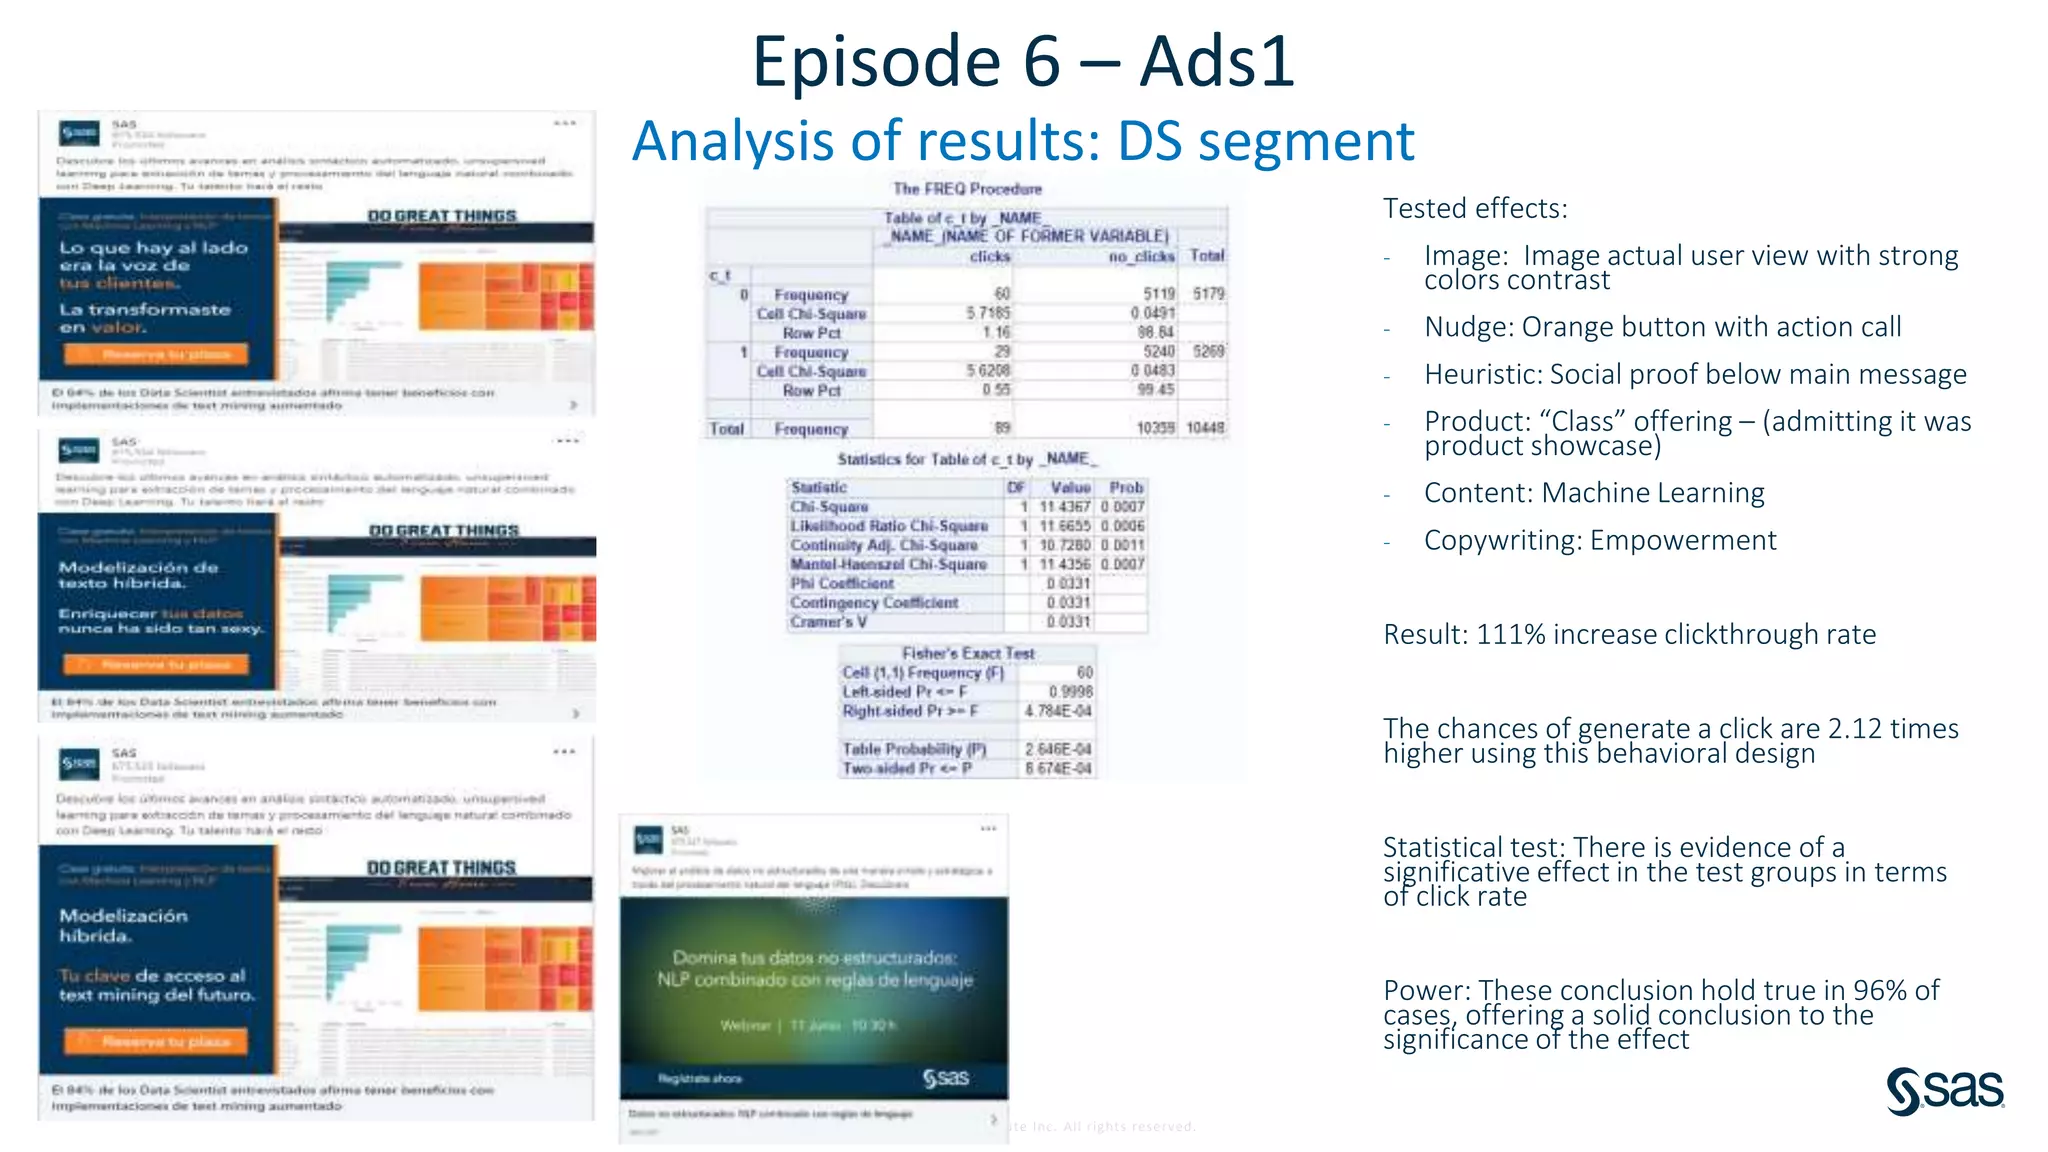
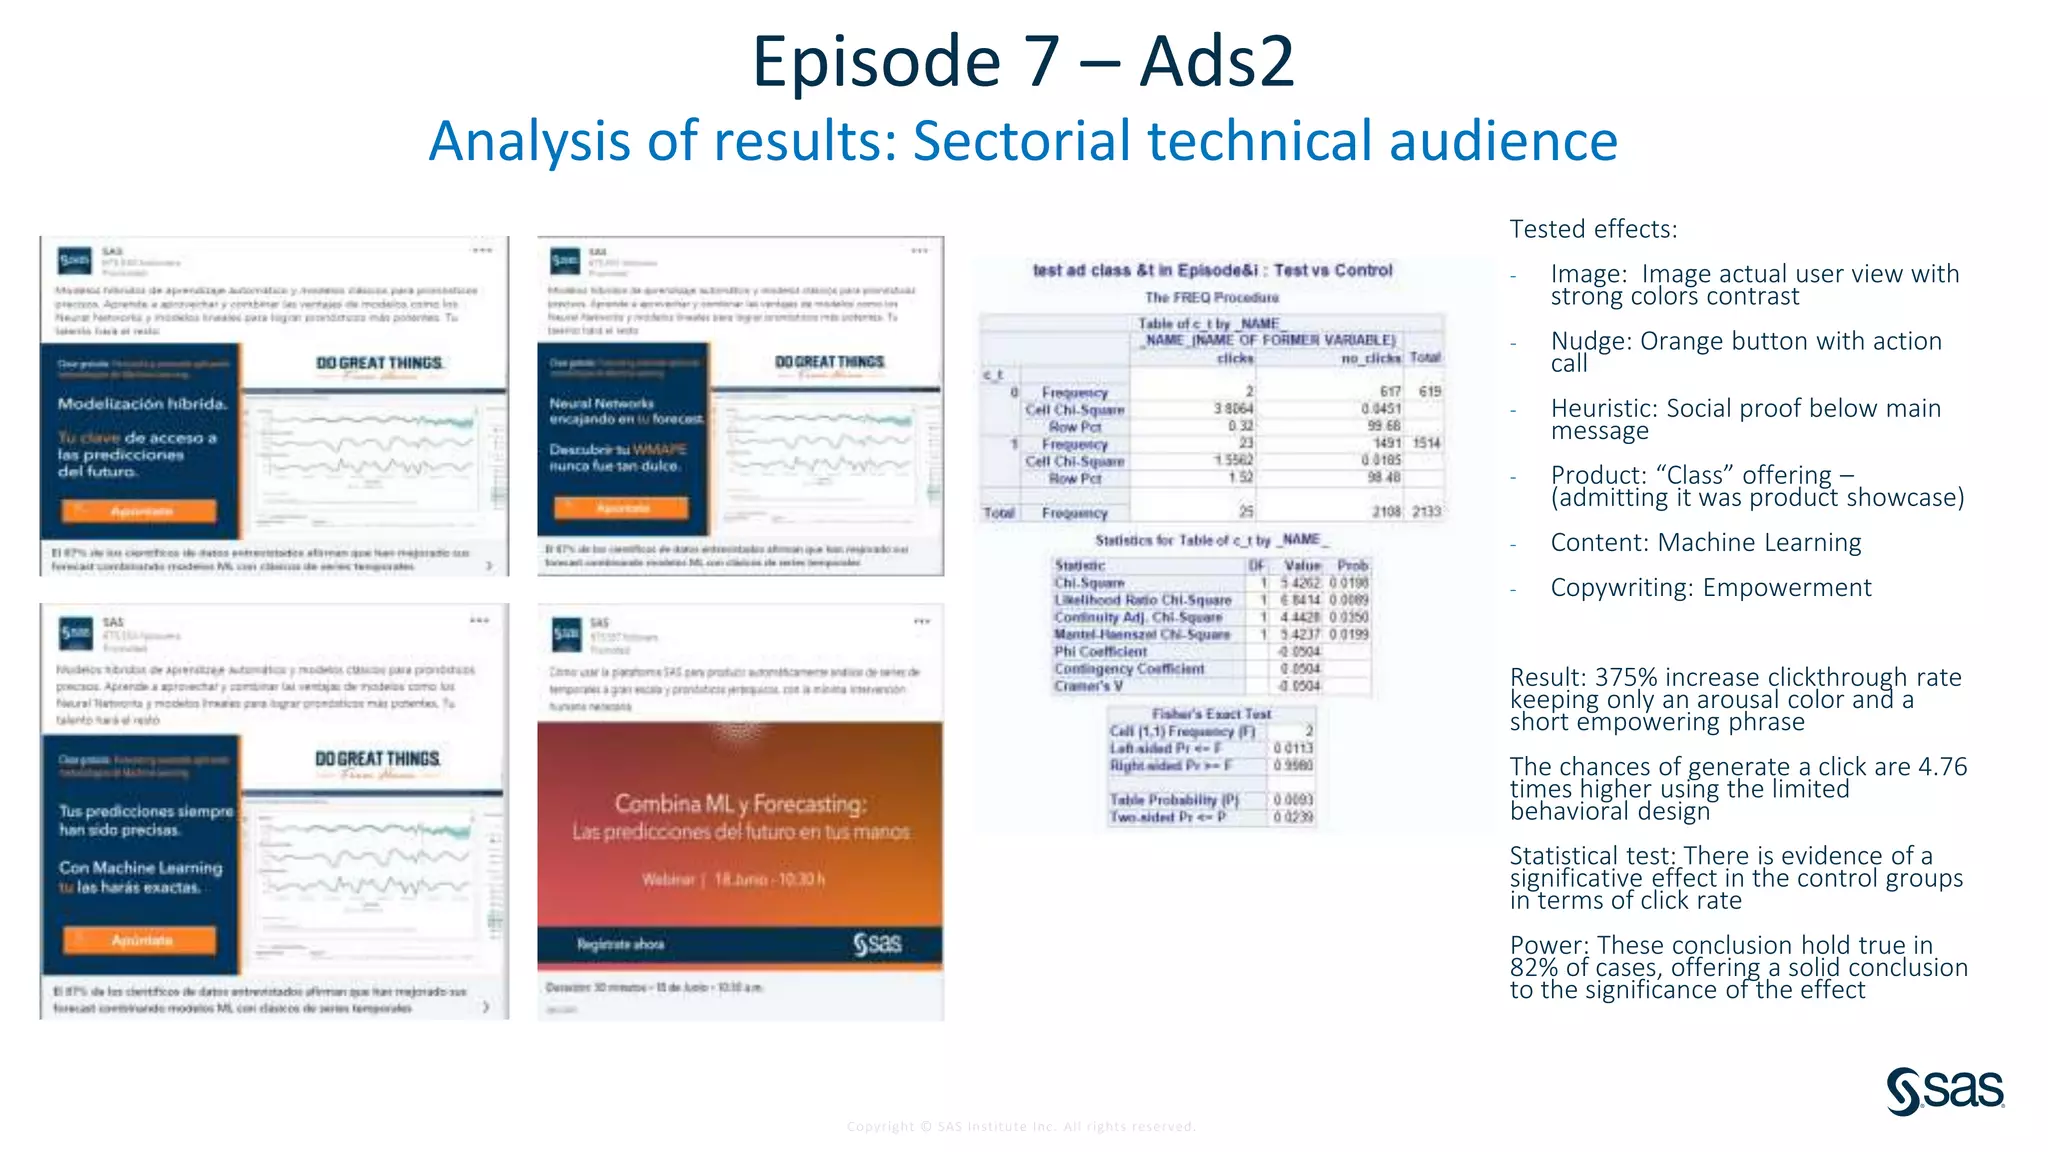
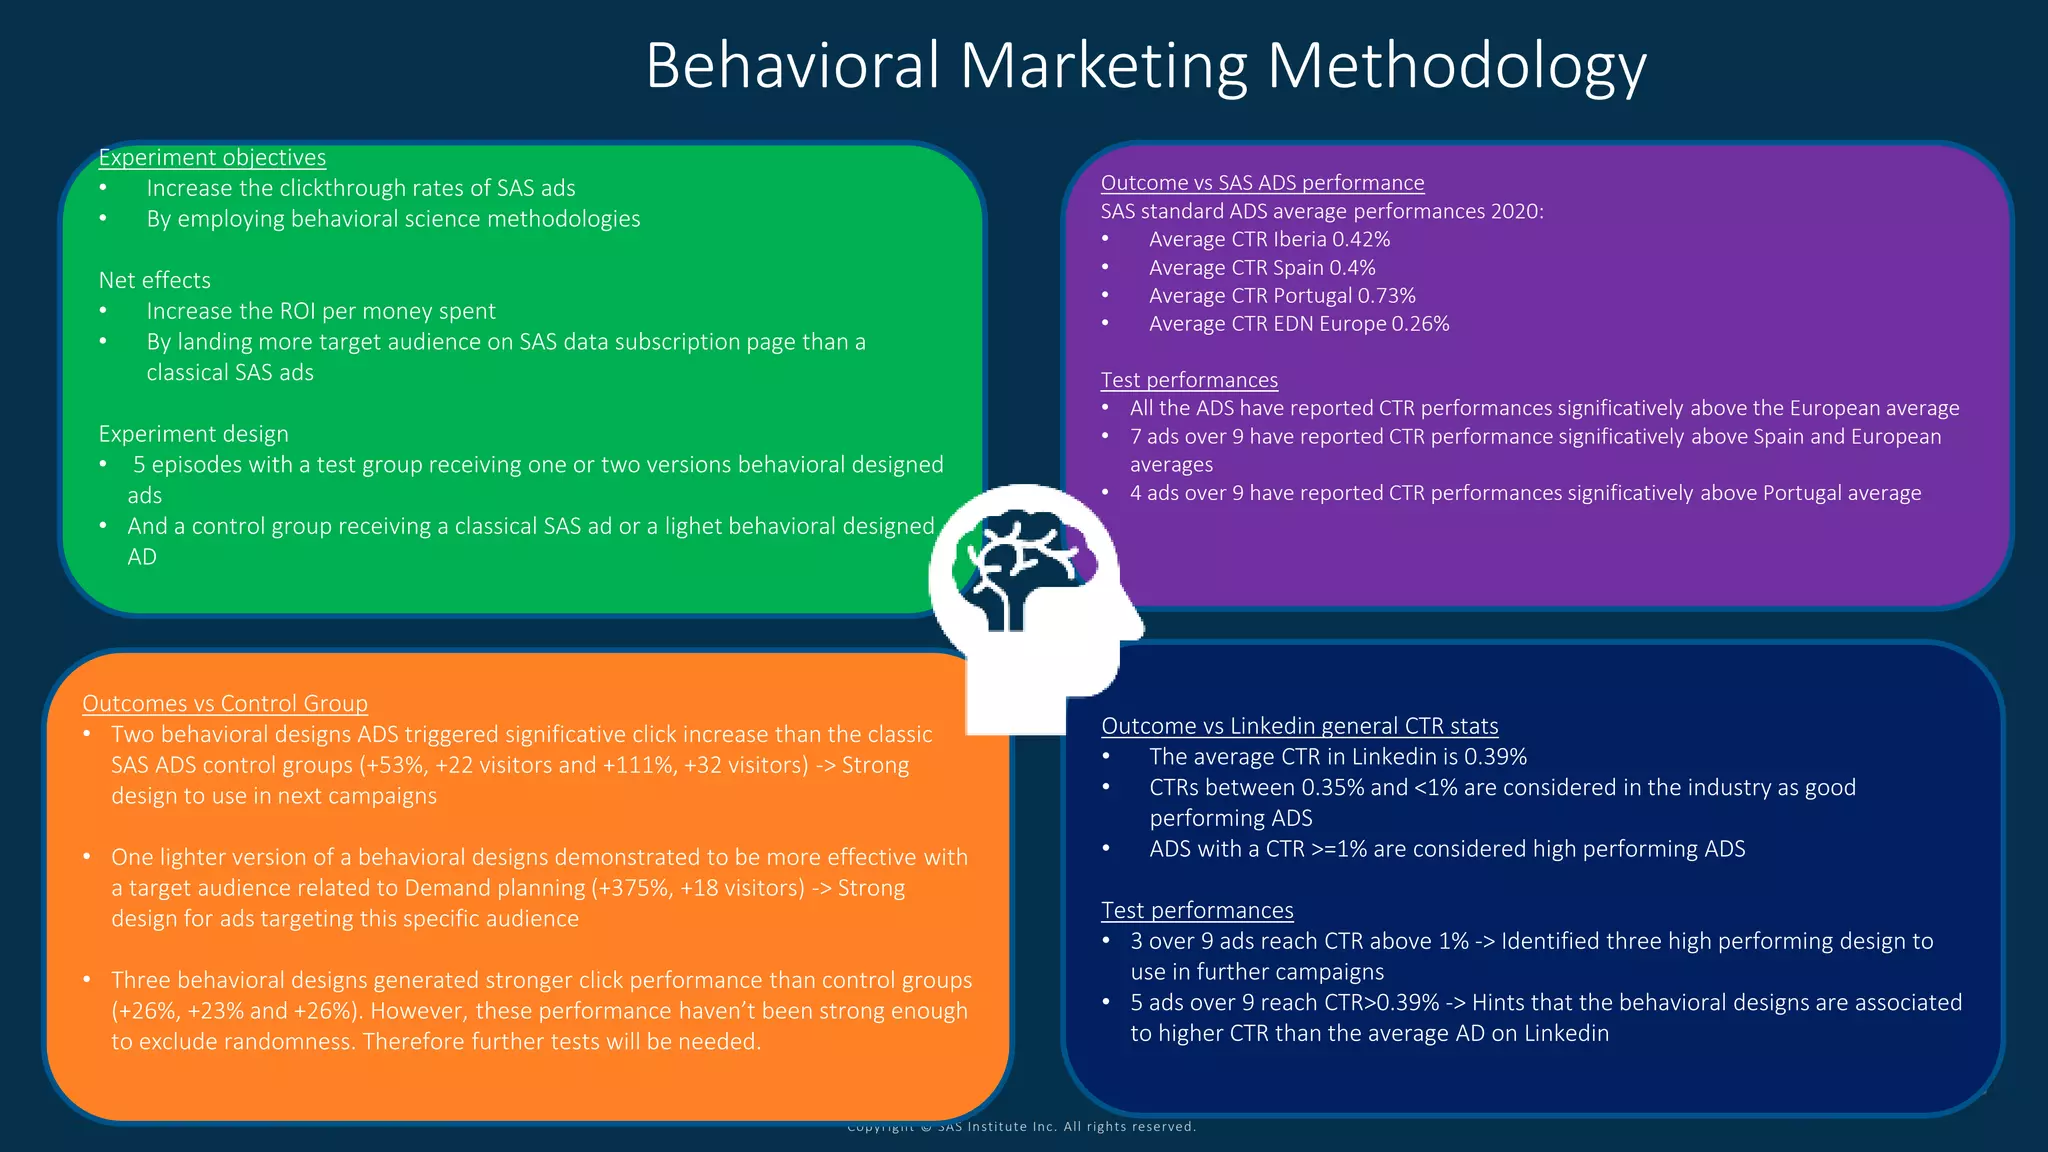

This document discusses the results of several experiments testing behavioral messaging in SAS marketing content. It analyzes the effects of different behavioral components - including images, buttons, copywriting and social proofing - on click-through rates for various analytics-related content targeting data scientists and analysts. Some key findings include: - Applying behavioral design increased click-through rates by 48.7% for content about augmented analytics targeting technical audiences. However, changing the image decreased rates by 5.4%, indicating image choice is important. - Content about machine learning saw click-through rate increases of 53% and 111% when combining behavioral images, buttons, and empowering copywriting. - Targeting quantitative backgrounds, machine learning content