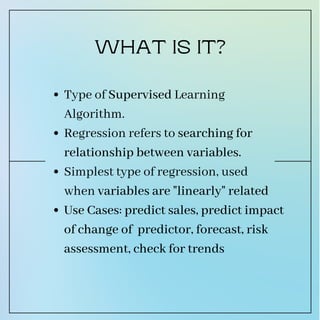
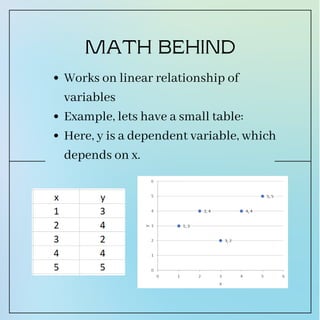
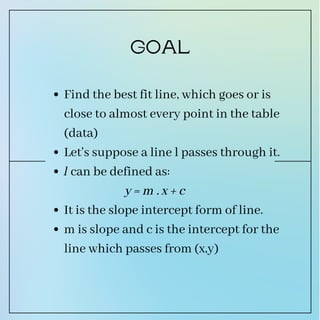
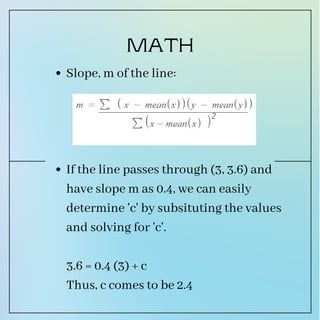
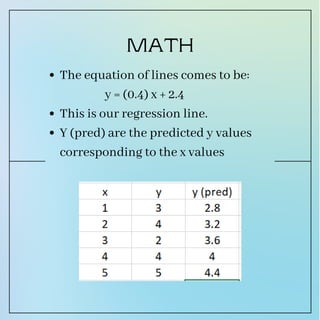
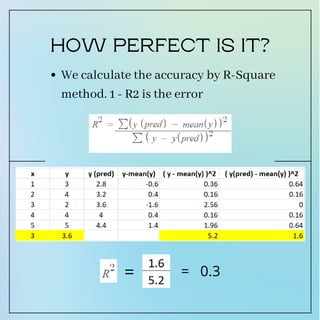
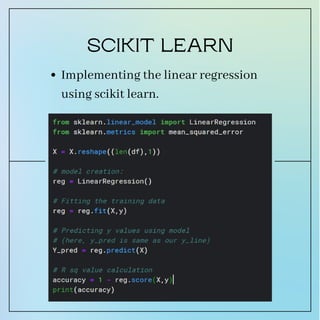
LINEAR
REGRESSION
I N P Y T H O N
Type of Supervised Learning
Algorithm.
Regression refers to searching for
relationship between variables.
Simplest type of regression, used
Use Cases: predict sales, predict impact
of change of predictor, forecast, risk
assessment, check for trends
when variables are "linearly" related
WHAT IS IT?
Works on linear relationship of
variables
Example, lets have a small table:
Here, y is a dependent variable, which
depends on x.
MATH BEHIND
Find the best fit line, which goes or is
close to almost every point in the table
(data)
Let's suppose a line l passes through it.
l can be defined as:
It is the slope intercept form of line.
m is slope and c is the intercept for the
line which passes from (x,y)
y = m . x + c
GOAL
Let's suppose, the best fit line passes
through x mean and y mean.
(3, 3.6) is the mean point for the tabular
data
MATH
Slope, m of the line:
If the line passes through (3, 3.6) and
have slope m as 0.4, we can easily
determine 'c' by subsituting the values
and solving for 'c'.
3.6 = 0.4 (3) + c
Thus, c comes to be 2.4
MATH
2
The equation of lines comes to be:
This is our regression line.
Y (pred) are the predicted y values
corresponding to the x values
y = (0.4) x + 2.4
MATH
We calculate the accuracy by R-Square
method. 1 - R2 is the error
HOW PERFECT IS IT?
= = 0.3
Implementing the linear regression
using scikit learn.
SCIKIT LEARN

Linear Regression.pdf

  • 1.
  • 2.
    Type of SupervisedLearning Algorithm. Regression refers to searching for relationship between variables. Simplest type of regression, used Use Cases: predict sales, predict impact of change of predictor, forecast, risk assessment, check for trends when variables are "linearly" related WHAT IS IT?
  • 3.
    Works on linearrelationship of variables Example, lets have a small table: Here, y is a dependent variable, which depends on x. MATH BEHIND
  • 4.
    Find the bestfit line, which goes or is close to almost every point in the table (data) Let's suppose a line l passes through it. l can be defined as: It is the slope intercept form of line. m is slope and c is the intercept for the line which passes from (x,y) y = m . x + c GOAL
  • 5.
    Let's suppose, thebest fit line passes through x mean and y mean. (3, 3.6) is the mean point for the tabular data MATH
  • 6.
    Slope, m ofthe line: If the line passes through (3, 3.6) and have slope m as 0.4, we can easily determine 'c' by subsituting the values and solving for 'c'. 3.6 = 0.4 (3) + c Thus, c comes to be 2.4 MATH 2
  • 7.
    The equation oflines comes to be: This is our regression line. Y (pred) are the predicted y values corresponding to the x values y = (0.4) x + 2.4 MATH
  • 8.
    We calculate theaccuracy by R-Square method. 1 - R2 is the error HOW PERFECT IS IT? = = 0.3
  • 9.
    Implementing the linearregression using scikit learn. SCIKIT LEARN