Download to read offline
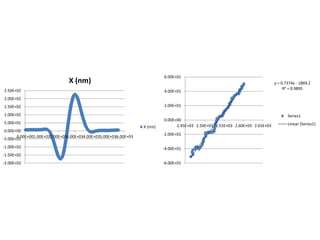


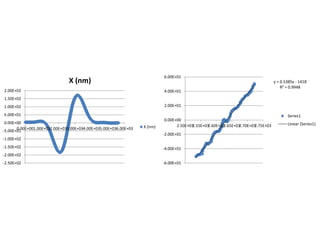


The document contains graphs showing linear regression lines fitted to scatter plots of data points, along with the equations for the linear regression lines and R-squared values. Multiple linear regressions are shown using different x-ranges for the data points.


![[CCKOREA 국제컨퍼런스] OpenCourseware 소개 및 OCW 현황](https://cdn.slidesharecdn.com/ss_thumbnails/3-ocw-100614073635-phpapp01-thumbnail.jpg?width=640&height=640&fit=bounds)


