Download to read offline
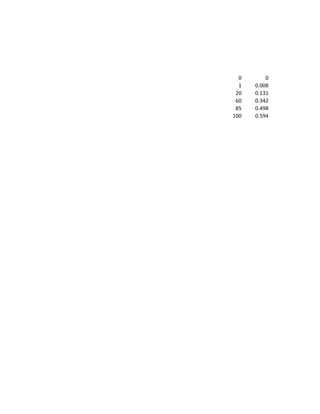

This graph shows the relationship between time (x-axis) and percentage of material dissolved (y-axis) in a linear fashion. It indicates that as time increases, the percentage of material dissolved also increases linearly with an R-squared value very close to 1, demonstrating the data fits very well to a linear regression model.


