Downloaded 16 times
![International Journal of Industrial Engineering Research and Development (IJIERD), ISSN 0976 –
6979(Print), ISSN 0976 – 6987(Online) Volume 4, Issue 1, January - April (2013), © IAEME
in this paper the product-mix problem illustrated as a prototype example [1] refers to a
manufacturing system which may occur in real life applications is being solved through
MATLAB. The figure 1 represents a manufacturing system producing two products labeled P
and Q. The rounded rectangles at the top of the figure indicate the revenue per unit and the
maximum sales per week. For instance we can sell as many as 100 units of P for $90 per unit.
The circles show the raw materials used, and the rectangles indicate the operations that the
products must pass through in the manufacturing process. Each rectangle designates a
machine used for the operation and the time required.
For example product P consists of two subassemblies. RM stands for raw material .To
manufacture the first subassembly, one unit of RM1 passes through machine A for 15
minutes. The output of machine A is moved to machine C where it is processed for 10
minutes. The second subassembly starts with RM2 processed in machine B for 15 minutes.
The output is taken to machine C for 5 minutes of processing. The two subassemblies are
joined with a purchased part in machine D. The result is a finished unit of P. Product Q is
manufactured by a similar process as indicated in the figure1.
P Q
Fig 1
20](https://image.slidesharecdn.com/linearprogramminginmatlab-130402034255-phpapp02/85/Linear-programming-in-matlab-2-320.jpg)
![International Journal of Industrial Engineering Research and Development (IJIERD), ISSN 0976 –
6979(Print), ISSN 0976 – 6987(Online) Volume 4, Issue 1, January - April (2013), © IAEME
The rectangle at the upper left indicates that one machine of each type is available. Each
machine operates for 2400 minutes per week. OE stands for operating expenses. For this case the
operating expenses, not including the raw material cost is $6000. This amount is expended
regardless of amounts of P and Q produced. Our problem is to find out the product mix that
maximizes profit using MATLAB software.
2. FORMULATION OF LINEAR PROGRAMMING MODEL
Let X= Number of P products produced per week
Y= Number of Q products produced per week
Max Z = 45X + 60Y (Weekly revenue)
subject to
15X + 10Y ≤ 2400 (Machine A)
15X + 30Y ≤ 2400 (Machine B)
15X + 5Y ≤ 2400 (Machine C)
10X + 5Y ≤ 2400 (Machine D)
X ≤ 100 (Product P)
Y ≤ 50 (Product Q)
X≥ 0,Y≥ 0 (Nonnegativity)
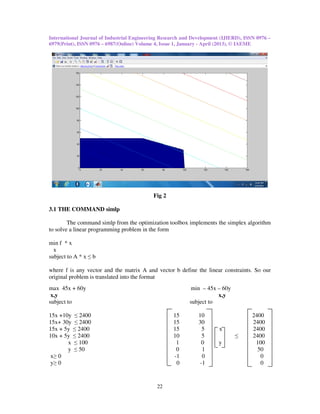
3. SOLUTION USING MATLAB
Since there are only two unknowns involved, we may graph all constraints. The
MATLAB commands [2] given are as follows:
x=0:160 % range of graph
y1=(2400-15.*x)./10; % 15x+10y ≤2400 machine A
area(x,y1)
y2=max((2400-15.*x)./30,0); % 15x+30y ≤2400 machineB
y3=max((2400-15.*x)./5,0); % 15x+5y ≤2400 machineC
y4=max((2400-10.*x)/5,0); % 10x+5y ≤ 2400 machine D
y5=max((100-1.*x)./0,0); % 1x+0y ≤ 100 market constraint P product
y6=max((50-0.*x)./1,0); % 0x+1y ≤ 50 market constraint Q product
ytop=min([y1;y2;y3;y4;y5;y6]); % array of minima
area(x,ytop); % filled area plot
The shaded area enclosed by the constraints is called the feasible region, which is the set of points
satisfying all the constraints. If this region is empty, then the problem is said to be infeasible, and
it has no solution. The lines of equal profit Z are given by Z = 45x + 60y. If we fix Z to, say 100,
then all points (x; y) which satisfy 45x + 60y yield the same profit 100.
hold on;
[u v]=meshgrid(0:160,0:160);
contour(u,v,45*u+60*v);
hold off;
To find the optimal solution, we look at the lines of equal profit to find the corner of the
feasible region which yields the highest profit. This corner can be found at the farthest line of
equal profit which still touches the feasible region as shown in Fig 2.
21](https://image.slidesharecdn.com/linearprogramminginmatlab-130402034255-phpapp02/85/Linear-programming-in-matlab-3-320.jpg)
![International Journal of Industrial Engineering Research and Development (IJIERD), ISSN 0976 –
6979(Print), ISSN 0976 – 6987(Online) Volume 4, Issue 1, January - April (2013), © IAEME
Observe the switching of signs to turn the max into a min and to deal with the ≤ constraints.
Duality in linear programming is a very important concept, more than just a matter of formatting.
The economical interpretation of duality can be simplified into the saying that minimizing the
cost of production is equivalent to maximizing the profit.
Now we are ready to solve the problem. First we set up the vectors and matrices:
f=[-45 -60]
A=[15 10; 15 30;15 5; 10 5; 1 0; 0 1; -1 0; 0 -1]
b=[2400; 2400; 2400; 2400; 100; 50; 0; 0]
The optimization toolbox has the command simlp :
simlp(f,A,b) % optimize
-f*ans % compute profit
f=
-45 -60
A=
15 10
15 30
15 5
10 5
1 0
0 1
-1 0
0 -1
b=
2400
2400
2400
2400
100
50
0
0
ans =
100
30
ans =
6300
23](https://image.slidesharecdn.com/linearprogramminginmatlab-130402034255-phpapp02/85/Linear-programming-in-matlab-5-320.jpg)
![International Journal of Industrial Engineering Research and Development (IJIERD), ISSN 0976 –
6979(Print), ISSN 0976 – 6987(Online) Volume 4, Issue 1, January - April (2013), © IAEME
4. CONCLUSION
The objective of this research work in finding the maximum units of products for
product mix problem is achieved. The final result as derived using MATLAB are as follows:
The values obtained are X = 100 units and Y= 30 units which mean that for the product mix
to optimize profits the manufacturer should produce 100 units of P products per week and 30
units of Q products per week. The net profit would be equal to maximum revenue, Z minus
total operating expenses, OE which comes out to be $300 per week. The extensions of this
research work would be to identify bottlenecks and sensitivity analysis using Fuzzy
Algorithm which allows us to determine how “sensitive” the optimal solution is to changes
in data values. This includes analyzing changes in:
i) An Objective Function Coefficient (OFC)
ii) A Right Hand Side (RHS) value of a constraint.
REFERENCES
[1] Operations Research Models and Methods by Paul A Jensen
[2] B.R Hunt, R.L Lipsman and J.M. Rosenberg. A Guide to MATLAB, for beginners and
experienced users, Cambridge University Press, 2001
[3] Varun Shukla, Anand Handa and Arun Agarwal, “Spectrum Analysis by using MATLAB
Script” International journal of Electronics and Communication Engineering & Technology
(IJECET), Volume 3, Issue 1, 2012, pp. 69 - 75, ISSN Print: 0976- 6464, ISSN Online: 0976
–6472.
[4] Gopichand Allaka, Prasad Raju Kalidindi, Koteswara Rao S, Manibabu Daadi and Abhay
Patnala, “Design of Solid Shafts using MATLAB” International Journal of Mechanical
Engineering & Technology (IJMET), Volume 3, Issue 3, 2012, pp. 645 - 653, ISSN Print:
0976 – 6340, ISSN Online: 0976 – 6359.
24](https://image.slidesharecdn.com/linearprogramminginmatlab-130402034255-phpapp02/85/Linear-programming-in-matlab-6-320.jpg)

This document summarizes a research paper that solves a product mix optimization problem using linear programming in MATLAB. The problem involves maximizing profit from producing two products (P and Q) given constraints on machine time and market demand. The document formulates the problem as a linear program, graphs the feasible region in MATLAB, and uses the simlp command to find the optimal solution: produce 100 units of P and 30 units of Q per week for maximum profit of $6,300. In solving this example problem, the document illustrates how linear programming and MATLAB can be applied to optimize resource allocation and profit in a manufacturing system.