Download to read offline


![Minocqua Broadband Survey
1. Is this your Primary Residence YES NO
2. Do you currently have Internet Service at this address YES NO
3. Who is your Internet Provider: Charter - Frontier - Verizon -AT&T –
Hughes – Wild Blue - Other _________________
4. Are you satisfied with your current service YES NO What is your
monthly cost $________
5. Do you know how fast your current internet service speed is?
___I don’t know [go to www.speedtest.net to find the speed]
___< 1 Megabits ___1-3 Megabits ___3-5 Megabits ___5-10 Megabits
___ > 10 Megabits
Please print your current Minocqua Home Street Address:
___________________________________________________________](https://image.slidesharecdn.com/lincolncounty-130529092431-phpapp02/85/Lincoln-county-64-320.jpg)

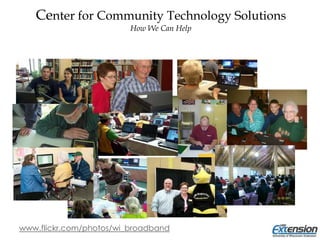
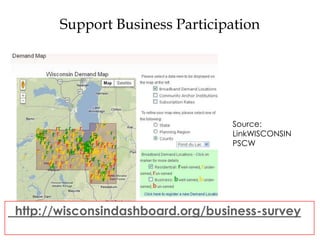
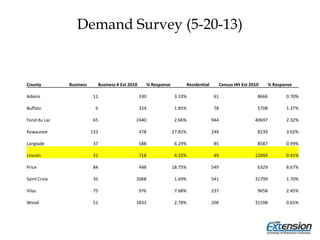
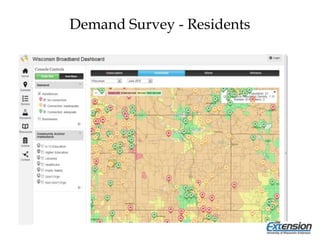


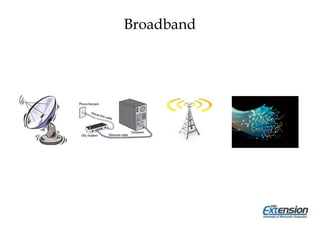
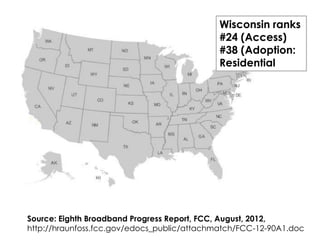
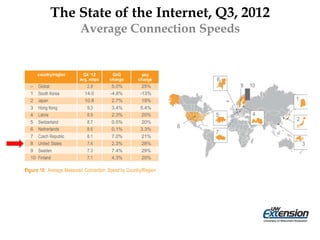
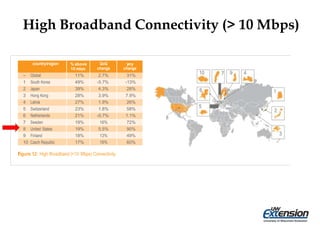
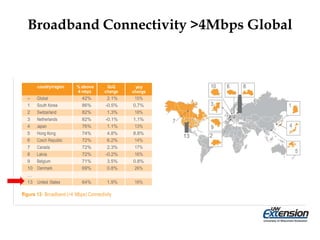
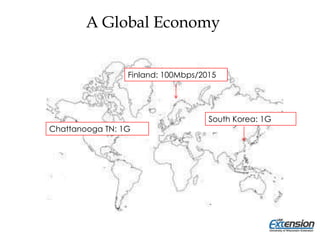
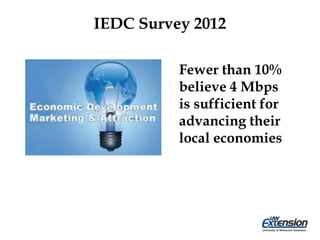
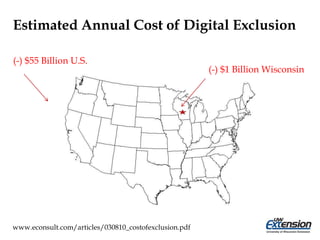
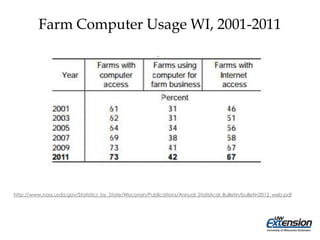
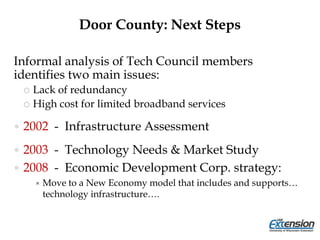
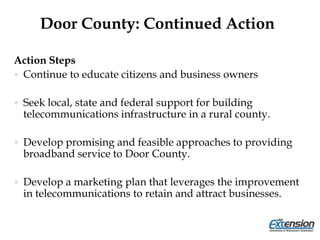
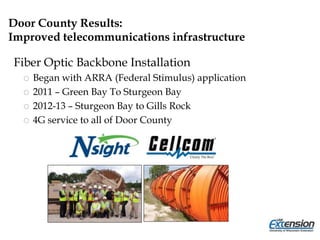
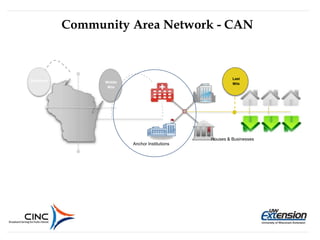
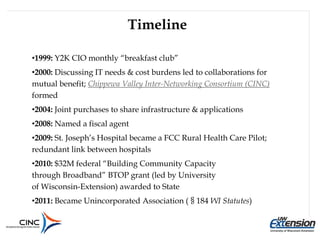
This document summarizes a presentation about broadband expansion in Lincoln County. It discusses the importance of broadband, current broadband speeds and adoption rates, efforts in other Wisconsin communities to expand broadband like in Door County and the Chippewa Valley, and how the Center for Community Technology Solutions can help Lincoln County with broadband planning.


