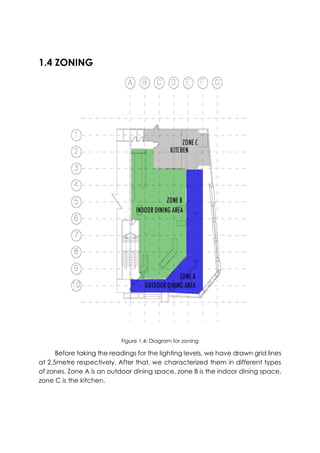
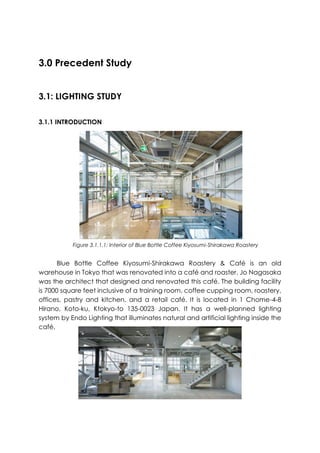
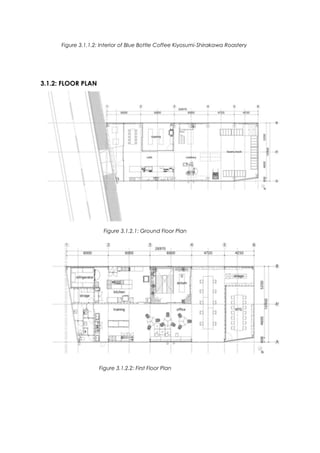
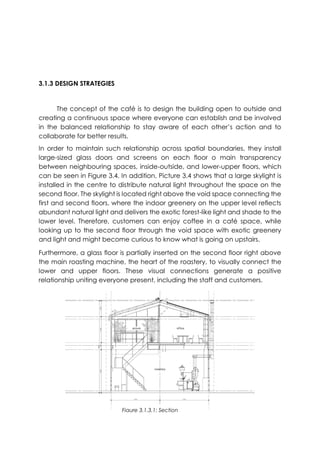
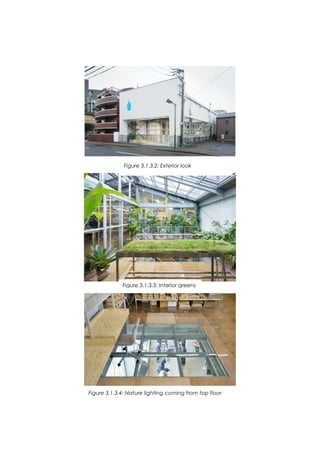
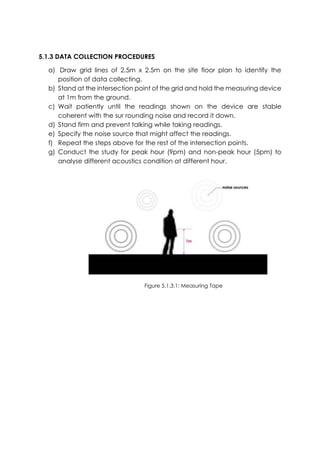
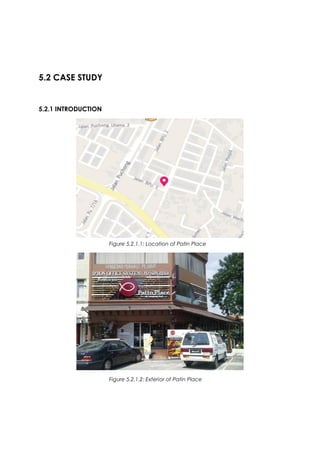
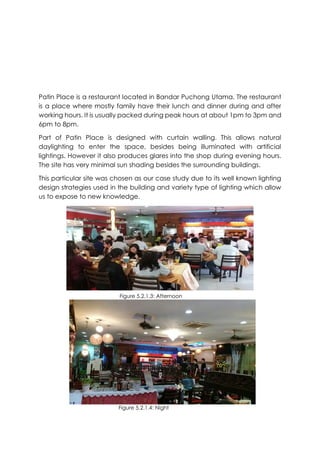
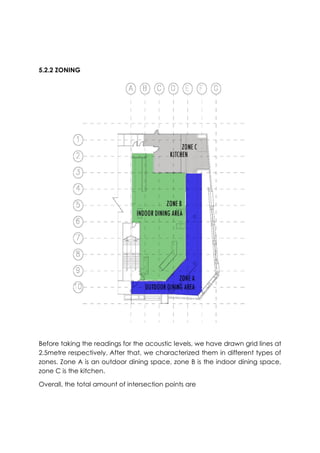
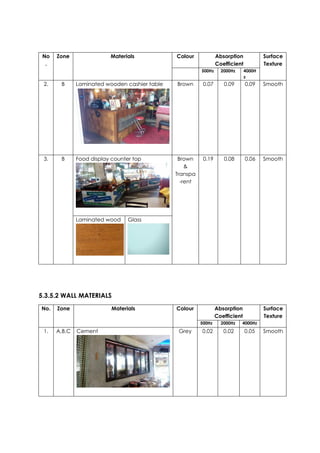
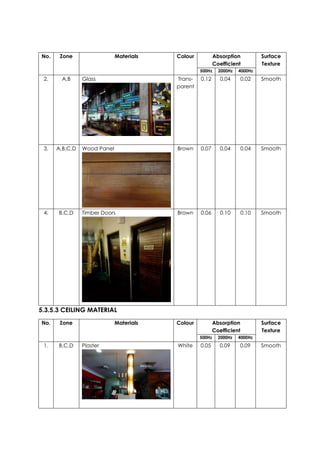
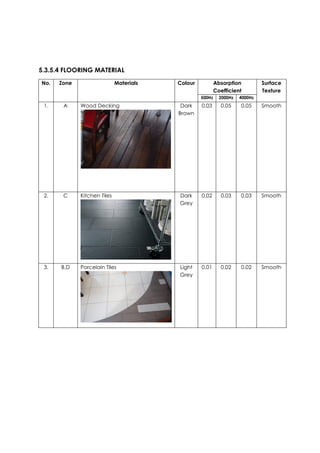
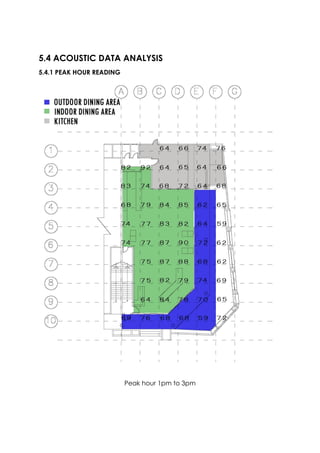
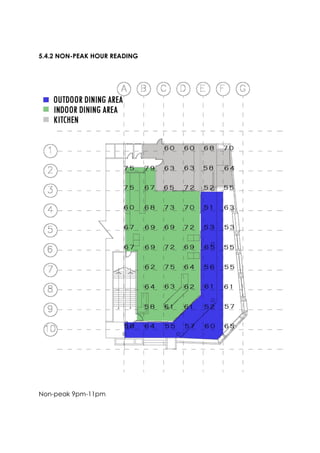
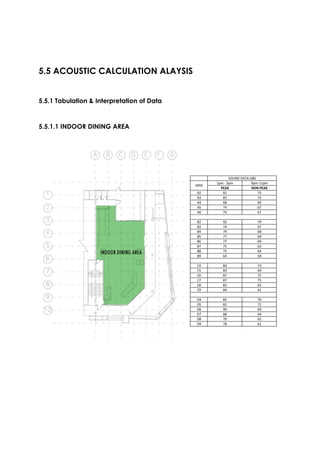
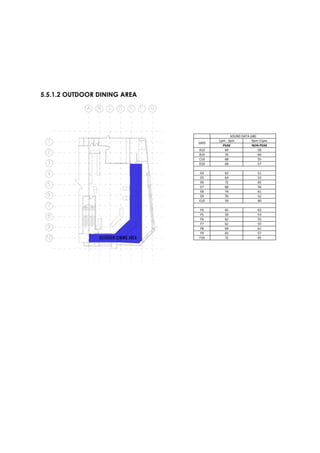
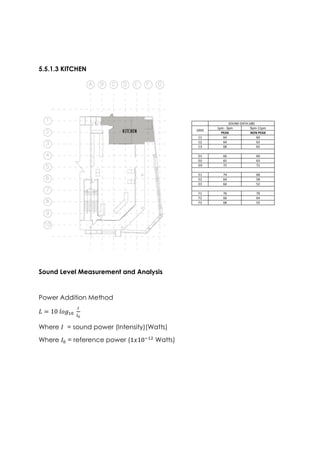
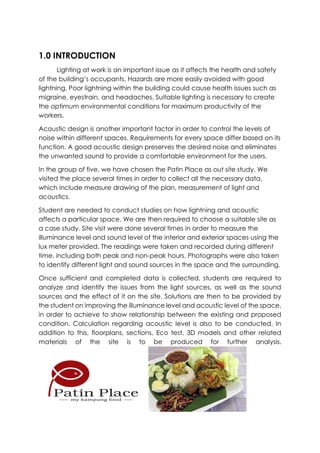
This document outlines a student project evaluating the lighting and acoustic performance of Patin Place, a restaurant in Bandar Puchong Utama. The students aim to understand daylighting, artificial lighting, and acoustics. They will determine the characteristics and functions of lighting and sound within the space. Site visits were conducted to measure illuminance and sound levels during peak and non-peak hours. The students will analyze the data, identify issues, and provide solutions to improve lighting and acoustic levels. Calculations of acoustic parameters will also be conducted.
Lighting and Acoustic Performance Evaluation of Patin Place Restaurant
1. BUILDING SCIENCE II
PROJECT 1: LIGHTING AND ACOUSTIC
PERFORMANCE EVALUATION AND
DESIGN
PATIN PLACE
No 31, Jalan BPU 5, Bandar Puchong Utama
GROUP MEMBERS:
CALVIN SUAH JAKE GINN 0313324
HERN-HYMM DEVINCHI NG 0320526
JASON LIM CHEE SHEN 0316791
WEE BOON BING 0313569
OOI CHIEN SHENG 0320552
LECTURER:
Mr. Rizal
2. CONTENTS PAGE
1.0 INTRODUCTION
1.1 AIMS AND OBJECTIVES
1.2 SITE INTRODUCTION
1.3 TECHNICAL DRAWING
1.4 ZONNING
2.0 LITERATURE REVIEW
2.1 INTRODUCTION TO LIGHT
2.1.2 IMPORTANCE OF LIGHT IN ARCHITECTURE
2.1.3 LUMEN
2.1.4 BRIGHTNESS AND ILLUMINANCE
2.1.5 NATURAL DAYLIGHT
2.1.6 ARTIFICIAL LIGHTING
2.1.7 DAYLIGHT FACTORS AND DISTRIBUTIONS
2.1.8 LUMEN METHOD
2.2 INTRODUCTION TO ARCHITECTURE ACOUSTIC
2.2.1 SOUND PRESSURE LEVEL (SPL)
2.2.2 REVERBERATION TIME (RT)
2.2.3 SOUND REDUCTION INDEX (SRI)
2.2.4 ISSUES OF ACOUSTIC SYSTEM DESIGN
2.2.5 ACOUSTIC DESIGN FOR RESTAURANT
3.0 PERCEDENT STUDY
3.1 LIGHTING STUDY
3.1.1 INTRODUCTION
3.1.2 FLOOR PLAN
3.1.3 DESIGN STRATEGIES
3.1.4 EXISTING LIGHTING SOURCE
3.2 ACOUSTIC STUDY
3.2.1 INTRODUCTION
3.2.2 DESIGN INTENTION
3.2.3 FLOOR PLAN
3.2.4 REVERBERTATION ANALYSIS
3.2.5 ANALYSIS OF SOUND TRANSMISSION CLASS (STC)
3.2.6 NEWLY PROPOSED BAFFLE SYSTEM
3.2.7 CONCLUSION
3. 4.0 LIGHTING PERFORMANCE EVALUATION
4.1 RESEARCH METHODOLOGY
4.1.1 LIGHT MEASURING EQUIPMENT
4.1.2 DATA CIKKECTUIN METHODOLOGY
4.2 CASE STUDY
4.2.1 INTROODUCTION
4.2.2 ZONING
4.3 EXISTING LIGHTING CONDITIONS
4.3.1 EXISTING LIGHTING FIXTURE
4.3.2 EXISTING MATERIAL
4.3.2.1 WALL MATERIAL
4.3.2.2 CEILING MATERIAL
4.3.2.3 FLOORING MATERIAL
4.4 LIGHTING DATA ANALYSIS
4.4.1 DAYLIGHT LUX READING
4.4.2 NIGHTTIME LUX READING
4.5 LIGHTING DATA ANALYSIS
4.5.1 DAYLIGHT FACTOR CALCULATION
4.5.1.1 INDOOR DINNING AREA
4.5.1.2 OUTDOOR DINNING AREA
4.5.1.3 KITCHEN AREA
4.5.2 LIGHT CONTOUR DIAGRAM
4.5.3 ARTIFICIAL LIGHTING
4.5.3.1 INDOOR DINNING AREA
4.5.3.2 OUTDOOR DINNING AREA
4.5.3.3 KITCHEN AREA
4.6 ANALYSIS CONCLUSION
4.7
5.0 ACOUSTIC PERFORMANCE ELVALUATION
5.1 RESEARCH METHODOLOGY
5.1.1 ACOUSTIC MEASURING EQUIPMENT
5.1.2 DATA COLLECTION METHODOLOGY
5.1.3 DATA COLLECTION PROCEDURES
5.2 CASE STUDY
5.2.1 INTRODUCTION
5.2.2 ZONING
5.3 EXISTING NOISE SOURCES
5.3.2 EXTERNAL NOISE
5.3.2.1 SITE CONTEXT
5.3.3 INTERNAL NOISE
5.3.3.1 HUMAN ACTIVITIES
5.3.3.2 SPEAKER
5.3.3.3 AIR CONDITIONERS
5.3.3.4 ELECTRIC APPLIANCES
5.3.4 LOCATIONS OF THE NOISE SOURCES
4. 5.3.5 MATERIAL AND PROPERTY
5.3.5.1 FURNITURE MATERIAL
5.3.5.2 WALL MATERIAL
5.3.5.3 CEILING MATERIAL
5.3.5.4 FLOORING MATERIAL
5.4 ACOUSTIC DATA ANALYSIS
5.4.1 PEAK HOUR READING
5.4.2 NON-PEAK HOUR READING
5.5 ACOUSTIC CALCULATION ALAYSIS
5.5.1 TABULATION & INTERPRETATION OF DATA
5.5.1.1 INDOOR DINNING AREA
5.5.1.2 OUTDOOR DINNING AREA
5.5.1.3 KITCHEN
5.5.2 CALCULATION OF AREA (PEAK AND NON-PEAK)
5.5.3 REVERBERATION TIME
5.5.3.1 INDOOR DINNING AREA
5.5.3.2 OUTDOOR DINNING AREA
5.5.3.3 KITCHEN
5.5.3.4 CALCULATION MATERIAL ABSORPTION COEF. 500HZ (PEAK & NON-PEAK)
5.6 SOUND REDUCTION INDEX (SRI)
5.6.1 INDOOR & OUTDOOR DINNING AREA
5.7 ANALYSIS
5.8 ANALYSIS CONCLUSION
6.0 BIBLIOGRAPHY
5. 1.0 INTRODUCTION
Lighting at work is an important issue as it affects the health and safety
of the buildingβs occupants. Hazards are more easily avoided with good
lightning. Poor lightning within the building could cause health issues such as
migraine, eyestrain, and headaches. Suitable lighting is necessary to create
the optimum environmental conditions for maximum productivity of the
workers.
Acoustic design is another important factor in order to control the levels of
noise within different spaces. Requirements for every space differ based on its
function. A good acoustic design preserves the desired noise and eliminates
the unwanted sound to provide a comfortable environment for the users.
In the group of five, we have chosen the Patin Place as out site study. We
visited the place several times in order to collect all the necessary data,
which include measure drawing of the plan, measurement of light and
acoustics.
Student are needed to conduct studies on how lightning and acoustic
affects a particular space. We are then required to choose a suitable site as
a case study. Site visit were done several times in order to measure the
illuminance level and sound level of the interior and exterior spaces using the
lux meter provided. The readings were taken and recorded during different
time, including both peak and non-peak hours. Photographs were also taken
to identify different light and sound sources in the space and the surrounding.
Once sufficient and completed data is collected, students are required to
analyze and identify the issues from the light sources, as well as the sound
sources and the effect of it on the site. Solutions are then to be provided by
the student on improving the illuminance level and acoustic level of the space,
in order to achieve to show relationship between the existing and proposed
condition. Calculation regarding acoustic level is also to be conducted. In
addition to this, floorplans, sections, Eco test, 3D models and other related
materials of the site is to be produced for further analysis.
6. 1.1 AIMS AND OBJECTIVES
The aim and objectives are as followings:
- To understand the day-lighting, artificial lighting and acoustic
characteristic.
- To determine the characteristics and function of day-lighting & artificial
lighting and sound & acoustic within the intended space.
- To critically report and analyses the space and suggest ways to
improve the lighting and acoustic qualities within the space.
- To also be able to produce a complete documentation on analysis of
space in relation to lighting requirement.
- To able to evaluate and explore the improvisation by using current
material and technology in relevance to present construction industry.
This projects also aims to help us to get basic understanding and analysis of
lighting and acoustics design layout and arrangements by using certain
methods or calculations. We will be choosing three spaces and by
understanding the volume and area of each functional space will also help
in determining the lighting requirement based acoustical or lighting
inadequacy that is reflected in the data collection.
Patin Place is famous for their dry steam tempoyak that is cook in their ancient
brick oven, it seem like steaming the patin but itβs actually burning steam.
Have a look in their Facebook page!!!!!
https://www.facebook.com/PatinPlace/
Promotion code
PPBPUTEMPOYAK valid till 2016 DEC 31
8. Patin Place is a restaurant located in Bandar Puchong Utama. The restaurant
is a place where mostly family have their lunch and dinner during and after
working hours. Itβs famous for their ancient brick oven tempoyak. It is usually
packed during peak hours at about 1pm to 3pm and 6pm to 8pm.
Part of Patin Place is designed with curtain walling. This allows natural
daylighting to enter the space, besides being illuminated with artificial
lightings. However it also produces glares into the shop during evening hours.
The site has very minimal sun shading besides the surrounding buildings.
This particular site was chosen as our case study due to its well-known lighting
design strategies used in the building and variety type of lighting which allow
us to expose to new knowledge.
Figure 1.2.3: The interior look during afternoon
Figure 1.2.4: The exterior look during evening
9. 1.3 TECHICAL DRAWING
SECTION A-A
SCALE 1:200]
SECTION B-B
SCALE 1:200]
RIGHT ELEVATION
SCALE 1:200]
FRONT ELEVATION
SCALE 1:200]
10. 1.4 ZONING
Figure 1.4: Diagram for zoning
Before taking the readings for the lighting levels, we have drawn grid lines
at 2.5metre respectively. After that, we characterized them in different types
of zones. Zone A is an outdoor dining space, zone B is the indoor dining space,
zone C is the kitchen.
11. 2.0 LITERATURE REVIEW
2.1 INTRODUCTION TO LIGHT
Light is a form of energy manifesting itself electromagnetic radiation and
is closely related to other forms of electromagnetic radiation such as radio
waves, radar, microwaves, infrared and ultraviolet radiation and x-rays. Light
that can be detected by the human eye are usually known as visible light and
have wavelength in the range of 400 β 700 nanometers. Light source are
mediums that produces light and the main source of lighting are from the sun.
There are two types of lighting which are natural lighting and artificial lighting.
Natural lighting comes from the source of the sun whereas artificial lighting
comes form an instrument that produces light.
2.1.2 IMPORTANCE OF LIGHT IN ARCHITECTURE
The word of space is directly connected to the way light integrates with
it. Light interact with us and environment by our vision, experience and
interpretation on elements. Based on architecture study, in any dimension we
can analyze such as space, material or color, it is essentially dependent on the
lighting situation that involves both the object and the observer. The dynamic
daylight and the controlled artificial lighting are able to affect not only distinct
physical measurable setting in space, but also to instigate and provoke
different visual experiences and moods. In addition, light can perceive
different atmospheres in the same physical environment. It also integrates an
element of basic relevance for design of spaces which plays a significant role
in the discussion of quality in architecture.
12. 2.1.3 LUMEN
The lumen (symbol: lm) is the SI derived unit of luminous flux and it is a
measure of the total quantity of visible light emitted by a source. It is equal to
the amount of light emitted per second in a unit solid angle of one steadier
from a uniform source of one candela. Luminous flux is the power in which light
is emitted from a source. Therefore, the amount of light that is emitted from a
source is measured in lumen value. The brighter the light is, the more lumen it
measured in lumen value. The brighter the light is. The more lumen it measures.
The dimmer the light is, the less lumen it measures. The following table shows
the amount of lux needed for different applications at working (1.5m) height.
Figure2.1.3: Table Suggested Lux Level
13. 2.1.4 BRIGHTNESS AND ILLUMINANCE
Light is emitted from a source, lumens will light up the surface. Illuminance
is defined as the number of lumens falling at square meter of a surface.
Illuminance is measure in the unit LUX and the measurements are normally
recorded with the help of an illuminance meter or a photometer. The closer
illuminated area to the light source, the higher the illuminated values are
incident rays landing on the horizontal surfaces are known as horizontal
illuminance landing on the vertical surfaces. On a normal sunny day, the
illuminance produced during the daylight has a range of 150,000 lux to 1,000
lux.
2.1.5 NATURAL DAYLIGHT
Natural daylighting is a passive method of lighting up a space. It is the
controlled admission of natural sunlight and diffuse skylight into a building to
reduce electric lighting and saving energy. By providing a direct link to the
dynamic and perpetually evolving patterns of outdoor illumination, daylighting
helps create a visually stimulating and productive environment for building
occupants, while reducing as much as one-third of total building energy costs.
2.1.6 ARTIFICIAL LIGHTING
Artificial lighting by definition is any light that does not come from
sunlight. Artificial lighting are technical instruments that produces light through
the conversion of electrical energy into radiation and light. Artificial lighting has
two types of light source which is the incandescent lamp whereby light is
generated when the filament is radiated at high temperature and luminescent
lamp when light is produces through excited electrons. We do not receive
sunlight 24 hours and therefor it is important to have artificial lighting as a
substitute. Also, some spaces requires artificial lighting to create different
experiences. Some space are to be preferred to be more warmer and intimate
space. Artificial lighting is also important to certain range of visibility for quality
of the space. Artificial light is the ensure that the occupants have a clear visual
image of where they are as well as to ensure the comfort of the occupants.
14. 2.1.7 DAYLIGHT FACTORS AND DISTRIBUTIONS
The daylight factor (DF) is commonly used to determine the ration of
internal light level to external light level and is defined as following:
DF =
πΈπ
πΈπ
x 100%
Where:
DF: Daylight factors
Ei: illuminance due to daylight at a point on the indoors working plane
Eo: Simultaneous outdoor illuminance on a horizontal plane from an
unobstructed hemisphere of overcast sky.
There are a few factors that affects the Ei which are:
i. The sky component (SC): direct light from a patch of sky visible at the
point considered.
ii. The internally reflected component (IRC): The light entering through
glazing and reflected from an internal surface.
iii. The externally reflected component (ERC): The light reflected from an
exterior surface and then reaching the point considered.
Figure 2.1.7.1: Table of distribution of daylight factor
source: MS1525, 2007
15. The Light intensity decrease by the square of the distance from the point
source. Therefore, 500 lux directed over ten square meters will be dimmer than
the same amount spread over one square meter.
Figure 2.1.7.2: Table Suggested daylight factor
Source: MS1525, 2007
16. 2.1.8 LUMEN METHOD
The quantity of light reaching a certain surface is usually the main
consideration in designing a lighting system. This quantity of lighting is specified
by illuminance measured in lux, and as this level varies across the working
plane, an average figure is used.
Lumen method is an indoor calculation methodology used to identify the
number of luminaries or lamp fixtures required to achieve a given average
illuminance level of space. It is done by calculating the number of lamp
installed to ensure it has enough level of illuminance. The method is a
commonly used technique of lighting design, which is valid, if the light fittings
(luminaires) are to be mounted overhead in a regular pattern.
N =
π¬ π π¨
π π πΌπ π π΄π
Where:
N: Number of lamps required.
E: Illuminance level required (lux).
A: Area at working plane height (m2).
F: Average luminous flux from each lamp (lm).
UF: Utilizations factor, an allowance for the light distribution of the luminaire and
the room surfaces.
MF: Maintenance factor, an allowance for reduced light output because of
deterioration and dirt.
17. Room index, RI is the ration of room plan area to half the wall area between
the working and luminaire planes:
RI =
π³ π πΎ
π―π π ( π³+πΎ )
Where:
L: Length of room
W: Width of room
Hm: Mounting height, i.e. the vertical distance between the working plan and
the luminaire.
Maintenance factor, MF is multiple of factors;
MF = LLMF π LSF π LMF π RSMF
Where:
LLMF: Lamp lumen maintenance factor
MSF: Lamp survival factor
LMF: Luminaire maintenance factor
RSMF: Room surface maintenance factor
Normally, when MF cannot be found, the value 0.8 is used.
18. 2.2: INTRODUCTION TO ARCHITECTURE ACOUSTIC
Architecture acoustic is the branch of physic study that deals with the
production, control, transmission, reception and effects of sound. The study of
acoustics is important when designing a desirable atmosphere with concern
and control of sound in spaces. The aim of the study is to preserve and
enhanced desired sound in one space and on the other hand reduce or
eliminate sound that interrupt with our activities known as noise.
2.2.1 SOUND PRESSURE LEVEL (SPL)
It is a term most often used in measuring the magnitude of sound in
decibels (dB). It is a relative quantity in that it is the ratio between the actual
sound pressure and a fixed reference pressure. Sound Pressure Level of a place
can be measured with a sound level meter weighted according to a specific
frequency response pattern.
Figure 2.3.2.1: Example of sound pressure levels
19. Calculation of sound pressure can be calculated with this formula:
2.2.2 REVERBERATION TIME (RT)
Reverberation is the prolongation of sound as a result of successive
reflections in an enclosed space after the sound source is turned off.
Reverberation time is defined as the length of time required for sound to decay
6 decibels from its initial level. However, a reverberation is different from than
an echo where the former is perceived when the reflected sound wave
reaches your ear in less than 0.1 second after the original sound wave. There is
no time delay between the perception of the reflected sound wave and the
original sound wave since the original sound wave is still held in memory.
Reverberation Time (RT) is an important index for describing the acoustical
quality of an enclosure.
Formula:
Where:
RT: Reverberation time (s)
V : Volume of the room (cu.m)
A: Total absorption of room surfaces (sq.m sabins)
20. 2.2.3 SOUND REDUCTION INDEX (SRI)
The Sound Reduction Index (SRI) or Transmission Loss TL of a partition
measures the number of decibels lost when a sound of a given frequency is
transmitted through the partition.
Formula:
2.2.4 ISSUES OF ACOUSTIC SYSTEM DESIGN
It is essential to obtain acoustic comfort to a certain level of satisfaction
amongst users within the space. The two main aspects that contributes to
acoustic comfort are indoor and outdoor noise. Spatial acoustic may
contribute to the productivity in a particular space which depends on the
function and type of users occupying the space. This can be seen in spaces
that require music setting, where proper sound isolation helps create a musical
space. Improper acoustic design may backfire if not implemented properly as
noise is an increasing public health problem. It can result in following health
effects such as hearing loss, sleep disturbances and performance reduction.
Therefore, proper acoustical design should be of importance to ensure
comfort in spaces occupied by users for prolonged hours.
23. 3.1.2: FLOOR PLAN
Figure 3.1.1.2: Interior of Blue Bottle Coffee Kiyosumi-Shirakawa Roastery
Figure 3.1.2.1: Ground Floor Plan
Figure 3.1.2.2: First Floor Plan
33. These changes may include changing the glass to another material such as
wood or creating a small vestibule at the entrances. Adding absorptive
insulation (e.g. fibreglass batts, blow-in cellulose, recycled cotton denim batts)
in the wall cavity increases the STC for fibreglass to more than 50 with cotton
denim, depending on stud and screw spacing. Doubling up the drywall in
addition to fibreglass insulation can yield an even higher STC provided the wall
gaps and penetrations are sealed properly.
In contrast to that, improving the reverberation time is a much more realistic
change. In order to do this, a new baffle system is proposed by eliminating the
metal baffles and acoustical blanket, replacing them with floating fibreglass
sound absorbing panels that are faced in perforated metal.
3.2.6 NEWLY PROPOSED BAFFLE SYSTEM
Figure 3.2.5.2: Absorptive insulation Figure 3.2.5.3: Glass can help to
baffle sound
36. 4.0 LIGHTING PERFORMANCE EVALUATION
4.1 RESEARCH METHODOLOGY
4.1.1 LIGHT MEASURING EQUIPMENT
Lux Meter
Lux meter also known as Light meter is used to measure the intensity of
light illumination as distinguished by the human eye. The value gained does
not correspond to the object value of energy radiated, as different
wavelength within specific spectrum is perceived with varying sensitivity by the
eye. Therefore, lux meter reading is the reading that are taken into
consideration of this variables.
Most lux meter registers brightness with an integrated photodetector. The
photodetector is held perpendicular to the light source for optimal exposure.
Readouts are presented via digital LCD display. Most lux meter has
measurement in variable range. The model of lux meter used in this case study
is Lux LX-101.
Figure 2.5: Sound Level Meter Device
Figure 4.1.1.1: Lux Meter
37. 4.1.2 DATA COLLECTION METHODOLOGY
Procedure
a) Ground floor plan is measured and drawn.
b) 4 zones of case study area is determined and plotted with grid
lines.
c) Measurement is taken at 2.5m and 2.5m high at each
intersection points at different time (Daytime and Night time)
d) Procedure 2 is repeated.
Figure 4.1.2.1: Position height of lux meter during measurement
38. 4.2 CASE STUDY
4.2.1 INTRODUCTION
Figure 4.2.1.1: Location of Patin Place
Figure 4.2.1.2: Exterior of Patin Place
39. Patin Place is a restaurant located in Bandar Puchong Utama. The restaurant
is a place where mostly family have their lunch and dinner during and after
working hours. It is usually packed during peak hours at about 1pm to 3pm and
6pm to 8pm.
Part of Patin Place is designed with curtain walling. This allows natural
daylighting to enter the space, besides being illuminated with artificial
lightings. However it also produces glares into the shop during evening hours.
The site has very minimal sun shading besides the surrounding buildings.
This particular site was chosen as our case study due to its well-known lighting
design strategies used in the building and variety type of lighting which allow
us to expose to new knowledge.
Figure 4.2.1.3: Interior afternoon artificial lighting
Figure 4.2.1.4: Exterior evening artificial lighting
40. 4.2.2 ZONING
Before taking the readings for the lighting levels, we have drawn grid lines at
2.5metre respectively. After that, we characterized them in different types of
zones. Zone A is an outdoor dining space, zone B is the indoor dining space,
zone C is the kitchen.
41. 4.3 EXISTING LIGHTING CONDITIONS
Figure 4.3.1: Ground Floor Plan with
different type of artificial lighting
42. 4.3.1 EXISTING LIGHTING FIXTURE
Symbol
Name of Light Round Pendant Light
Light Bulb Brand Philips
Type of Fixture Wall Mounted Light Fixture
Type of Light Bulb Used Compact Fluorescent Spiral Bulb
Type of Luminaries Warm White
Wattage 18
Light Output, lm 1500
Color Temperature, K 2700
Color Rendering Index, CRI 90 (Excellent)
Lifetime of Lamp (hrs) 6000
Lumen Maintenance Factor 0.8
43. Symbol
,
Name of Light Ceiling Mounted Light
Light Bulb Brand Philips
Type of Fixture Ceiling Mounted Light Fixture
Type of Light Bulb Used Compact Fluorescent Stick Bulb
Type of Luminaries Warm White
Wattage 18
Light Output, lm 1500
Color Temperature, K 2700
Color Rendering Index, CRI 90 (Excellent)
Lifetime of Lamp (hrs) 6000
Lumen Maintenance Factor 0.8
44. Symbol
Name of Light LED Ceiling Mounted Light
Light Bulb Brand Recessed LED Trim
Type of Fixture Ceiling Mounted Light Fixture
Type of Light Bulb Used LED Bulb
Type of Luminaries Cool
Wattage 65
Light Output, lm 690
Color Temperature, K 2700
Color Rendering Index, CRI 92 (Excellent)
Lifetime of Lamp (hrs) 50,000
Lumen Maintenance Factor 0.7
45. Symbol
,
Name of Light LED Suspended Light
Light Bulb Brand MR.DIY
Type of Fixture Suspended Light Fixture
Type of Light Bulb Used LED Bulb
Type of Luminaries Warm White
Wattage 43
Light Output, lm 520
Color Temperature, K 3000
Color Rendering Index, CRI 92 (Excellent)
Lifetime of Lamp (hrs) 15,000
Lumen Maintenance Factor 0.7
46. Symbol
Name of Light LED Candle Lamp
Light Bulb Brand TEC
Type of Fixture LED Candle Light Fixture
Type of Light Bulb Used LED Bulb
Type of Luminaries Warm White
Wattage 3
Light Output, lm 520
Color Temperature, K 3000
Color Rendering Index, CRI 90 (Excellent)
Lifetime of Lamp (hrs) 15,000
Lumen Maintenance Factor 0.7
47. Symbol
Name of Light Suspended Fluorescent Light
Light Bulb Brand GE Tri-Tech Plus
Type of Fixture Suspended Fluorescent Fixture
Type of Light Bulb Used Fluorescent Tube Light
Type of Luminaries Cool
Wattage 36
Light Output, lm 3100
Color Temperature, K 6500
Color Rendering Index, CRI 85 (Excellent)
Lifetime of Lamp (hrs) 15,000
Lumen Maintenance Factor 0.8
48. 4.3.2 EXISTING MATERIAL
No. Zone Materials Colour Reflectance Surface
1. A,B Seats with cushioning Dark
colour
25 smooth
Wood Frame Cushion
No
.
Zone Materials Colour Reflectan
ce
Surface
2. B Laminated wooden cashier table Brown 25 smooth
3. B Food display counter top Brown
&
Transpa
-rent
40 smooth
Laminated wood Glass
49. 4.3.2.1 WALL MATERIAL
No. Zone Materials Colour Reflectance Surface
1. A,B,C Cement Grey 35 smooth
No. Zone Materials Colour Reflectance Surface
2. A,B Glass Trans-
parent
0 smooth
. A,B,C,D Wood Panel Brown 25 smooth
4. B,C,D Timber Doors Brown 25 smooth
50. 4.3.2.2 CEILING MATERIAL
No. Zone Materials Colour Reflectance Surface
1. B,C,D Plaster White 60 smooth
4.3.2.3 FLOORING MATERIAL
No. Zone Materials Colour Reflectance Surface
1. A Wood Decking Dark
Brown
25 smooth
2. C Kitchen Tiles Dark
Grey
70 smooth
3. B,D Porcelain Tiles Light
Grey
70 smooth
54. 4.5.1.1 INDOOR DINING AREA
Time Weather
Luminance
1m (lux)
Average
Luminance
1.5m (lux)
Average
1 β 3 p.m. Clear sky 14 β 157 59.32 13 β 117 64.48
Average lux Reading 1 β 3 p.m.
1 m 59.32
1.5 m 64.48
Average lux Value (lux)
59.32 + 64.48
2
= 61.9 β ππ
Luminance Level (lux) Example
120,000 Brightest Sunlight
110,000 Bright Sunlight
20,000 Shade illuminated by entire blue sky
1000 β 2000 Typical overcast day
400 Sunrise or Sunset on clear day
<200 Extreme or Darkest Storm Clouds
40 Fully overcast, sunset/sunrise
55. Daylight Factor Calculation Formula
D =
Einternal
Eexternal
Γ 100%
Where, Einternal = 62 lux
Eexternal = 20 000 lux
β΄ D =
62
20000
Γ 100%
= 0.31 %
Zone DF (%) Distribution
Very Bright >6 Large (including thermal and glare problem)
Bright 3 β 6 Good
Average 1 β 3 Fair
Dark 0 - 1 Poor
56.
57. 4.5.1.2 OUTDOOR DINING AREA
Time Weather
Luminance
1m (lux)
Average
Luminance
1.5m (lux)
Average
1 β 3 p.m. Clear sky 200 β 1221 533.17 61 β 870 352.06
Average lux Reading 1 β 3 p.m.
1 m 533.17
1.5 m 352.06
Average lux Value (lux)
533.17 + 352.06
2
= 442.6 β πππ
Luminance Level (lux) Example
120,000 Brightest Sunlight
110,000 Bright Sunlight
20,000 Shade illuminated by entire blue sky
1000 β 2000 Typical overcast day
400 Sunrise or Sunset on clear day
<200 Extreme or Darkest Storm Clouds
40 Fully overcast, sunset/sunrise
58. Daylight Factor Calculation Formula
π· =
πΈπππ‘πππππ
πΈππ₯π‘πππππ
Γ 100%
Where, πΈπππ‘πππππ = 443 lux
πΈππ₯π‘πππππ = 20 000 lux
β΄ π· =
443
20000
Γ 100%
= 2.22 %
Zone DF (%) Distribution
Very Bright >6 Large (including thermal and glare problem)
Bright 3 β 6 Good
Average 1 β 3 Fair
Dark 0 - 1 Poor
59.
60. 4.5.1.3 KITCHEN AREA
Time Weather
Luminance
1m (lux)
Average
Luminance
1.5m (lux)
Average
1 β 3 p.m. Clear sky 49 - 660 172.67 30 β 800 223.33
Average lux Reading 1 β 3 p.m.
1 m 172.67
1.5 m 223.33
Average lux Value (lux)
172.67 + 223.33
2
= πππ
Luminance Level (lux) Example
120,000 Brightest Sunlight
110,000 Bright Sunlight
20,000 Shade illuminated by entire blue sky
1000 β 2000 Typical overcast day
400 Sunrise or Sunset on clear day
<200 Extreme or Darkest Storm Clouds
40 Fully overcast, sunset/sunrise
Daylight Factor Calculation Formula
π· =
πΈπππ‘πππππ
πΈππ₯π‘πππππ
Γ 100%
61. Where, πΈπππ‘πππππ = 198 lux
πΈππ₯π‘πππππ = 20 000 lux
β΄ π· =
198
20000
Γ 100%
= 0.99 %
Zone DF (%) Distribution
Very Bright >6 Large (including thermal and glare problem)
Bright 3 β 6 Good
Average 1 β 3 Fair
Dark 0 - 1 Poor
62. 4.5.2 Light Contour Diagram
Figure X: Light contour during the night
Figure X showed the light contour during the night in the restaurant
during the day. The space with the highest value of illuminance is the dining
zone which can reach above 704lux as most of the lightings are located at
the centre of the restaurant. However, the lux reading is getting reduce from
the interior to exterior because the restaurant is using the street light to
achieve beautiful views from the restaurant.
63. Figure Y: Light contour during the day
Figure Y showed the light contour during the day in the restaurant. The
highest illuminance of the space can reach 704lux in the interior with the
concentration spot for the lightings. Besides that, the exterior of the restaurant
has a lower lux reading because there are a lot of bamboo curtains as
shading devices are used and lights are off during the day to achieve the
natural ventilation and can save the electrical energy for the restaurant.
70. β΄ 5 more Suspended Fluorescent Tube required to fulfil MS 1525
standard.
71. 4.6 ANALYSIS CONCLUSION
Based on the data collected, natural lighting in Patin Place is relatively good
based on the daylight factor calculation. The sufficiency of day lighting
strongly influenced by the openings provided. The strategic location at the
corner lot had made the shop a successful place for natural lighting.
However, based on the data collected, there is a huge contrast in daylight
factor of the certain points. This is caused by the existing partition and
furniture being separated into an enclosed area to form a semi-private
space.
The average collected light data during daytime are much higher compared
to the average collected light data during night time. This is due to the
sunlight which occurs during daytime. The contribution from the natural light
source is significant to light data collection. The collected data at the height
of 1m above ground are significantly higher than the collected data at the
height of 1.5m above ground. Due to the proximity of the lux meter to
artificial light source by considering the light intensity turn lower when it
travels. At 1.5m, the lux meter has shorter distance to the artificial light source,
receiving higher light intensity.
Since artificial lighting can only provide small lighten are due to lower light
intensity over distance travelled, thus, large difference in collected data
occurs between grids near to artificial lighting and far to artificial lighting.
The artificial lightings installed in all of the zones studied are not acceptable
and do not meet MS1525 standard. After all the lumen calculations has been
done in this analysis, the results show that there are still lack of illumination in
each zone. The artificial lighting should be improved to create a more
productive environment for the people working there. Lighting with higher
power or more quantity can be added to solve this issue.
After a thorough analysis, we have concluded that the lighting condition in
Patin Place has a relatively lower for its given activity and usage based on
the governing standard that used. In the good way, the designer still does
consider the safety of the users inside the zone.
72. 5.0 ACOUSTIC PERFORMANCE EVALUATION
5.1 RESEARCH METHODOLOGY
5.1.1 ACOUSTIC MEASURING EQUIPMENT
Sound Level Meter
The device is used to measure the sound level in a particular point in a
space. The measured unit is in decibals(dB).
Figure 5.1.1.1: Sound Level Meter Device
73. Camera
Camera is used to capture the source of noise such as mechanical
devices, speakers and existing activities and also to record the existing
materials in the environment.
Measuring Tape
It is used to determine the positions of the sound level meter from the
ground level and also used to determine the 1.5m x 1.5m grid on the studying
area.
Figure 5.1.1.2: Camera Device
Figure 5.1.1.3: Measuring Tape
74. 5.1.2 DATA COLLECTION METHODOLOGY
a) Preliminary study on the types of spaces to choose a suitable
enclosed area for the study of acoustics.
b) Obtain approval from the management office and conduct
visits to the case study site.
c) Measure and produce the technical drawings such as floor
plans, sections and elevation digitally based on on-side
measurements.
d) After standardizing the drawings, determine the grid line of
2.5m x 2.5m.
e) Delegate tasks among group members and clarify on the
method of taking readings and using the tools and equipment
before data collection begins.
f) Collect data based on the proper procedures.
g) Observe and record the existing external and internal noise
sources.
h) Compile and tabulate the data and reading.
i) Carry out calculation and analysis. Draw a conclusion or
recommendations at the end of the analysis.
75. 5.1.3 DATA COLLECTION PROCEDURES
a) Draw grid lines of 2.5m x 2.5m on the site floor plan to identify the
position of data collecting.
b) Stand at the intersection point of the grid and hold the measuring device
at 1m from the ground.
c) Wait patiently until the readings shown on the device are stable
coherent with the sur rounding noise and record it down.
d) Stand firm and prevent talking while taking readings.
e) Specify the noise source that might affect the readings.
f) Repeat the steps above for the rest of the intersection points.
g) Conduct the study for peak hour (9pm) and non-peak hour (5pm) to
analyse different acoustics condition at different hour.
Figure 5.1.3.1: Measuring Tape
76. 5.2 CASE STUDY
5.2.1 INTRODUCTION
Figure 5.2.1.1: Location of Patin Place
Figure 5.2.1.2: Exterior of Patin Place
77. Patin Place is a restaurant located in Bandar Puchong Utama. The restaurant
is a place where mostly family have their lunch and dinner during and after
working hours. It is usually packed during peak hours at about 1pm to 3pm and
6pm to 8pm.
Part of Patin Place is designed with curtain walling. This allows natural
daylighting to enter the space, besides being illuminated with artificial
lightings. However it also produces glares into the shop during evening hours.
The site has very minimal sun shading besides the surrounding buildings.
This particular site was chosen as our case study due to its well known lighting
design strategies used in the building and variety type of lighting which allow
us to expose to new knowledge.
Figure 5.2.1.3: Afternoon
Figure 5.2.1.4: Night
78. 5.2.2 ZONING
Before taking the readings for the acoustic levels, we have drawn grid lines at
2.5metre respectively. After that, we characterized them in different types of
zones. Zone A is an outdoor dining space, zone B is the indoor dining space,
zone C is the kitchen.
Overall, the total amount of intersection points are
79. 5.3 EXISTING NOISE SOURCES
Situated at the corner slot adjacent to one of the busiest road in Bandar
Puchong Utama, Patin Place has received plenty of noise mainly from the
vehicles on the road, the current on-going dog training facility located
opposite the restaurant and bistros located behind the restaurant at night. The
site itself lack of vegetation as a buffer zone. There are no tall trees surrounding
the premise nor any high fencing exposing the building itself to the surrounding.
With the Dog Training Facility, Bistro and the housing area surrounding Patin
Place, it can be noisy sometimes when occupants are having their meal in
Patin Place. However, the materials that were chosen to decorate the interior
of the restaurant plays an important part to ensure that the noise can be
reduced.
Figure 5.3.1: Night
80. 5.3.2 External Noise
5.3.2.1 Site Context
The dog training facility located opposite Patin Place Restaurant runs
throughout the day, from morning until evening. The noise level increases
especially during the evening when more crowd are occupying that space.
Needless to say, it is a major noise disturbance to Patin Place.
However, the housing area located beside Restaurant Patin Place do not
create much noise compared to the dog training facility. Furthermore, the
bistro and cafes located beside the restaurant only functions at night.
Therefore, at night it can be noisy due to the bistro.
Figure 5.3.2.1.1: dog
training
Figure 5.3.2.1.2:
housing area
Figure 5.3.2.1.3:
bistrol
81. 5.3.3 INTERNAL NOISE
5.3.3.1 HUMAN ACTIVITIES
Besides external noises, the interior noises mainly come from human
activities such as chit-chatting, laughing, greeting and etc. Based on the plan
drawing with each zone respectively, Zone A and B is the noisiest because it is
the dining area (outdoor and indoor).
Social activities in the outdoor area create noises as well. However, there are
sliding doors which can be closed to prevent the noise from the outside
coming in to the interior spaces.
Figure 5.3.3.1.1: During lunch time
Figure 5.3.3.1.2: Outdoor dining area
82. 5.3.3.2 SPEAKER
Speakers are placed around the corners of the restaurant to keep the
environment lively with music.
5.3.3.3 Air Conditioners
Units of air conditioners are also located throughout the interior of the
restaurant. However, the ceiling cassette unit do not create much noise but
uses a lot of electricity.
Figure 5.3.3.2.1: Outdoor speaker
Figure 5.3.3.3.1: Interior A/c
83. 5.3.3.4 Electric Appliances
The dry kitchen is open, therefore the noise of a blender when making
drinks for customers can cause some noise.
Figure 5.3.3.4.1: Electric appliances
84. 5.3.4 Locations of the Noise Sources
Figure 5.3.4.1: Locations of the noise sources
85. Indication Picture Specification Unit(s)
Dimension:
295mm x 640mm x
640mm
Sound Pressure
Level:
38-45dB
4
Dimension:
250mm x 180mm x
230mm
Sound Pressure
Level:
70dB
9
Dimension:
4200m x 800mm
Sound Pressure
Level:
40dB
1
86. 5.3.5 MATERIAL AND PROPERTY
The application of materials in an important factor in determining the
quality of acoustics in an environment, especially controlling the reverberation
time. The materials act as a medium, be it solid, liquid or gas that will affect the
total effect of sound produced in an enclosed space, known as room
acoustics. The sound waves can undergo reflection, absorption, diffusion and
diffraction with different shapes, characteristics, surface texture and etc. of a
material.
Below are the list of existing materials found on all zones of the case study:
No. Zone Materials Colour Absorption
Coefficient
Surface
Texture
500Hz 2000Hz 4000Hz
1. A,B,C,D Human - 0.46 0.51 0.50 -
5.3.5.1 FURNITURE MATERIAL
No. Zone Materials Colour Absorption
Coefficient
Surface
Texture
500Hz 2000Hz 4000Hz
1. A,B Seats with cushioning Dark
colour
0.28 0.28 0.70 Smooth
Wood Frame Cushion
87. No
.
Zone Materials Colour Absorption
Coefficient
Surface
Texture
500Hz 2000Hz 4000H
z
2. B Laminated wooden cashier table Brown 0.07 0.09 0.09 Smooth
3. B Food display counter top Brown
&
Transpa
-rent
0.19 0.08 0.06 Smooth
Laminated wood Glass
5.3.5.2 WALL MATERIALS
No. Zone Materials Colour Absorption
Coefficient
Surface
Texture
500Hz 2000Hz 4000Hz
1. A,B,C Cement Grey 0.02 0.02 0.05 Smooth
94. 5.5.1.3 KITCHEN
Sound Level Measurement and Analysis
Power Addition Method
πΏ = 10 πππ10
πΌ
πΌ0
Where πΌ = sound power (Intensity)(Watts)
Where πΌ0 = reference power (1π₯10β12
Watts)