Download to read offline

![Life Sciences/P2 DBE/Feb. – Mar. 2011
8
NSC
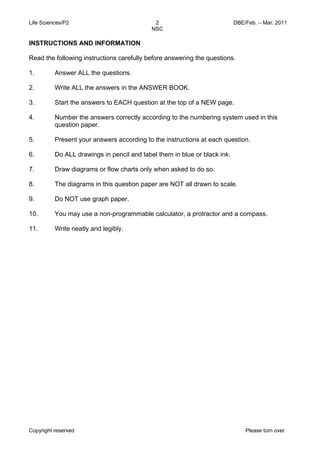
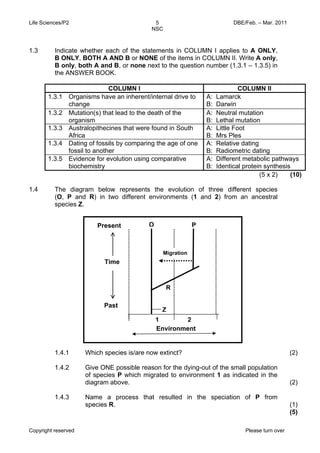
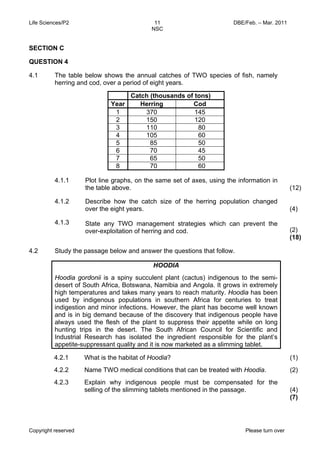
2.2 Deforestation is the destruction of forests by the removal of trees in large
numbers. The table below shows statistics related to deforestation in different
regions from 1990 to 2000.
Region Total land
area (ha)
Total
forest
cover
(ha)
Forest
cover
(%)
Deforestation
rate
1990 – 2000 (%)
Africa 2 978 394 649 866 21,8 0,8
Asia 3 084 746 547 793 X 0,1
North and
2 136 966 549 304 25,7 0,1
Central America
Oceania and
Australia
849 096 197 623 23,3 0,2
2.2.1
2.2.2
2.2.3
2.2.4
2.2.5
Which region had the highest rate of deforestation in the
10-year period?
Calculate the forest cover (%) of Asia indicated as X. Show ALL
working.
Give any TWO reasons for deforestation.
Describe TWO consequences of deforestation for the ecosystem.
Explain THREE management strategies to reduce deforestation.
Copyright reserved Please turn over
(1)
(3)
(2)
(4)
(6)
(16)
[30]](https://image.slidesharecdn.com/lifesciencesp2feb-march2011eng-141113100333-conversion-gate02/85/Life-sciences-p2-feb-march-2011-eng-8-320.jpg)
![Life Sciences/P2 DBE/Feb. – Mar. 2011
10
NSC
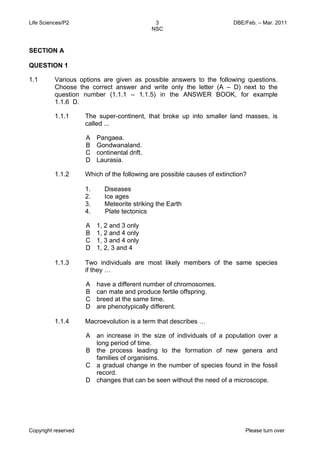
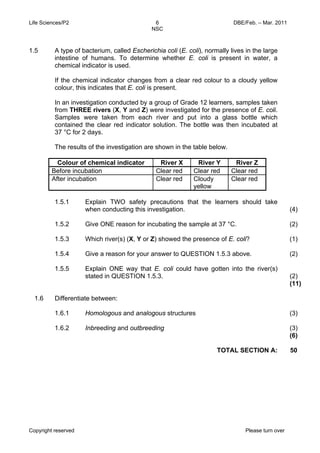
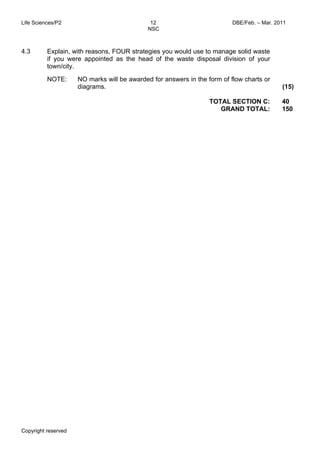
3.2 The diagrams below represent the skulls of two organisms, namely a modern
human and a gorilla. Each arrow indicates the position of the foramen
magnum. Study the diagrams and answer the questions that follow.
3.2.1
3.2.2
3.2.3
3.2.4
3.2.5
Identify each of the organisms that are represented by A and B.
Tabulate FOUR observable differences between the skulls of
organisms A and B.
Which organism is bipedal for most of its adult life?
Explain TWO possible advantages of bipedalism to the organism
referred to in QUESTION 3.2.3.
Name any TWO similarities between organisms A and B.
Copyright reserved Please turn over
(2)
(9)
(1)
(4)
(2)
(18)
TOTAL SECTION B:
[30]
60
Organism A Organism B](https://image.slidesharecdn.com/lifesciencesp2feb-march2011eng-141113100333-conversion-gate02/85/Life-sciences-p2-feb-march-2011-eng-10-320.jpg)

This document provides instructions for a Life Sciences exam consisting of three sections worth a total of 150 marks over 21⁄2 hours. Section A is worth 50 marks and includes multiple choice, matching, and short answer questions testing concepts in evolution, ecology and microbiology. Section B is worth 30 marks for each of two structured questions on topics like pollution indicators, deforestation, and comparative anatomy. Section C consists of an essay worth 40 marks. Students are instructed to answer all questions, show workings, use diagrams where required, and write neatly.


