Download as PDF, PPTX

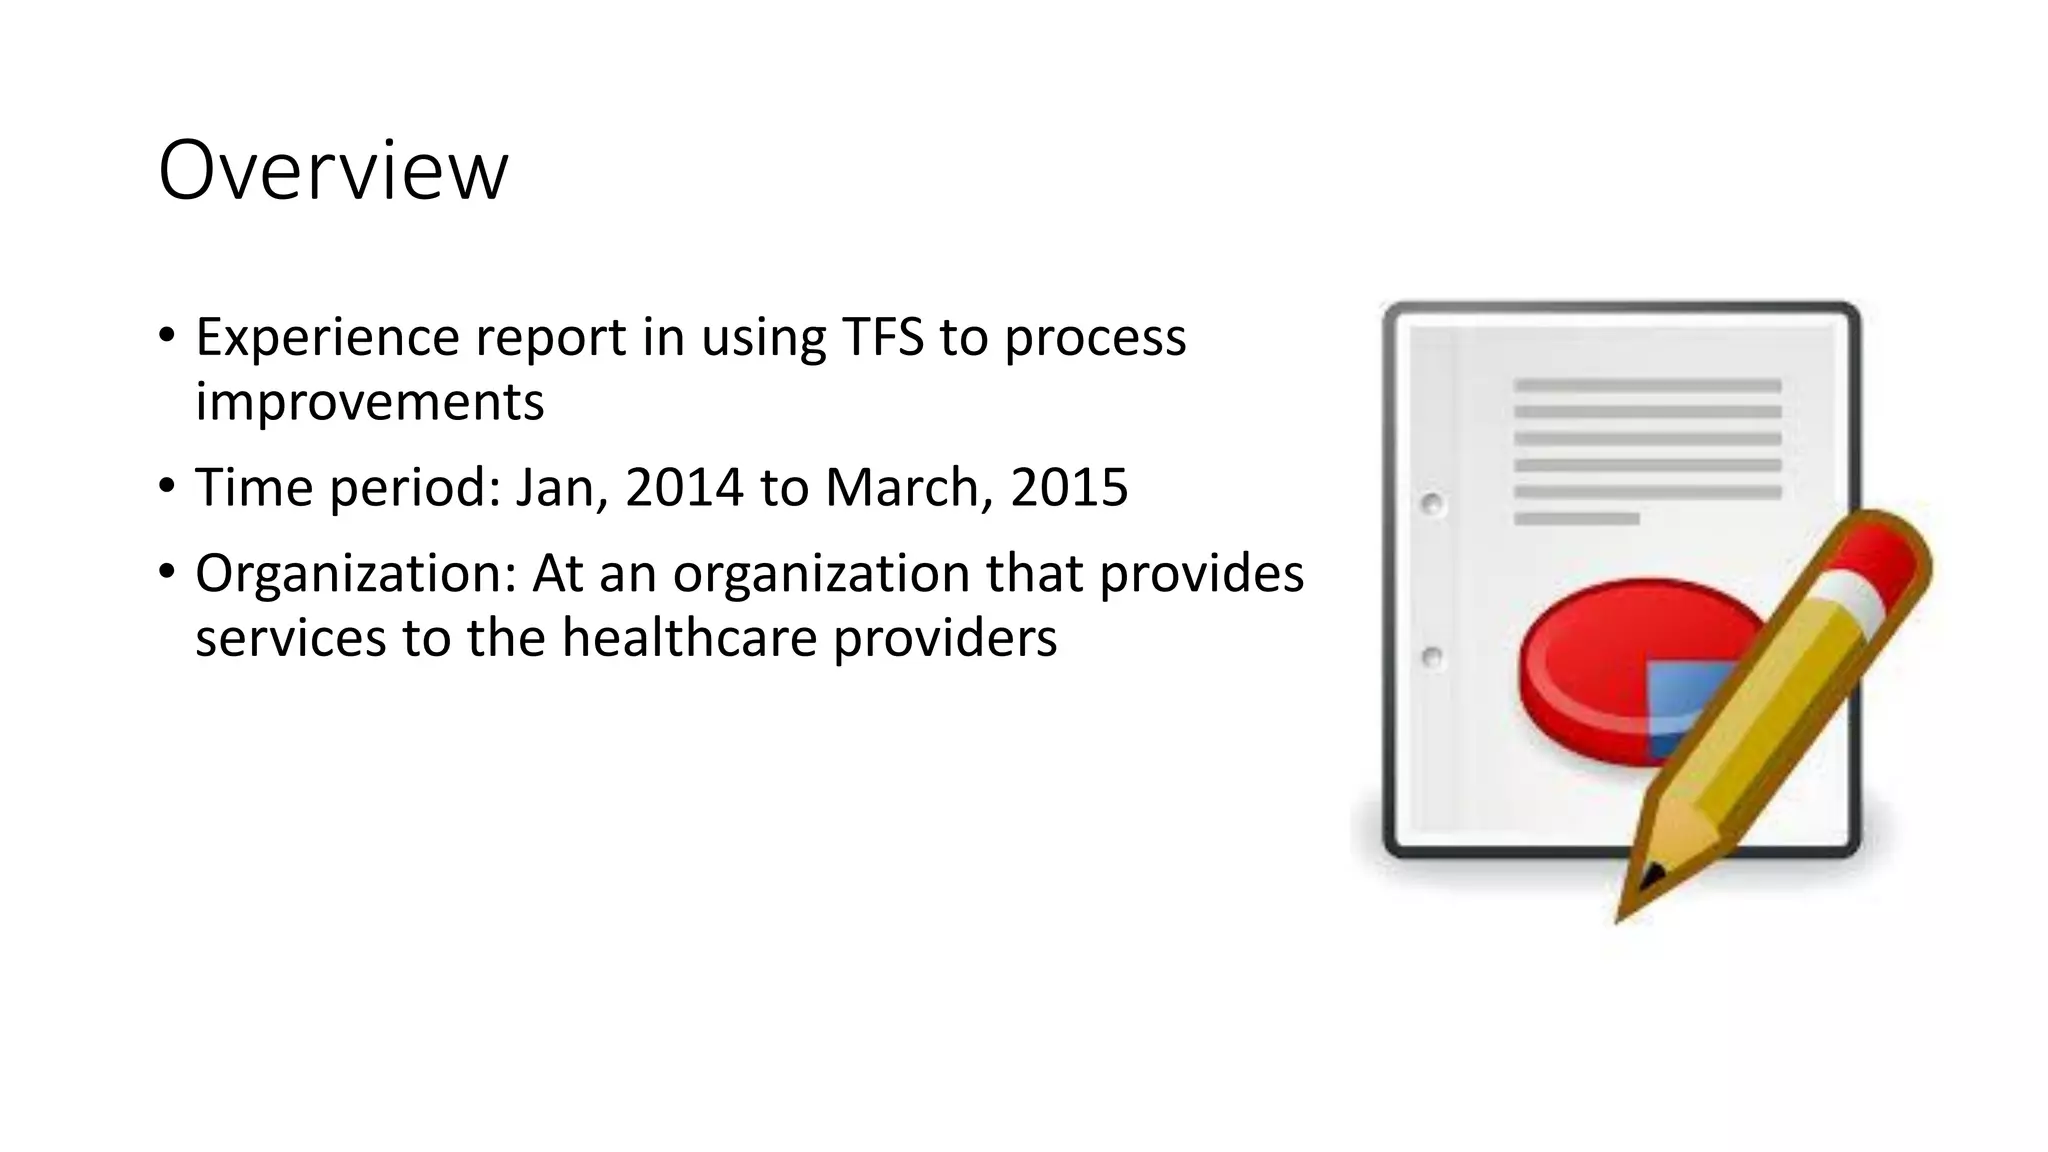
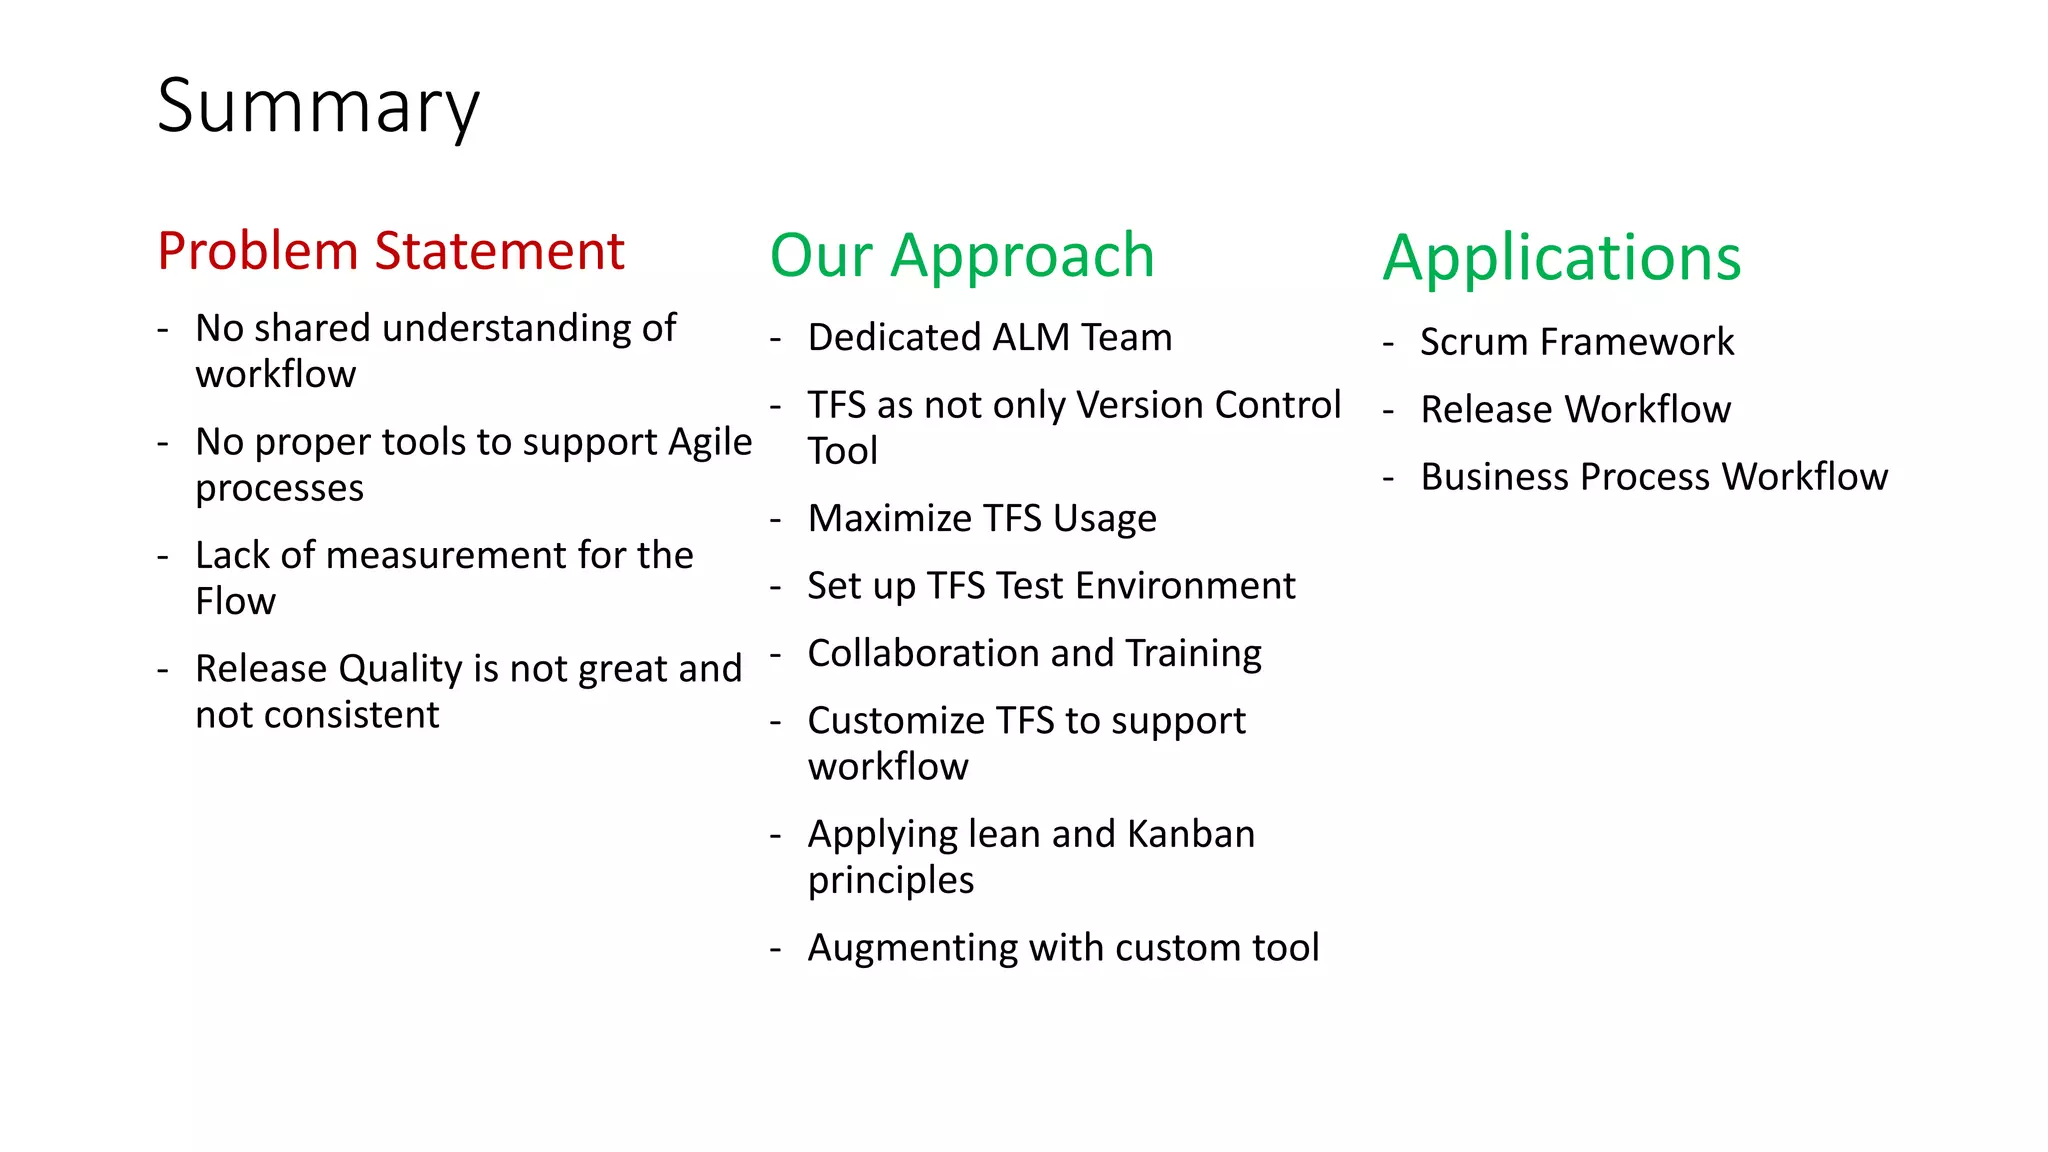
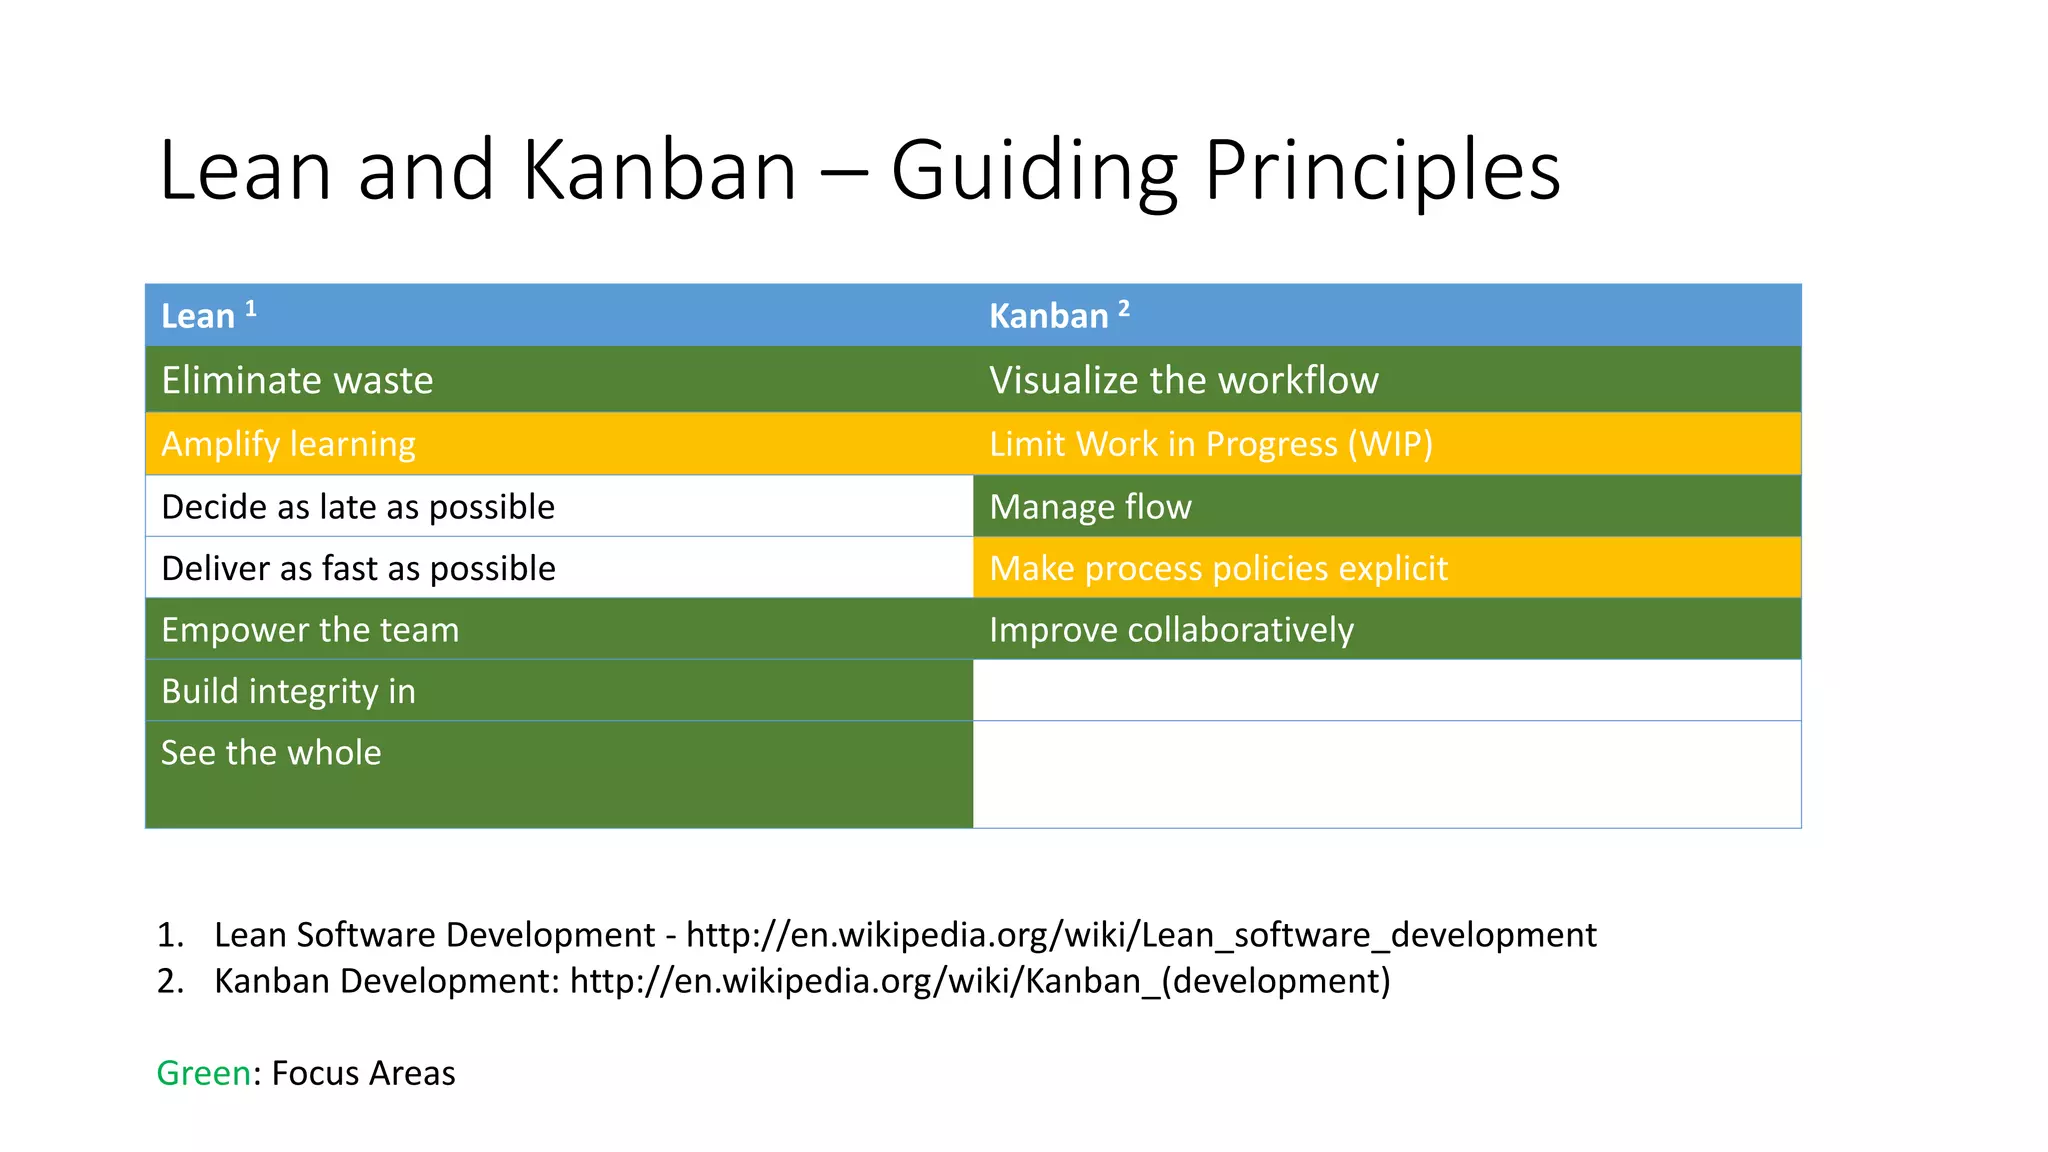
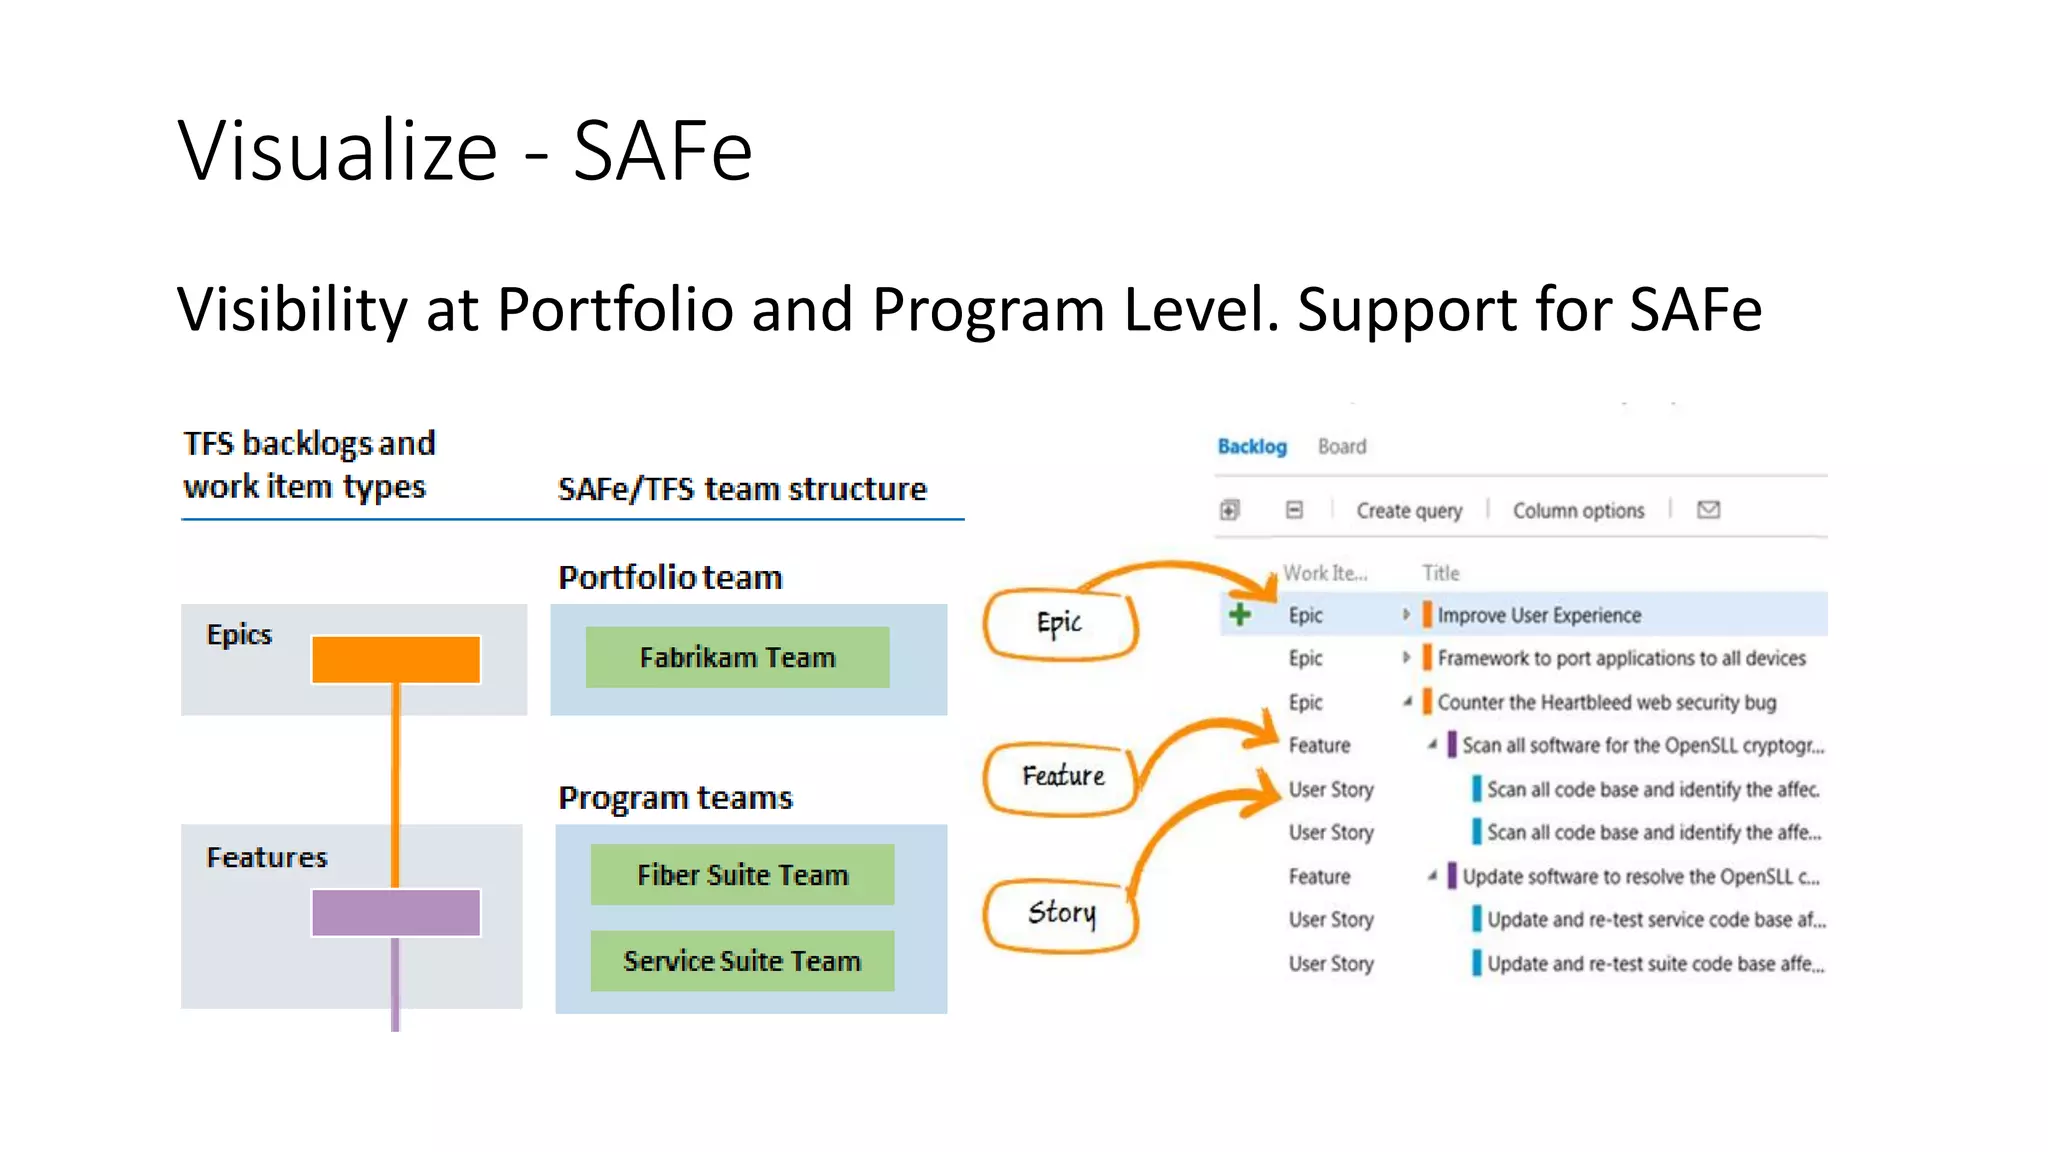
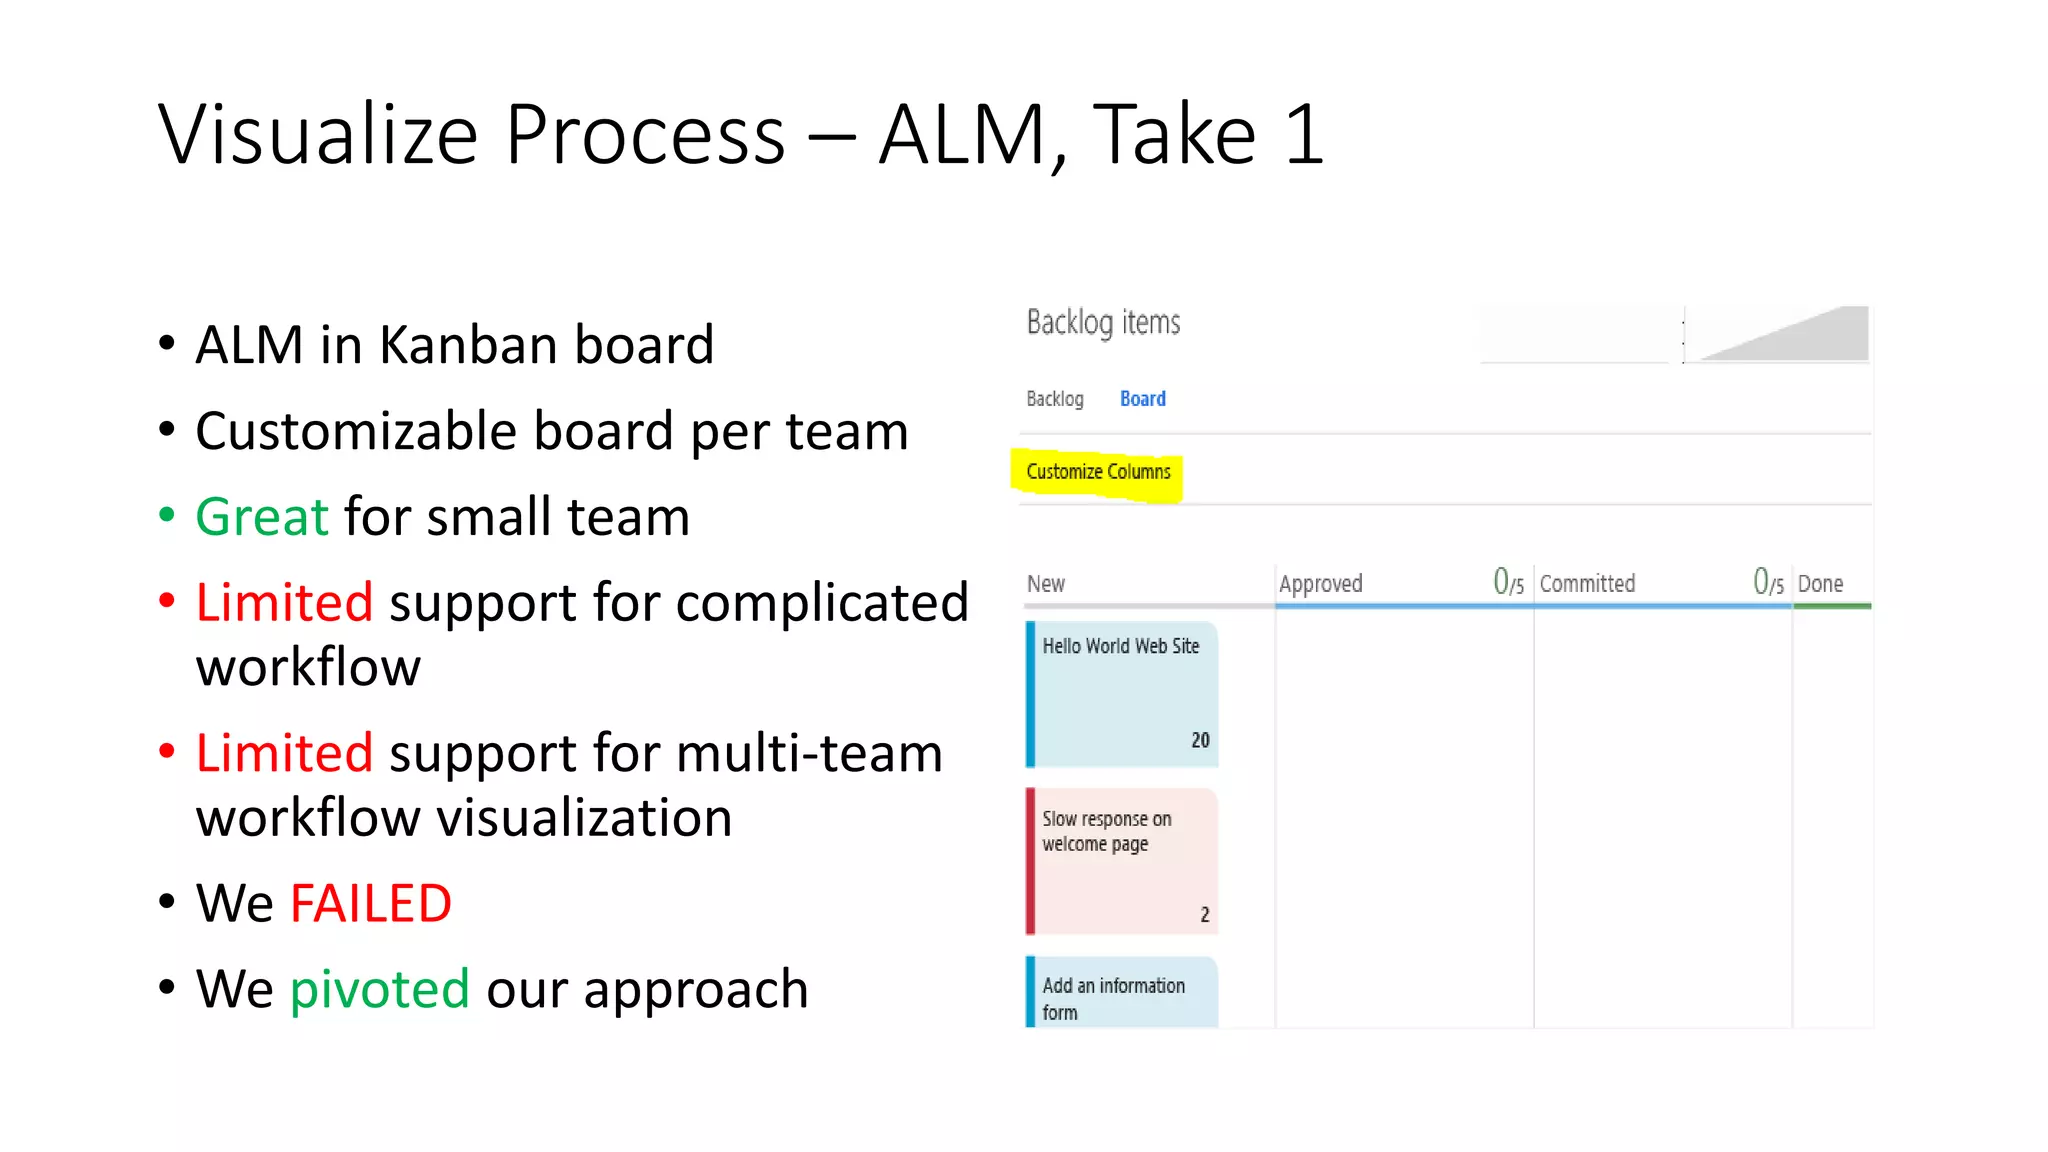
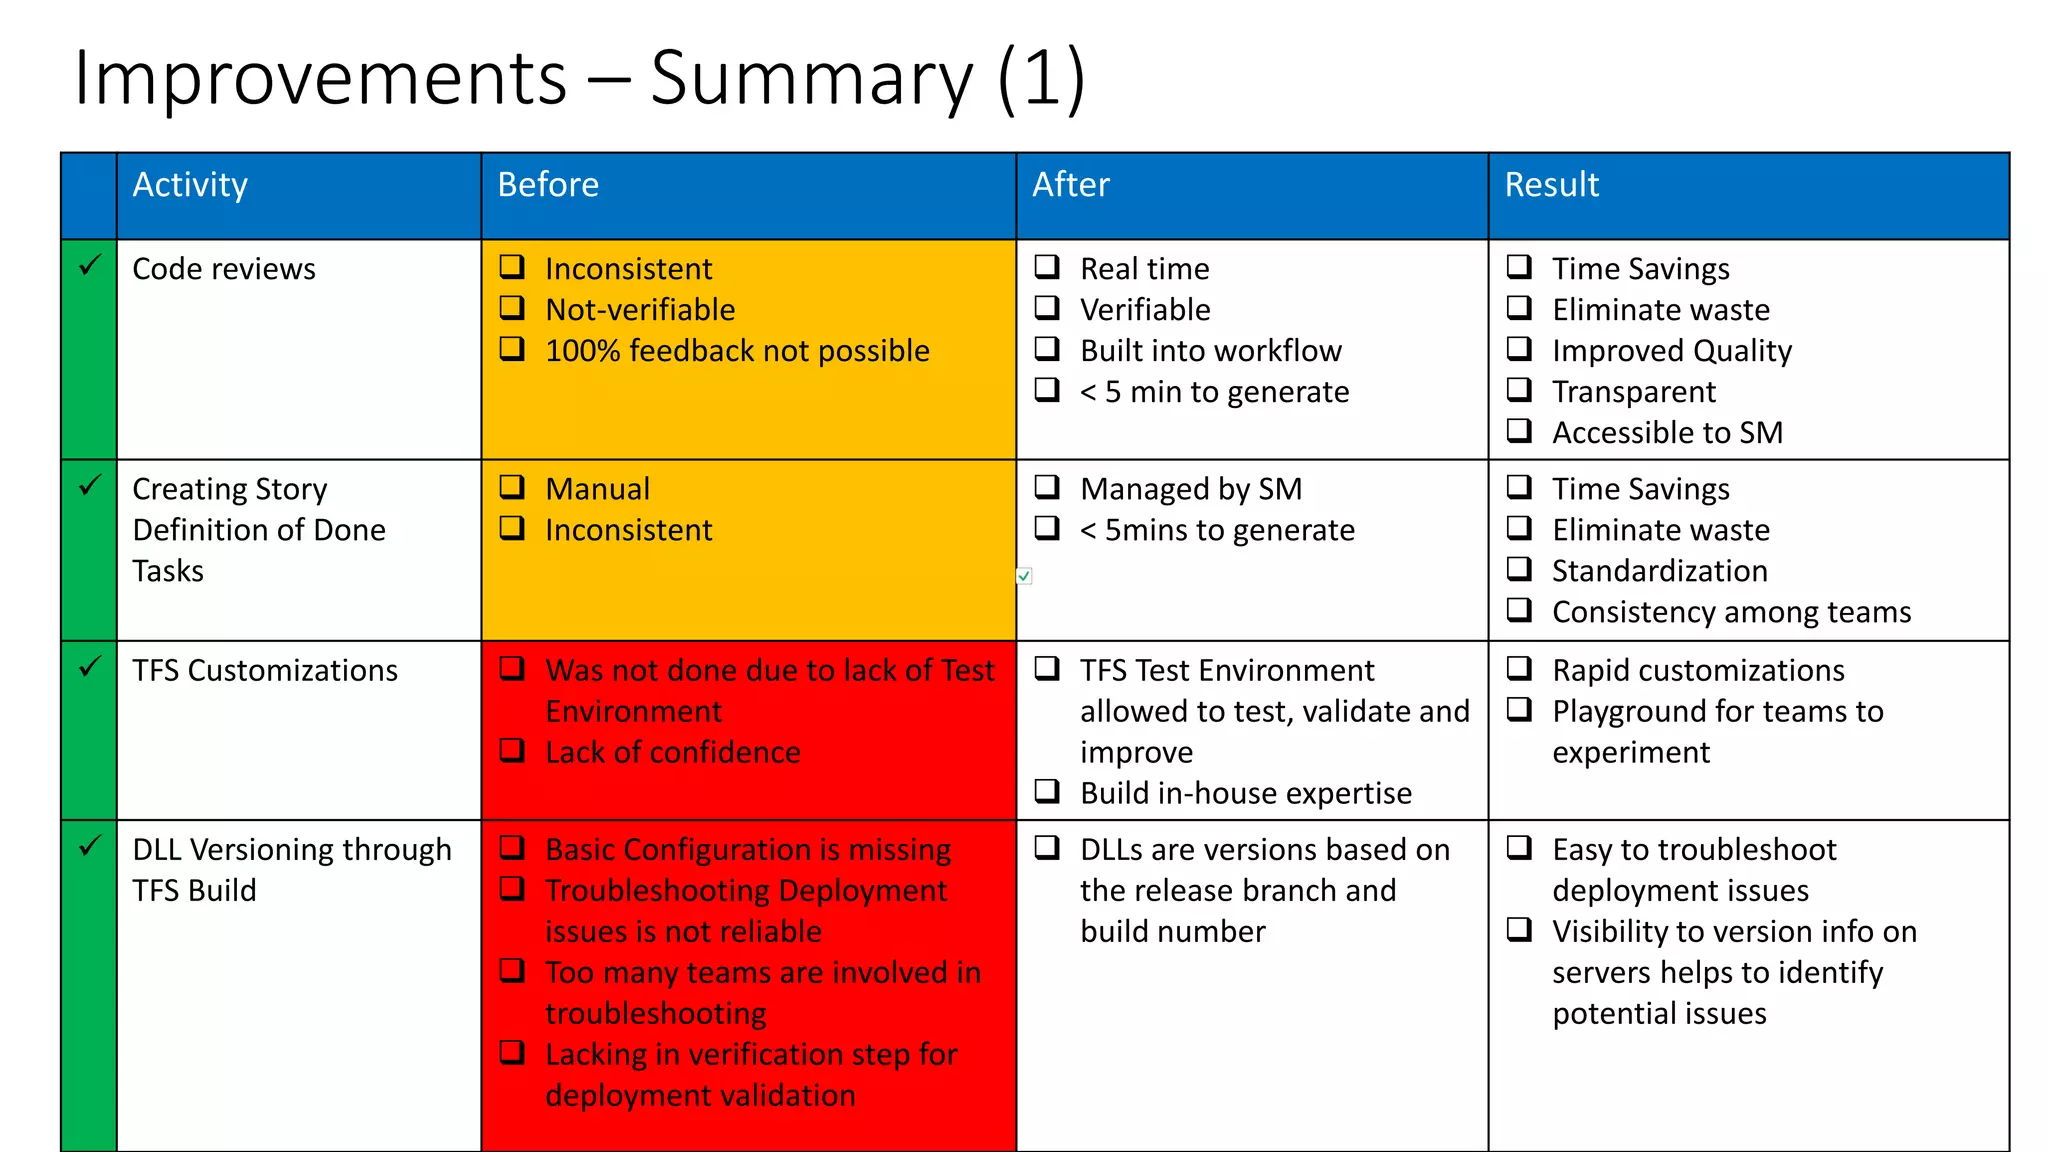
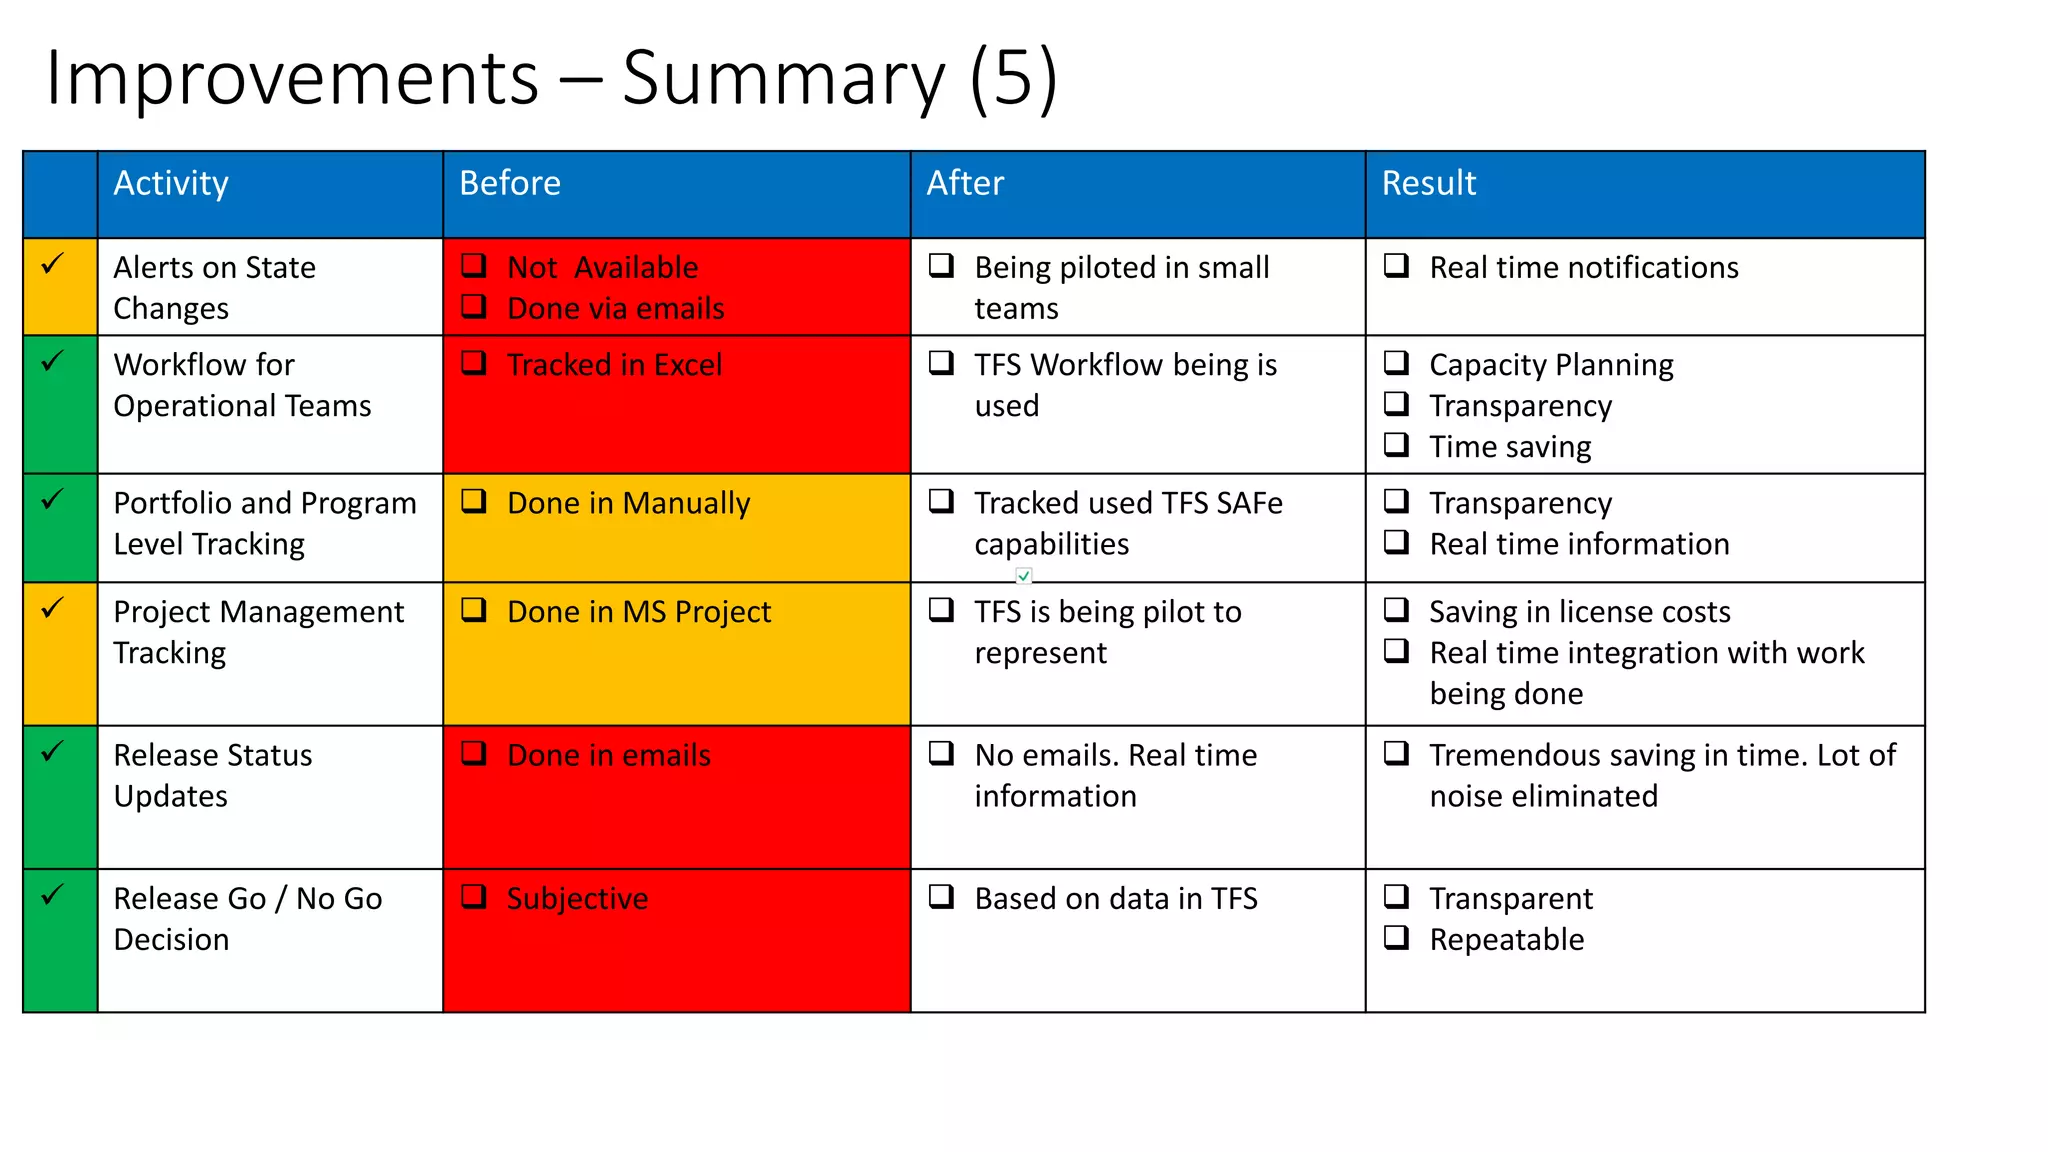


The document summarizes the experience of using Microsoft Team Foundation Server (TFS) to drive process improvements at an organization providing healthcare services. Key points: 1) TFS was used to visualize workflows, manage flow, standardize reporting, and automate tasks to eliminate waste and improve consistency, transparency, and decision making. 2) Custom tools were built to bridge gaps in TFS reporting capabilities and provide real-time metrics on code reviews, task creation, customizations testing, and more. 3) Significant improvements resulted, including time savings, reduced variations, earlier issue detection, and empowered teams through self-service reporting and process transparency.


