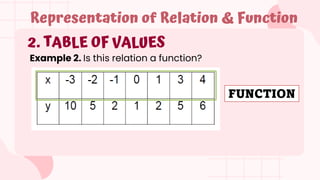
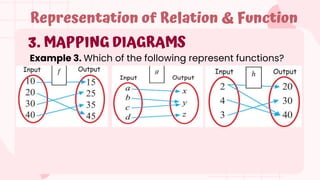
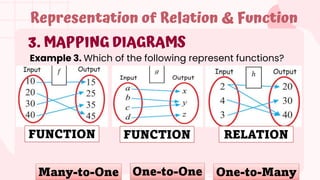
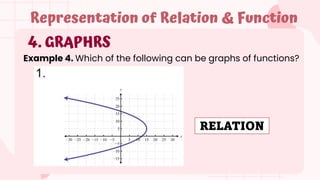
General
Mathematics
Hannae Alyza P. Domingo
Teacher II
Logic
If you have 50 pesos, then
you want to buy a bananaque
worth 10 pesos each, how
many pieces of bananaque
can you buy with the money
you have?
Logic
If Jose can eat 10 burgers in
a day, how many burgers can
he eat in 10 days?
Picture
Analysis
PAGASA (dost.gov.ph)
Picture
Analysis Philippine Population Forecasts
Synthesize& Correlate the Idea
•Do x and yare
useful in our daily lives?
Logic
If you have 50 pesos, then
you want to buy a bananaque
worth 10 pesos each, how
many pieces of bananaque
can you buy with the money
you have?
Logic
If Jose can eat 10 burgers in
a day, how many burgers can
he eat in 10 days?
Picture
Analysis
PAGASA (dost.gov.ph)
Picture
Analysis
Lesson 1
Representations of
Functions and
Relations
MELC: represents real-life
situations using functions
1. ORDERED PAIRS
Representation of Relation & Function
Example 1. Which of the following relations are functions?
FUNCTION
FUNCTION
RELATION
1. ORDERED PAIRS
Representation of Relation & Function
DOMAIN
RANGE
x-values
y-values
1. ORDERED PAIRS
Representation of Relation & Function
FUNCTION
FUNCTION
RELATION
2. TABLE OF VALUES
Representation of Relation & Function
Example 2. Is this relation a function?
FUNCTION
3. MAPPING DIAGRAMS
Representation of Relation & Function
Example 3. Which of the following represent functions?
3. MAPPING DIAGRAMS
Representation of Relation & Function
Example 3. Which of the following represent functions?
FUNCTION FUNCTION RELATION
One-to-One One-to-Many
Many-to-One
4. GRAPHRS
Representation of Relation & Function
Example 4. Which of the following can be graphs of functions?
RELATION
4. GRAPHRS
Representation of Relation & Function
Example 4. Which of the following can be graphs of functions?
FUNCTION
4. GRAPHRS
Representation of Relation & Function
Example 4. Which of the following can be graphs of functions?
FUNCTION
4. GRAPHRS
Representation of Relation & Function
Example 4. Which of the following can be graphs of functions?
FUNCTION
4. GRAPHRS
Representation of Relation & Function
Example 4. Which of the following can be graphs of functions?
RELATION
4. GRAPHRS
Representation of Relation & Function
Example 4. Which of the following can be graphs of functions?
VERTICAL LINE TEST
A graph represents a
function if and only
if each vertical line
intersects the graph
at most once.
4. GRAPHRS
Representation of Relation & Function
Example 4. Which of the following can be graphs of functions?
RELATION
4. GRAPHRS
Representation of Relation & Function
Example 4. Which of the following can be graphs of functions?
FUNCTION
4. GRAPHRS
Representation of Relation & Function
Example 4. Which of the following can be graphs of functions?
FUNCTION
4. GRAPHRS
Representation of Relation & Function
Example 4. Which of the following can be graphs of functions?
FUNCTION
4. GRAPHRS
Representation of Relation & Function
Example 4. Which of the following can be graphs of functions?
RELATION
Any questions,
comments or
suggestions?
• A relation is a rule that relates values from a
set of values (called the domain) to a second
set of values (called the range).
• A relation is a set of ordered pairs (𝑥, 𝑦).
DEFINITION
RELATION
• A function is a set of ordered pairs (𝑥, 𝑦) such
that no two ordered pairs have the same x-
value but different y-values.
DEFINITION
FUNCTION
• The domain of a relation is the set of all
possible values that the variable x can take.
DEFINITION
DOMAIN
• The range is the set of all possible values that
the variable y can take.
DEFINITION
RANGE
RANGE
• A graph represents a function if and only if
each vertical line intersects the graph at
most once.
DEFINITION
VERTICAL LINE TEST
Can you find
RELATION-ships of
our lesson to your
everyday lives?
The number of toothbrush
to the number of family
members is a FUNCTION
Name of your mother to
each siblings of your
family is a RELATION
Name of students to your
math teacher is a
FUNCTION
Bf to Gf is a FUNCTION
Depending on the Loyalty
Kasi pag may IBA(kabit) si
bf RELATION na yun 
1. It is a set of ordered pairs (𝑥, 𝑦)
such that no two ordered pairs
have the same x-value but
different y-values?
LEARNING ACTIVITY: RELATION-ships
A. FUNCTION
B. RELATION
C. DOMAIN
D. RANGE
2. The _____ of a relation is the
set of all possible values that the
variable x can take.
LEARNING ACTIVITY: RELATION-ships
A. FUNCTION
B. RELATION
C. DOMAIN
D. RANGE
3. A graph represents a function if
and only if each vertical line
intersects the graph at most
_____.
LEARNING ACTIVITY: RELATION-ships
A. ONCE
B. THRICE
C. TWICE
D. ALL OF THESE
4. Which of the following set of
ordered pairs in NOT a function?
LEARNING ACTIVITY: RELATION-ships
A. (1,2),(2,3),(3,4),(4,5)
B. (1,2),(1,3),(3,6),(4,8)
C. (1,1),(2,2),(3,3),(4,4)
D. (3,2),(4,2),(5,2),(6,2)
5. Which of the following diagram
represents a relation that is NOT
a function?
LEARNING ACTIVITY: RELATION-ships
A.
B.
C.
D.
6. For which values of k is the
set of order pairs (2,4), (𝑘,6),
(4,0 ) a function?
LEARNING ACTIVITY: RELATION-ships
Solution: All real numbers,
except 2 and 4.
7. Can you write a table of
values which represents
function?
LEARNING ACTIVITY: RELATION-ships
8. Can you write a three set of
ordered pairs, two of these
represent function and the
other one represents
relation?
LEARNING ACTIVITY: RELATION-ships
9. Can you write a three set of
ordered pairs that two of
these represent function
and the other one
represents relation?
LEARNING ACTIVITY: RELATION-ships
10. Can you draw a graph
which represents a
function? Then, explain.
LEARNING ACTIVITY: RELATION-ships
Thank You for your
participation! I hope you
do more next time!

LESSON1_REPRESENTATIONS OF FUNCTIONS AND RELATIONS.pptx

  • 1.
  • 2.
    Logic If you have50 pesos, then you want to buy a bananaque worth 10 pesos each, how many pieces of bananaque can you buy with the money you have?
  • 3.
    Logic If Jose caneat 10 burgers in a day, how many burgers can he eat in 10 days?
  • 4.
  • 5.
  • 6.
    Synthesize& Correlate theIdea •Do x and yare useful in our daily lives?
  • 7.
    Logic If you have50 pesos, then you want to buy a bananaque worth 10 pesos each, how many pieces of bananaque can you buy with the money you have?
  • 8.
    Logic If Jose caneat 10 burgers in a day, how many burgers can he eat in 10 days?
  • 9.
  • 10.
  • 11.
    Lesson 1 Representations of Functionsand Relations MELC: represents real-life situations using functions
  • 12.
    1. ORDERED PAIRS Representationof Relation & Function Example 1. Which of the following relations are functions? FUNCTION FUNCTION RELATION
  • 13.
    1. ORDERED PAIRS Representationof Relation & Function DOMAIN RANGE x-values y-values
  • 14.
    1. ORDERED PAIRS Representationof Relation & Function FUNCTION FUNCTION RELATION
  • 15.
    2. TABLE OFVALUES Representation of Relation & Function Example 2. Is this relation a function? FUNCTION
  • 16.
    3. MAPPING DIAGRAMS Representationof Relation & Function Example 3. Which of the following represent functions?
  • 17.
    3. MAPPING DIAGRAMS Representationof Relation & Function Example 3. Which of the following represent functions? FUNCTION FUNCTION RELATION One-to-One One-to-Many Many-to-One
  • 18.
    4. GRAPHRS Representation ofRelation & Function Example 4. Which of the following can be graphs of functions? RELATION
  • 19.
    4. GRAPHRS Representation ofRelation & Function Example 4. Which of the following can be graphs of functions? FUNCTION
  • 20.
    4. GRAPHRS Representation ofRelation & Function Example 4. Which of the following can be graphs of functions? FUNCTION
  • 21.
    4. GRAPHRS Representation ofRelation & Function Example 4. Which of the following can be graphs of functions? FUNCTION
  • 22.
    4. GRAPHRS Representation ofRelation & Function Example 4. Which of the following can be graphs of functions? RELATION
  • 23.
    4. GRAPHRS Representation ofRelation & Function Example 4. Which of the following can be graphs of functions? VERTICAL LINE TEST A graph represents a function if and only if each vertical line intersects the graph at most once.
  • 24.
    4. GRAPHRS Representation ofRelation & Function Example 4. Which of the following can be graphs of functions? RELATION
  • 25.
    4. GRAPHRS Representation ofRelation & Function Example 4. Which of the following can be graphs of functions? FUNCTION
  • 26.
    4. GRAPHRS Representation ofRelation & Function Example 4. Which of the following can be graphs of functions? FUNCTION
  • 27.
    4. GRAPHRS Representation ofRelation & Function Example 4. Which of the following can be graphs of functions? FUNCTION
  • 28.
    4. GRAPHRS Representation ofRelation & Function Example 4. Which of the following can be graphs of functions? RELATION
  • 29.
  • 30.
    • A relationis a rule that relates values from a set of values (called the domain) to a second set of values (called the range). • A relation is a set of ordered pairs (𝑥, 𝑦). DEFINITION RELATION
  • 31.
    • A functionis a set of ordered pairs (𝑥, 𝑦) such that no two ordered pairs have the same x- value but different y-values. DEFINITION FUNCTION
  • 32.
    • The domainof a relation is the set of all possible values that the variable x can take. DEFINITION DOMAIN
  • 33.
    • The rangeis the set of all possible values that the variable y can take. DEFINITION RANGE RANGE
  • 34.
    • A graphrepresents a function if and only if each vertical line intersects the graph at most once. DEFINITION VERTICAL LINE TEST
  • 35.
    Can you find RELATION-shipsof our lesson to your everyday lives?
  • 36.
    The number oftoothbrush to the number of family members is a FUNCTION
  • 37.
    Name of yourmother to each siblings of your family is a RELATION
  • 38.
    Name of studentsto your math teacher is a FUNCTION
  • 39.
    Bf to Gfis a FUNCTION
  • 40.
    Depending on theLoyalty Kasi pag may IBA(kabit) si bf RELATION na yun 
  • 41.
    1. It isa set of ordered pairs (𝑥, 𝑦) such that no two ordered pairs have the same x-value but different y-values? LEARNING ACTIVITY: RELATION-ships A. FUNCTION B. RELATION C. DOMAIN D. RANGE
  • 42.
    2. The _____of a relation is the set of all possible values that the variable x can take. LEARNING ACTIVITY: RELATION-ships A. FUNCTION B. RELATION C. DOMAIN D. RANGE
  • 43.
    3. A graphrepresents a function if and only if each vertical line intersects the graph at most _____. LEARNING ACTIVITY: RELATION-ships A. ONCE B. THRICE C. TWICE D. ALL OF THESE
  • 44.
    4. Which ofthe following set of ordered pairs in NOT a function? LEARNING ACTIVITY: RELATION-ships A. (1,2),(2,3),(3,4),(4,5) B. (1,2),(1,3),(3,6),(4,8) C. (1,1),(2,2),(3,3),(4,4) D. (3,2),(4,2),(5,2),(6,2)
  • 45.
    5. Which ofthe following diagram represents a relation that is NOT a function? LEARNING ACTIVITY: RELATION-ships A. B. C. D.
  • 46.
    6. For whichvalues of k is the set of order pairs (2,4), (𝑘,6), (4,0 ) a function? LEARNING ACTIVITY: RELATION-ships Solution: All real numbers, except 2 and 4.
  • 47.
    7. Can youwrite a table of values which represents function? LEARNING ACTIVITY: RELATION-ships
  • 48.
    8. Can youwrite a three set of ordered pairs, two of these represent function and the other one represents relation? LEARNING ACTIVITY: RELATION-ships
  • 49.
    9. Can youwrite a three set of ordered pairs that two of these represent function and the other one represents relation? LEARNING ACTIVITY: RELATION-ships
  • 50.
    10. Can youdraw a graph which represents a function? Then, explain. LEARNING ACTIVITY: RELATION-ships
  • 51.
    Thank You foryour participation! I hope you do more next time!

Editor's Notes

  • #4 Do you think your math lesson can be correlate to this logic?
  • #5 Are you familiar with this? Do you think math has something to do with this picture?
  • #6 Are you familiar with this? Do you think math has something to do with this picture? The total population in Philippines was estimated at 111.6 million people in 2022, according to the latest census figures and projections from Trading Economics.  If you will forecast the next estimation of population for the year 2024, how would it be?
  • #7 Are you familiar with this? Do you think math has something to do with this picture? The total population in Philippines was estimated at 111.6 million people in 2022, according to the latest census figures and projections from Trading Economics.  If you will forecast the next estimation of population for the year 2024, how would it be?
  • #9 Do you think your math lesson can be correlate to this logic?
  • #10 Are you familiar with this? Do you think math has something to do with this picture?
  • #11 Are you familiar with this? Do you think math has something to do with this picture? The total population in Philippines was estimated at 111.6 million people in 2022, according to the latest census figures and projections from Trading Economics.  If you will forecast the next estimation of population for the year 2024, how would it be?
  • #12 Here you’ll learn how to interpret situations that occur in everyday life and use functions to represent them.
  • #30 Here you’ll learn how to interpret situations that occur in everyday life and use functions to represent them.
  • #31 In many situations, data is collected by conducting a survey or an experiment. To visualize the data, it is arranged into a table. Most often, a function rule is needed to predict additional values of the independent variable.
  • #32 In many situations, data is collected by conducting a survey or an experiment. To visualize the data, it is arranged into a table. Most often, a function rule is needed to predict additional values of the independent variable.
  • #33 In many situations, data is collected by conducting a survey or an experiment. To visualize the data, it is arranged into a table. Most often, a function rule is needed to predict additional values of the independent variable.
  • #34 In many situations, data is collected by conducting a survey or an experiment. To visualize the data, it is arranged into a table. Most often, a function rule is needed to predict additional values of the independent variable.
  • #35 In many situations, data is collected by conducting a survey or an experiment. To visualize the data, it is arranged into a table. Most often, a function rule is needed to predict additional values of the independent variable.
  • #36 Here you’ll learn how to interpret situations that occur in everyday life and use functions to represent them.
  • #37 Here you’ll learn how to interpret situations that occur in everyday life and use functions to represent them.
  • #38 Here you’ll learn how to interpret situations that occur in everyday life and use functions to represent them.
  • #39 Here you’ll learn how to interpret situations that occur in everyday life and use functions to represent them.
  • #40 Here you’ll learn how to interpret situations that occur in everyday life and use functions to represent them.
  • #41 Here you’ll learn how to interpret situations that occur in everyday life and use functions to represent them.
  • #52 Here you’ll learn how to interpret situations that occur in everyday life and use functions to represent them.