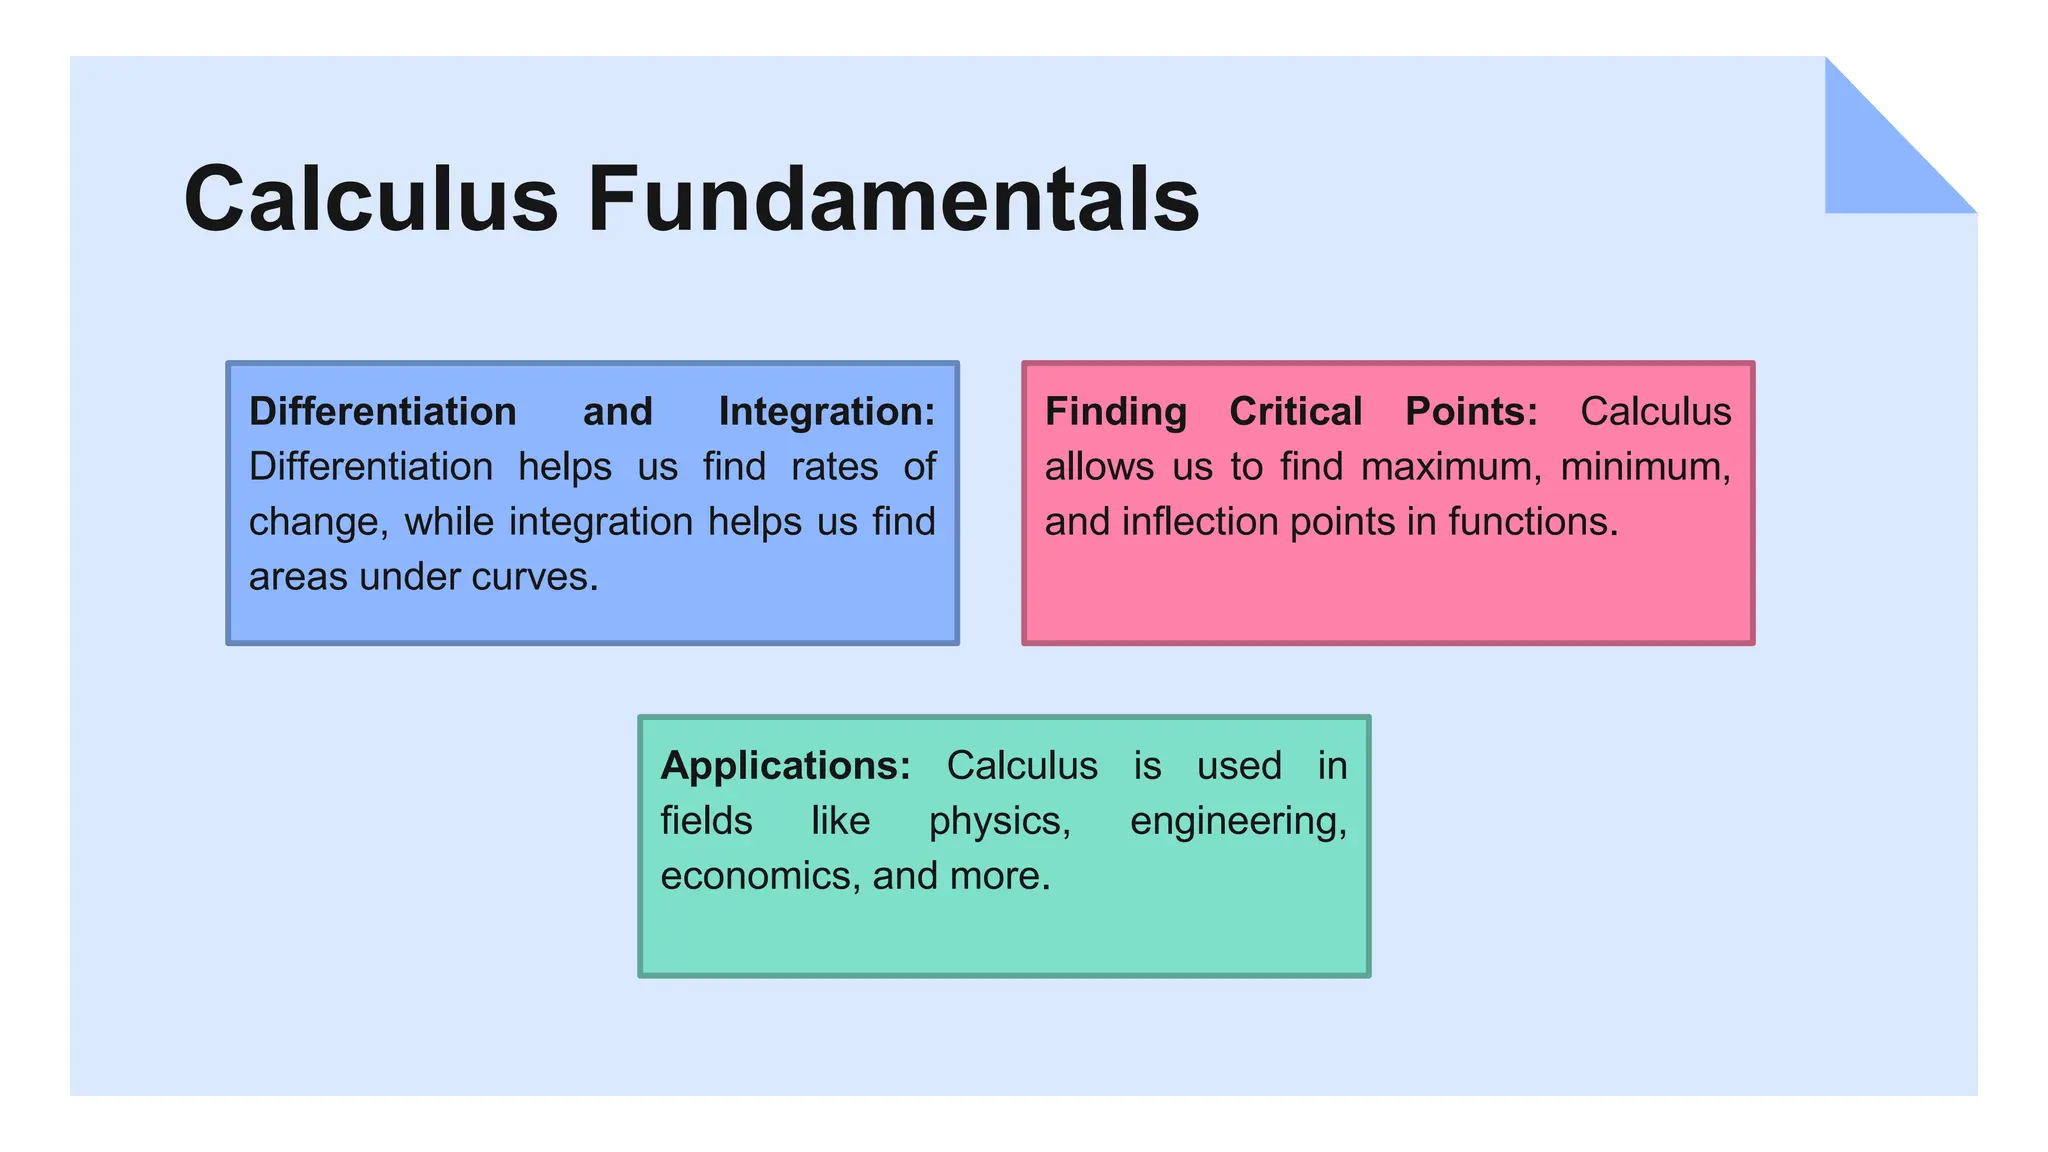
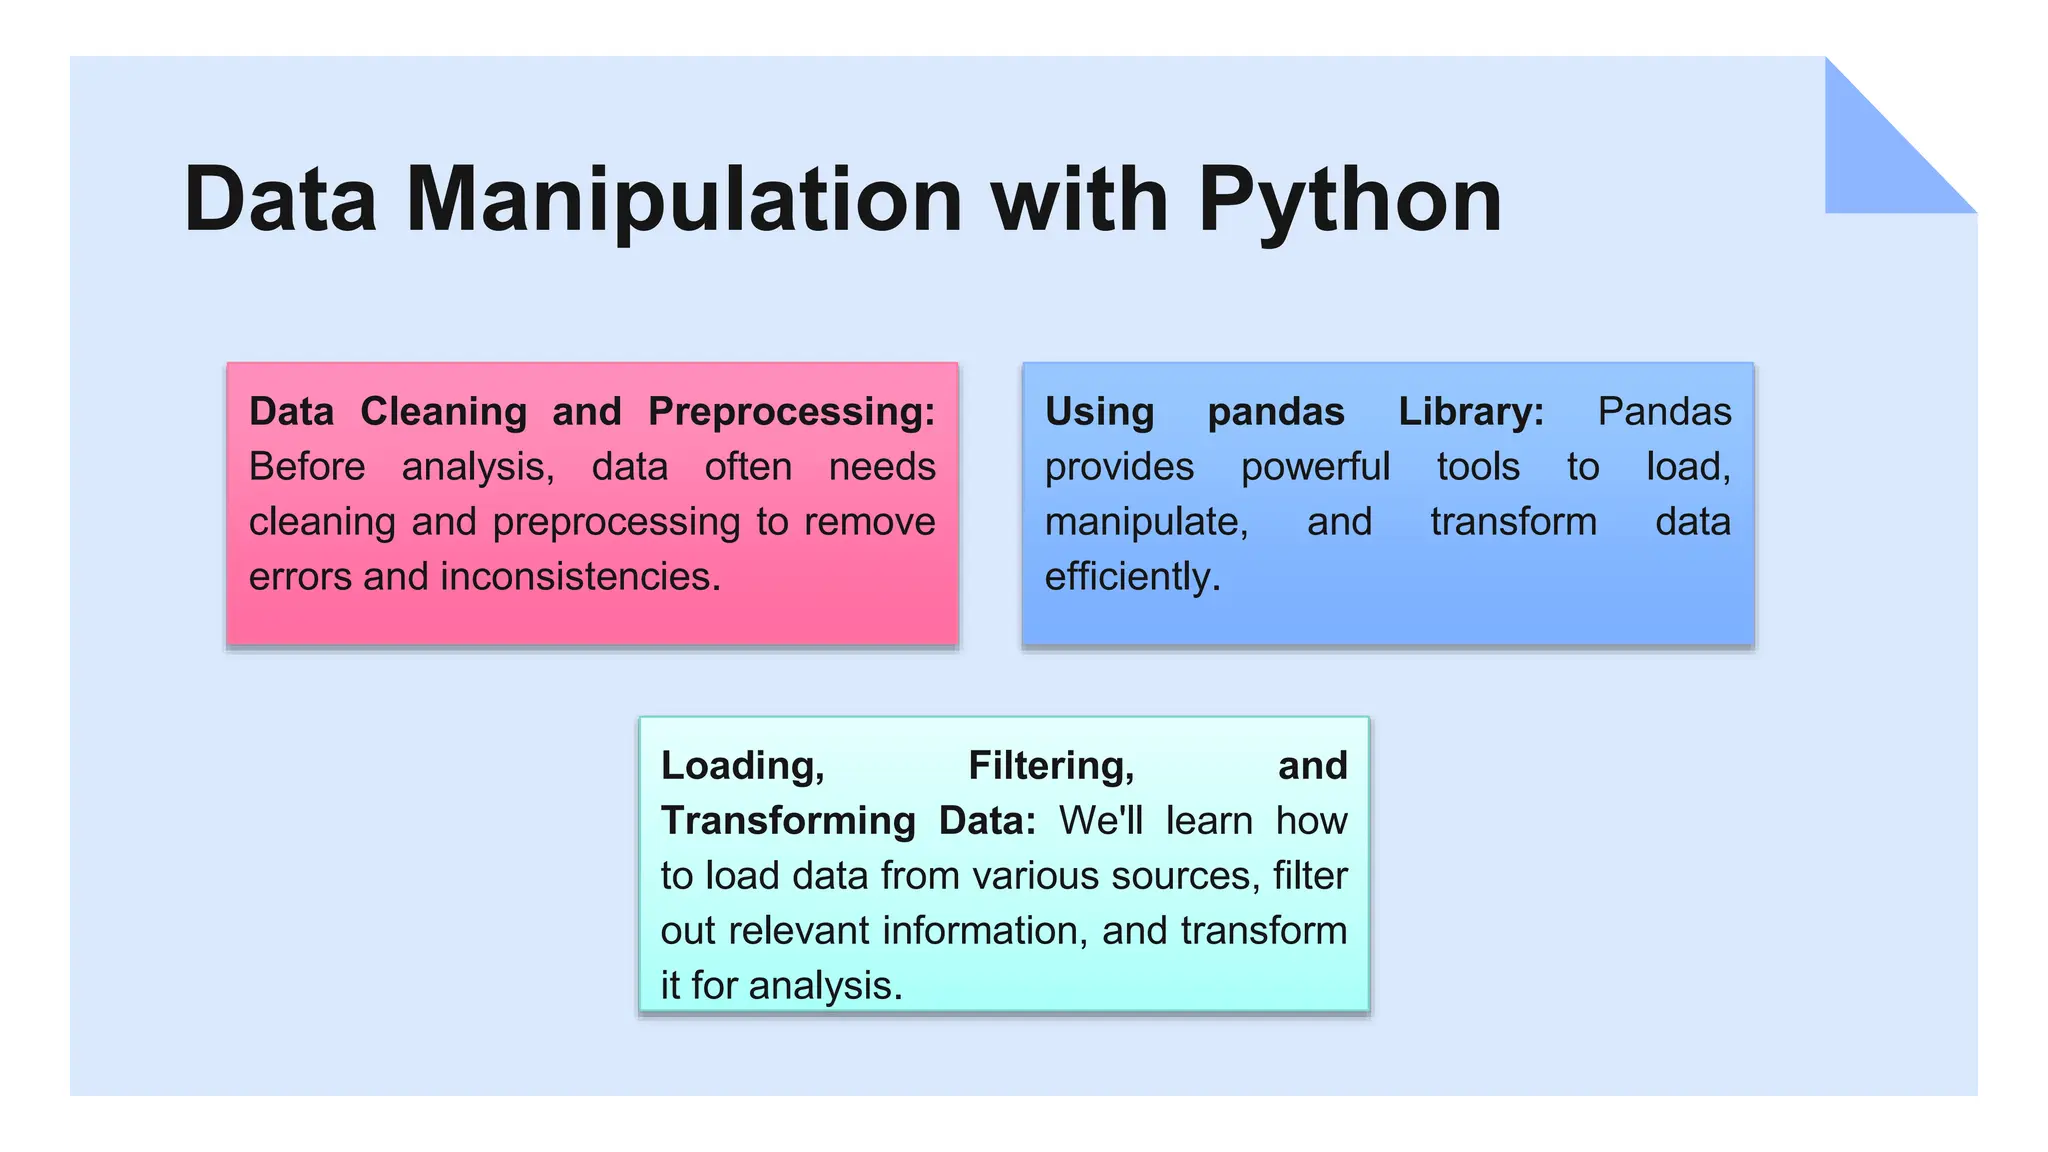
ITEP203
Introduction to
Quantitative Methods
Mark P. Bernardino,MSCS
Introduction
• In this course, we will explore the world of quantitative
methods and their applications in various fields.
• Let's dive into the fascinating world of numbers, data, and
analysis.
Overview of
Quantitative
Methods
01
Introduction to Quantitative Methods
Applications: These methods find
applications in fields such as business,
economics, social sciences, and
computer science.
Quantitative Methods: These are
mathematical and statistical
techniques used to analyze data and
make informed decisions.
Importance: By using quantitative
methods, we can predict outcomes,
understand trends, and solve complex
problems.
Basic
Mathematical
Concepts
02
Basic Mathematical Concepts
Calculus: Calculus helps us
understand rates of change and
optimize functions for better decision-
making.
Algebra: Algebra allows us to
represent relationships between
variables using equations and
expressions.
Statistics: Statistics involves
summarizing and interpreting data,
giving us insights into patterns and
trends.
Algebra Basics
03
Basic Algebra
• Algebraic Expressions and Equations: Algebraic expressions involve
variables and constants, while equations express relationships between
them.
• Solving Equations: Solving equations helps us find solutions to real-world
problems and make predictions.
• Real-world Examples: For instance, algebra can be used to calculate
budgets, growth rates, and more.
Calculus
Fundamentals
04
Calculus Fundamentals
Finding Critical Points: Calculus
allows us to find maximum, minimum,
and inflection points in functions.
Differentiation and Integration:
Differentiation helps us find rates of
change, while integration helps us find
areas under curves.
Applications: Calculus is used in
fields like physics, engineering,
economics, and more.
Statistics
Essentials
05
Statistics Essentials
Descriptive and Inferential
Statistics: Descriptive statistics
summarize data, while inferential
statistics draw conclusions from
samples.
Key Statistical Terms: Mean,
median, mode, and standard deviation
help us understand data distributions.
Importance: Statistics enable us to
make sense of large datasets and
draw meaningful insights.
Introduction
to Python
Programming
06
Introduction to Python
 Python for Data Analysis: Python is a powerful programming language used
for data manipulation, analysis, and visualization.
 Libraries: We'll use libraries like NumPy for numerical operations, pandas for
data manipulation, and Matplotlib for data visualization.
 Python's Role: Python plays a crucial role in modern quantitative analysis,
making tasks more efficient and manageable.
Python Basics
07
Phyton Basics
Variable Assignment and Basic
Operations: Variables store data, and
Python allows us to perform arithmetic
and logical operations.
Python Syntax and Data Types:
Python uses simple and readable
syntax, making it a great choice for
beginners.
Data Structures: Lists, tuples, and
dictionaries help us organize and
manipulate data effectively.
Data
Manipulation
with Python
08
Data Manipulation with Python
Using pandas Library: Pandas
provides powerful tools to load,
manipulate, and transform data
efficiently.
Data Cleaning and Preprocessing:
Before analysis, data often needs
cleaning and preprocessing to remove
errors and inconsistencies.
Loading, Filtering, and
Transforming Data: We'll learn how
to load data from various sources, filter
out relevant information, and transform
it for analysis.
Data
Visualization
with Matplotlib
09
Data Visualization with Matplotlib
Creating Plots with Matplotlib:
Matplotlib is a versatile library for
creating different types of plots, from
simple line charts to complex
heatmaps.
Importance of Data Visualization:
Visualizations help us understand
complex data by presenting it in a
more accessible form.
Examples: We'll explore how to create
line plots, bar charts, scatter plots, and
more.
Statistical
Analysis with
Python
10
Statistical Analysis with Python
Introducing SciPy Library: SciPy is an extension of NumPy and provides
additional functionality for scientific computing and statistics.
Python for Statistical Tests and Analyses: Python's libraries, such as SciPy,
provide functions for hypothesis testing, t-tests, ANOVA, and more.
Hypothesis Testing: We'll delve into the basics of hypothesis testing and its
practical applications.
Conclusion and
Next Steps
11
Conclusion and Next Steps
Encouragement to Practice: Practice is key to mastering these skills. Experiment
with Python, explore datasets, and create your own analyses.
Summary of Key Points: We covered the basics of quantitative methods, algebra,
calculus, statistics, Python programming, data manipulation, and data visualization.
Additional Learning Resources: Use online tutorials, books, and platforms to
continue learning and growing your quantitative analysis skills.
Thanks!
Do you have any
questions?
o "Python for Data Analysis" by Wes McKinney.
o "Introduction to Probability and Statistics" by William Mendenhall.
o Online tutorials and documentation for Python libraries used in the course. Quantitative Method
for Business Decisions, 7th Edition by Jon Curwin, Roger Slater, David Eadson 2013 by Cengage
Learning
o https://www.coursera.org/learn/wharton-quantitative-modeling
o https://www.myacpa.org/sites/default/files/CAE-Basic_Quantitative_Analysis_Using_Excel.pdf
o https://www.tutorialspoint.com/excel_data_analysis/data_analysis_process.htm
Resources

Lesson1-Intro-to-Quantitative-Method.pptx

  • 1.
  • 2.
    Introduction • In thiscourse, we will explore the world of quantitative methods and their applications in various fields. • Let's dive into the fascinating world of numbers, data, and analysis.
  • 3.
  • 4.
    Introduction to QuantitativeMethods Applications: These methods find applications in fields such as business, economics, social sciences, and computer science. Quantitative Methods: These are mathematical and statistical techniques used to analyze data and make informed decisions. Importance: By using quantitative methods, we can predict outcomes, understand trends, and solve complex problems.
  • 5.
  • 6.
    Basic Mathematical Concepts Calculus:Calculus helps us understand rates of change and optimize functions for better decision- making. Algebra: Algebra allows us to represent relationships between variables using equations and expressions. Statistics: Statistics involves summarizing and interpreting data, giving us insights into patterns and trends.
  • 7.
  • 8.
    Basic Algebra • AlgebraicExpressions and Equations: Algebraic expressions involve variables and constants, while equations express relationships between them. • Solving Equations: Solving equations helps us find solutions to real-world problems and make predictions. • Real-world Examples: For instance, algebra can be used to calculate budgets, growth rates, and more.
  • 9.
  • 10.
    Calculus Fundamentals Finding CriticalPoints: Calculus allows us to find maximum, minimum, and inflection points in functions. Differentiation and Integration: Differentiation helps us find rates of change, while integration helps us find areas under curves. Applications: Calculus is used in fields like physics, engineering, economics, and more.
  • 11.
  • 12.
    Statistics Essentials Descriptive andInferential Statistics: Descriptive statistics summarize data, while inferential statistics draw conclusions from samples. Key Statistical Terms: Mean, median, mode, and standard deviation help us understand data distributions. Importance: Statistics enable us to make sense of large datasets and draw meaningful insights.
  • 13.
  • 14.
    Introduction to Python Python for Data Analysis: Python is a powerful programming language used for data manipulation, analysis, and visualization.  Libraries: We'll use libraries like NumPy for numerical operations, pandas for data manipulation, and Matplotlib for data visualization.  Python's Role: Python plays a crucial role in modern quantitative analysis, making tasks more efficient and manageable.
  • 15.
  • 16.
    Phyton Basics Variable Assignmentand Basic Operations: Variables store data, and Python allows us to perform arithmetic and logical operations. Python Syntax and Data Types: Python uses simple and readable syntax, making it a great choice for beginners. Data Structures: Lists, tuples, and dictionaries help us organize and manipulate data effectively.
  • 17.
  • 18.
    Data Manipulation withPython Using pandas Library: Pandas provides powerful tools to load, manipulate, and transform data efficiently. Data Cleaning and Preprocessing: Before analysis, data often needs cleaning and preprocessing to remove errors and inconsistencies. Loading, Filtering, and Transforming Data: We'll learn how to load data from various sources, filter out relevant information, and transform it for analysis.
  • 19.
  • 20.
    Data Visualization withMatplotlib Creating Plots with Matplotlib: Matplotlib is a versatile library for creating different types of plots, from simple line charts to complex heatmaps. Importance of Data Visualization: Visualizations help us understand complex data by presenting it in a more accessible form. Examples: We'll explore how to create line plots, bar charts, scatter plots, and more.
  • 21.
  • 22.
    Statistical Analysis withPython Introducing SciPy Library: SciPy is an extension of NumPy and provides additional functionality for scientific computing and statistics. Python for Statistical Tests and Analyses: Python's libraries, such as SciPy, provide functions for hypothesis testing, t-tests, ANOVA, and more. Hypothesis Testing: We'll delve into the basics of hypothesis testing and its practical applications.
  • 23.
  • 24.
    Conclusion and NextSteps Encouragement to Practice: Practice is key to mastering these skills. Experiment with Python, explore datasets, and create your own analyses. Summary of Key Points: We covered the basics of quantitative methods, algebra, calculus, statistics, Python programming, data manipulation, and data visualization. Additional Learning Resources: Use online tutorials, books, and platforms to continue learning and growing your quantitative analysis skills.
  • 25.
    Thanks! Do you haveany questions?
  • 26.
    o "Python forData Analysis" by Wes McKinney. o "Introduction to Probability and Statistics" by William Mendenhall. o Online tutorials and documentation for Python libraries used in the course. Quantitative Method for Business Decisions, 7th Edition by Jon Curwin, Roger Slater, David Eadson 2013 by Cengage Learning o https://www.coursera.org/learn/wharton-quantitative-modeling o https://www.myacpa.org/sites/default/files/CAE-Basic_Quantitative_Analysis_Using_Excel.pdf o https://www.tutorialspoint.com/excel_data_analysis/data_analysis_process.htm Resources

Editor's Notes

  • #2 Slide 1: Introduction Welcome students to the online class "Introduction to Quantitative Methods." Interactive: Begin with an icebreaker question: "What comes to mind when you think of quantitative methods?" Use the chat feature for students to share their thoughts. Slide 2: Overview of Quantitative Methods Quantitative methods involve using mathematical and statistical techniques to analyze data and make informed decisions. Interactive: Poll students on their familiarity with quantitative methods. Use a poll tool to gather responses and discuss the results briefly. Slide 3: Basic Mathematical Concepts Algebra, calculus, and statistics are foundational for quantitative analysis. Interactive: Share a quick algebraic expression and ask students to solve it in the chat. Discuss their responses and solutions. Slide 4: Algebra Basics Explain algebraic expressions, equations, and solving methods. Interactive: Provide a sample equation and guide students through the steps to solve it. Ask them to solve similar equations in the chat. Slide 5: Calculus Fundamentals Describe differentiation and integration, and their applications. Interactive: Display a graph and ask students to identify critical points. Use annotations or a virtual whiteboard to illustrate the concept visually. Slide 6: Statistics Essentials Define statistical terms like mean, median, mode, and standard deviation. Interactive: Show a dataset and ask students to calculate the mean and median. Discuss their answers and interpretations. Slide 7: Introduction to Python Programming Discuss Python's role in quantitative analysis and libraries like NumPy, pandas, and Matplotlib. Interactive: Ask students if they have any prior experience with Python. Use a poll to gather responses and adjust the pace accordingly. Slide 8: Python Basics Introduce Python syntax, variables, and data types. Interactive: Present code snippets and ask students to identify the data types used. Encourage them to share their answers in the chat. Slide 9: Data Manipulation with Python Explain data cleaning, preprocessing, and using the pandas library. Interactive: Share a messy dataset and guide students through data cleaning steps using Python code. Slide 10: Data Visualization with Matplotlib Highlight the importance of data visualization and Matplotlib for creating plots. Interactive: Show a partially constructed plot and ask students to suggest code to complete it. Discuss different approaches. Slide 11: Statistical Analysis with Python Discuss how Python can be used for statistical tests and introduce the SciPy library. Interactive: Provide a sample hypothesis and guide students through the steps of setting up and performing a t-test using Python. Slide 12: Conclusion and Next Steps Summarize the key topics covered in the class. Interactive: Ask students to share one thing they found most interesting or challenging. Use the chat to gather responses and address any final questions.