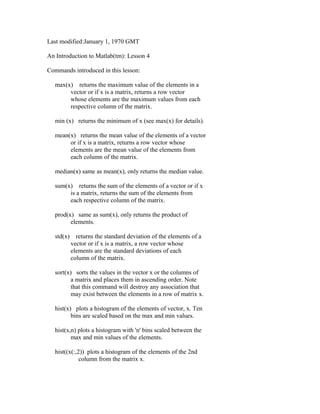
This document introduces Matlab commands for statistical calculations on vectors and matrices. It describes commands like max, min, mean, median, std, and sort that return statistical properties of data in a vector or column-wise in a matrix. It provides an example using a 12x3 matrix of temperature data and demonstrates how the commands return single values for vectors but row vectors describing each column when applied to matrices. The document explains that Matlab treats each column of a matrix separately for these calculations.
This 10 hours class is intended to give students the basis to empirically solve statistical problems. Talk 1 serves as an introduction to the statistical software R, and presents how to calculate basic measures such as mean, variance, correlation and gini index. Talk 2 shows how the central limit theorem and the law of the large numbers work empirically. Talk 3 presents the point estimate, the confidence interval and the hypothesis test for the most important parameters. Talk 4 introduces to the linear regression model and Talk 5 to the bootstrap world. Talk 5 also presents an easy example of a markov chains.
All the talks are supported by script codes, in R language.
This is a finite series which is the sum of first „n‟ natural numbers multiplied by their own respective
factorials. The series has been derived from HCR‟s Rank formula which was proposed by the author. It is
extremely useful in case studies & computations. Although HCR‟s Series is different from the Arithmetic,
Geometric, Harmonic & Taylor‟s Series of simple functions, it is the expansion of factorial of any natural
number in form of discrete summation thus it is also named as HCR‟s divergence series.
Introduction to use machine learning in python and pascal to do such a thing like train prime numbers when there are algorithms in place to determine prime numbers. See a dataframe, feature extracting and a few plots to re-search for another hot experiment to predict prime numbers.
At the beginning, the number of elements in a set of numbers to be stored in a computer system used to be not so large or having a wide range. Then, using a
simple table T [0, 1, ..., m − 1]called, direct-address table, could be used to store those numbers. As the situation became more and more complex, and a new idea came to be:
Definition
An associative array, map, symbol table, or dictionary is an abstract data type composed of a collection of tuples {(key, value)}
This can bee seen in the example of dictionaries in any spoken language. The problem became more complex when the range of the possible values for the
keys at the tuples became unbounded. Therefore a new type of data structure is needed to avoid the sparsity problem in the data, the hash table.
The Array is the most commonly used Data Structure.
An array is a collection of data elements that are of the same type (e.g., a collection of integers, collection of characters, collection of doubles).
OR
Array is a data structure that represents a collection of the same types of data.
The values held in an array are called array elements
An array stores multiple values of the same type – the element type
The element type can be a primitive type or an object reference
Therefore, we can create an array of integers, an array of characters, an array of String objects, an array of Coin objects, etc.
I am Joe B. I am a Logistics Assignment Expert at statisticshomeworkhelper.com. I hold a Bachelor's Degree in Business Logistics Management, from Texas University, USA. I have been helping students with their homework for the past 3 years. I solve assignments related to business and logistics.
Visit statisticshomeworkhelper.com or email info@statisticshomeworkhelper.com.
You can also call on +1 678 648 4277 for any assistance with Logistic Assignment.
An array consists of a set of objects (called its elements), all of which are of the same type and are arranged contiguously in memory. In general, only the array itself has a symbolic name, not its elements. Each element is identified by an index which denotes the position of the element in the array. The number of elements in an array is called its dimension. The dimension of an array is fixed and predetermined; it cannot be changed during program execution.
Arrays are suitable for representing composite data which consist of many similar, individual items. Examples include: a list of names, a table of world cities and their current temperatures, or the monthly transactions for a bank account.
A pointer is simply the address of an object in memory. Generally, objects can be accessed in two ways: directly by their symbolic name, or indirectly through a pointer. The act of getting to an object via a pointer to it, is called dereferencing the pointer. Pointer variables are defined to point to objects of a specific type so that when the pointer is dereferenced, a typed object is obtained.
Pointers are useful for creating dynamic objects during program execution. Unlike normal (global and local) objects which are allocated storage on the runtime stack, a dynamic object is allocated memory from a different storage area called the heap. Dynamic objects do not obey the normal scope rules.
Concurrent Hashing and Natural Parallelism : The Art of Multiprocessor Progra...Subhajit Sahu
Highlighted notes of:
Chapter 13: Concurrent Hashing and Natural Parallelism
Book:
The Art of Multiprocessor Programming
Authors:
Maurice Herlihy
Nir Shavit
Maurice Herlihy has an A.B. in Mathematics from Harvard University, and a Ph.D. in Computer Science from M.I.T. He has served on the faculty of Carnegie Mellon University and the staff of DEC Cambridge Research Lab. He is the recipient of the 2003 Dijkstra Prize in Distributed Computing, the 2004 Gödel Prize in theoretical computer science, the 2008 ISCA influential paper award, the 2012 Edsger W. Dijkstra Prize, and the 2013 Wallace McDowell award. He received a 2012 Fulbright Distinguished Chair in the Natural Sciences and Engineering Lecturing Fellowship, and he is fellow of the ACM, a fellow of the National Academy of Inventors, the National Academy of Engineering, and the National Academy of Arts and Sciences.
Nir Shavit received B.Sc. and M.Sc. degrees in Computer Science from the Technion - Israel Institute of Technology in 1984 and 1986, and a Ph.D. in Computer Science from the Hebrew University of Jerusalem in 1990. Shavit is a co-author of the book The Art of Multiprocessor Programming. He is a recipient of the 2004 Gödel Prize in theoretical computer science for his work on applying tools from algebraic topology to model shared memory computability and of the 2012 Dijkstra Prize in Distributed Computing for the introduction of Software Transactional Memory. He is a past program chair of the ACM Symposium on Principles of Distributed Computing (PODC) and the ACM Symposium on Parallelism in Algorithms and Architectures (SPAA). His current research covers techniques for desinging scalable software for multiprocessors, in particular concurrent data structures for multicore machines.
Concept and Definition of Data Structures
Introduction to Data Structures: Information and its meaning, Array in C++: The array as an ADT, Using one dimensional array, Two dimensional array, Multi dimensional array, Structure , Union, Classes in C++.
https://github.com/ashim888/dataStructureAndAlgorithm
An array is a collection of data items, all of the same type, accessed using a common name. A one-dimensional array is like a list; A two dimensional array is like a table; The C language places no limits on the number of dimensions in an array, though specific implementations may.
Arrays are complex variables that can hold multiple values of the same data type.
Array is a fixed type sequenced collection of elements of the same data type.
It is simply a grouping of like-type data.
Some examples where a concept of arrays can be used :-
1) List of employees in an organization.
2) Exam scores of a class of students.
3) Table of daily rainfall data.
MATLAB/SIMULINK for Engineering Applications day 2:Introduction to simulinkreddyprasad reddyvari
3 days Hands on workshop on MATLAB/SIMULINK for Engineering Applications:
this workshop aims to make students to aware of MATLAB to do own projects in engineering life with best available technology E-Simulink Softwares and tools.
Introductory session for basic matlab commands and a brief overview of K-mean clustering algorithm with image processing example.
NOTE: you can find code of k-mean clustering algorithm for image processing in notes.
GDG Cloud Southlake #33: Boule & Rebala: Effective AppSec in SDLC using Deplo...James Anderson
Effective Application Security in Software Delivery lifecycle using Deployment Firewall and DBOM
The modern software delivery process (or the CI/CD process) includes many tools, distributed teams, open-source code, and cloud platforms. Constant focus on speed to release software to market, along with the traditional slow and manual security checks has caused gaps in continuous security as an important piece in the software supply chain. Today organizations feel more susceptible to external and internal cyber threats due to the vast attack surface in their applications supply chain and the lack of end-to-end governance and risk management.
The software team must secure its software delivery process to avoid vulnerability and security breaches. This needs to be achieved with existing tool chains and without extensive rework of the delivery processes. This talk will present strategies and techniques for providing visibility into the true risk of the existing vulnerabilities, preventing the introduction of security issues in the software, resolving vulnerabilities in production environments quickly, and capturing the deployment bill of materials (DBOM).
Speakers:
Bob Boule
Robert Boule is a technology enthusiast with PASSION for technology and making things work along with a knack for helping others understand how things work. He comes with around 20 years of solution engineering experience in application security, software continuous delivery, and SaaS platforms. He is known for his dynamic presentations in CI/CD and application security integrated in software delivery lifecycle.
Gopinath Rebala
Gopinath Rebala is the CTO of OpsMx, where he has overall responsibility for the machine learning and data processing architectures for Secure Software Delivery. Gopi also has a strong connection with our customers, leading design and architecture for strategic implementations. Gopi is a frequent speaker and well-known leader in continuous delivery and integrating security into software delivery.
Encryption in Microsoft 365 - ExpertsLive Netherlands 2024Albert Hoitingh
In this session I delve into the encryption technology used in Microsoft 365 and Microsoft Purview. Including the concepts of Customer Key and Double Key Encryption.
DevOps and Testing slides at DASA ConnectKari Kakkonen
My and Rik Marselis slides at 30.5.2024 DASA Connect conference. We discuss about what is testing, then what is agile testing and finally what is Testing in DevOps. Finally we had lovely workshop with the participants trying to find out different ways to think about quality and testing in different parts of the DevOps infinity loop.
Connector Corner: Automate dynamic content and events by pushing a buttonDianaGray10
Here is something new! In our next Connector Corner webinar, we will demonstrate how you can use a single workflow to:
Create a campaign using Mailchimp with merge tags/fields
Send an interactive Slack channel message (using buttons)
Have the message received by managers and peers along with a test email for review
But there’s more:
In a second workflow supporting the same use case, you’ll see:
Your campaign sent to target colleagues for approval
If the “Approve” button is clicked, a Jira/Zendesk ticket is created for the marketing design team
But—if the “Reject” button is pushed, colleagues will be alerted via Slack message
Join us to learn more about this new, human-in-the-loop capability, brought to you by Integration Service connectors.
And...
Speakers:
Akshay Agnihotri, Product Manager
Charlie Greenberg, Host
Epistemic Interaction - tuning interfaces to provide information for AI supportAlan Dix
Paper presented at SYNERGY workshop at AVI 2024, Genoa, Italy. 3rd June 2024
https://alandix.com/academic/papers/synergy2024-epistemic/
As machine learning integrates deeper into human-computer interactions, the concept of epistemic interaction emerges, aiming to refine these interactions to enhance system adaptability. This approach encourages minor, intentional adjustments in user behaviour to enrich the data available for system learning. This paper introduces epistemic interaction within the context of human-system communication, illustrating how deliberate interaction design can improve system understanding and adaptation. Through concrete examples, we demonstrate the potential of epistemic interaction to significantly advance human-computer interaction by leveraging intuitive human communication strategies to inform system design and functionality, offering a novel pathway for enriching user-system engagements.
State of ICS and IoT Cyber Threat Landscape Report 2024 previewPrayukth K V
The IoT and OT threat landscape report has been prepared by the Threat Research Team at Sectrio using data from Sectrio, cyber threat intelligence farming facilities spread across over 85 cities around the world. In addition, Sectrio also runs AI-based advanced threat and payload engagement facilities that serve as sinks to attract and engage sophisticated threat actors, and newer malware including new variants and latent threats that are at an earlier stage of development.
The latest edition of the OT/ICS and IoT security Threat Landscape Report 2024 also covers:
State of global ICS asset and network exposure
Sectoral targets and attacks as well as the cost of ransom
Global APT activity, AI usage, actor and tactic profiles, and implications
Rise in volumes of AI-powered cyberattacks
Major cyber events in 2024
Malware and malicious payload trends
Cyberattack types and targets
Vulnerability exploit attempts on CVEs
Attacks on counties – USA
Expansion of bot farms – how, where, and why
In-depth analysis of the cyber threat landscape across North America, South America, Europe, APAC, and the Middle East
Why are attacks on smart factories rising?
Cyber risk predictions
Axis of attacks – Europe
Systemic attacks in the Middle East
Download the full report from here:
https://sectrio.com/resources/ot-threat-landscape-reports/sectrio-releases-ot-ics-and-iot-security-threat-landscape-report-2024/
JMeter webinar - integration with InfluxDB and GrafanaRTTS
Watch this recorded webinar about real-time monitoring of application performance. See how to integrate Apache JMeter, the open-source leader in performance testing, with InfluxDB, the open-source time-series database, and Grafana, the open-source analytics and visualization application.
In this webinar, we will review the benefits of leveraging InfluxDB and Grafana when executing load tests and demonstrate how these tools are used to visualize performance metrics.
Length: 30 minutes
Session Overview
-------------------------------------------
During this webinar, we will cover the following topics while demonstrating the integrations of JMeter, InfluxDB and Grafana:
- What out-of-the-box solutions are available for real-time monitoring JMeter tests?
- What are the benefits of integrating InfluxDB and Grafana into the load testing stack?
- Which features are provided by Grafana?
- Demonstration of InfluxDB and Grafana using a practice web application
To view the webinar recording, go to:
https://www.rttsweb.com/jmeter-integration-webinar
Securing your Kubernetes cluster_ a step-by-step guide to success !KatiaHIMEUR1
Today, after several years of existence, an extremely active community and an ultra-dynamic ecosystem, Kubernetes has established itself as the de facto standard in container orchestration. Thanks to a wide range of managed services, it has never been so easy to set up a ready-to-use Kubernetes cluster.
However, this ease of use means that the subject of security in Kubernetes is often left for later, or even neglected. This exposes companies to significant risks.
In this talk, I'll show you step-by-step how to secure your Kubernetes cluster for greater peace of mind and reliability.
UiPath Test Automation using UiPath Test Suite series, part 3DianaGray10
Welcome to UiPath Test Automation using UiPath Test Suite series part 3. In this session, we will cover desktop automation along with UI automation.
Topics covered:
UI automation Introduction,
UI automation Sample
Desktop automation flow
Pradeep Chinnala, Senior Consultant Automation Developer @WonderBotz and UiPath MVP
Deepak Rai, Automation Practice Lead, Boundaryless Group and UiPath MVP
UiPath Test Automation using UiPath Test Suite series, part 4DianaGray10
Welcome to UiPath Test Automation using UiPath Test Suite series part 4. In this session, we will cover Test Manager overview along with SAP heatmap.
The UiPath Test Manager overview with SAP heatmap webinar offers a concise yet comprehensive exploration of the role of a Test Manager within SAP environments, coupled with the utilization of heatmaps for effective testing strategies.
Participants will gain insights into the responsibilities, challenges, and best practices associated with test management in SAP projects. Additionally, the webinar delves into the significance of heatmaps as a visual aid for identifying testing priorities, areas of risk, and resource allocation within SAP landscapes. Through this session, attendees can expect to enhance their understanding of test management principles while learning practical approaches to optimize testing processes in SAP environments using heatmap visualization techniques
What will you get from this session?
1. Insights into SAP testing best practices
2. Heatmap utilization for testing
3. Optimization of testing processes
4. Demo
Topics covered:
Execution from the test manager
Orchestrator execution result
Defect reporting
SAP heatmap example with demo
Speaker:
Deepak Rai, Automation Practice Lead, Boundaryless Group and UiPath MVP
LF Energy Webinar: Electrical Grid Modelling and Simulation Through PowSyBl -...DanBrown980551
Do you want to learn how to model and simulate an electrical network from scratch in under an hour?
Then welcome to this PowSyBl workshop, hosted by Rte, the French Transmission System Operator (TSO)!
During the webinar, you will discover the PowSyBl ecosystem as well as handle and study an electrical network through an interactive Python notebook.
PowSyBl is an open source project hosted by LF Energy, which offers a comprehensive set of features for electrical grid modelling and simulation. Among other advanced features, PowSyBl provides:
- A fully editable and extendable library for grid component modelling;
- Visualization tools to display your network;
- Grid simulation tools, such as power flows, security analyses (with or without remedial actions) and sensitivity analyses;
The framework is mostly written in Java, with a Python binding so that Python developers can access PowSyBl functionalities as well.
What you will learn during the webinar:
- For beginners: discover PowSyBl's functionalities through a quick general presentation and the notebook, without needing any expert coding skills;
- For advanced developers: master the skills to efficiently apply PowSyBl functionalities to your real-world scenarios.
LF Energy Webinar: Electrical Grid Modelling and Simulation Through PowSyBl -...
Lesson 4
1. Last modified:January 1, 1970 GMT
An Introduction to Matlab(tm): Lesson 4
Commands introduced in this lesson:
max(x) returns the maximum value of the elements in a
vector or if x is a matrix, returns a row vector
whose elements are the maximum values from each
respective column of the matrix.
min (x) returns the minimum of x (see max(x) for details).
mean(x) returns the mean value of the elements of a vector
or if x is a matrix, returns a row vector whose
elements are the mean value of the elements from
each column of the matrix.
median(x) same as mean(x), only returns the median value.
sum(x) returns the sum of the elements of a vector or if x
is a matrix, returns the sum of the elements from
each respective column of the matrix.
prod(x) same as sum(x), only returns the product of
elements.
std(x)
returns the standard deviation of the elements of a
vector or if x is a matrix, a row vector whose
elements are the standard deviations of each
column of the matrix.
sort(x) sorts the values in the vector x or the columns of
a matrix and places them in ascending order. Note
that this command will destroy any association that
may exist between the elements in a row of matrix x.
hist(x) plots a histogram of the elements of vector, x. Ten
bins are scaled based on the max and min values.
hist(x,n) plots a histogram with 'n' bins scaled between the
max and min values of the elements.
hist((x(:,2)) plots a histogram of the elements of the 2nd
column from the matrix x.
2. The 'matlab' commands introduced in this lesson perform
simple statistical calculations that are mostly self-explanatory.
A simple series of examples are illustrated below. Note that
'matlab' treats each COLUMN OF A MATRIX as a unique set of "data",
however, vectors can be row or column format. Begin the exercise
by creating a 12x3 matrix that represents a time history of two
stochastic temperature measurements.
Load these data into a matrix called 'timtemp.dat' using an
editor to build an ASCII file.
Time(sec)
0.0
1.0
2.0
3.0
4.0
5.0
6.0
7.0
8.0
9.0
10.0
11.0
Temp-T1(K)
Temp-T2(K)
306
125
305
121
312
123
309
122
308
124
299
129
311
122
303
122
306
123
303
127
306
124
304
123
Execute the commands at the beginning of the lesson above and
observe the results. Note that when the argument is 'timtemp', a
matrix, the result is a 1x3 vector. For example, the command
M = max(timtemp)
gives
M = 11 312 129
If the argument is a single column from the matrix, the
command identifies the particular column desired. The command
M2 = max(timtemp(:,2))
gives
M2 = 312
If the variance of a set of data in a column of the matrix is
desired, the standard deviation is squared. The command
T1_var = (std(timtemp(:,2)))^2
gives
T1_var = 13.2727
3. If the standard deviation of the matrix of data is found using
STDDEV = std(timtemp)
gives
STDDEV = 3.6056 3.6432 2.3012
Note that the command
VAR = STDDEV^2
is not acceptable; however, the command
VAR = STDDEV.^2
is acceptable, creating the results,
VAR = 13.0000 13.2727 5.2955
Back to Matlab In-House Tutorials