
Recommended
More Related Content
Similar to DID YOU KNOWAccording to the American Wind Energy Association,.docx
Similar to DID YOU KNOWAccording to the American Wind Energy Association,.docx (20)
More from MARRY7
More from MARRY7 (20)
Recently uploaded
Recently uploaded (20)
DID YOU KNOWAccording to the American Wind Energy Association,.docx
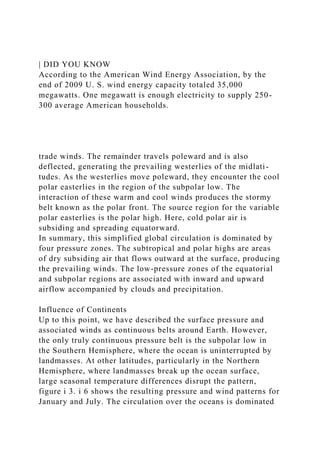
- 1. | DID YOU KNOW According to the American Wind Energy Association, by the end of 2009 U. S. wind energy capacity totaled 35,000 megawatts. One megawatt is enough electricity to supply 250- 300 average American households. trade winds. The remainder travels poleward and is also deflected, generating the prevailing westerlies of the midlati- tudes. As the westerlies move poleward, they encounter the cool polar easterlies in the region of the subpolar low. The interaction of these warm and cool winds produces the stormy belt known as the polar front. The source region for the variable polar easterlies is the polar high. Here, cold polar air is subsiding and spreading equatorward. In summary, this simplified global circulation is dominated by four pressure zones. The subtropical and polar highs are areas of dry subsiding air that flows outward at the surface, producing the prevailing winds. The low-pressure zones of the equatorial and subpolar regions are associated with inward and upward airflow accompanied by clouds and precipitation. Influence of Continents Up to this point, we have described the surface pressure and associated winds as continuous belts around Earth. However, the only truly continuous pressure belt is the subpolar low in the Southern Hemisphere, where the ocean is uninterrupted by landmasses. At other latitudes, particularly in the Northern Hemisphere, where landmasses break up the ocean surface, large seasonal temperature differences disrupt the pattern, figure i 3. i 6 shows the resulting pressure and wind patterns for January and July. The circulation over the oceans is dominated
- 2. by semipermanent cells of high pressure in the subtropics and cells of low pressure over the subpolar regions. The subtropical highs are responsible for the trade winds and westerlies, as mentioned earlier. The large landmasses, on the other hand, particularly Asia, become cold in the winter and develop a seasonal high-pressure system from which surface flow is directed off the land (Figure 13.16). In the summer, the opposite occurs; the landmasses are heated and develop a low-pressure cell, which permits air to flow onto the land. These seasonal changes in wind direction are known as the monsoons. During warm months, areas such as India experience a flow of warm, water-laden air from the Indian Ocean, which produces the rainy summer monsoon. The winter monsoon is dominated by dry continental air. A similar situation exists, but to a lesser extent, over North America. In summary, the general circulation is produced by semipermanent cells of high and low pressure over the oceans and is complicated by seasonal pressure changes over land. THE WESTERLIES The circulation in the midlatitudes, the zone of the westerlies, is complex and does not fit the convection system proposed for the tropics. Between 30 and 60 degrees latitude, the general west- to-east flow is interrupted by the migration of cyclones and anticyclones. In the Northern Hemisphere, these cells move from west to east around the globe, creating an anticyclonic (clockwise) flow or a cyclonic (counterclockwise) flow in their area of influence. A close correlation exists between the paths taken by these surface pressure systems and the position of the upper-level airflow, indicating that the upper air steers the movement of cyclonic and anti-cyclonic systems. Among the most obvious features of the flow aloft are the seasonal changes. The steep temperature gradient across the middle latitudes in the winter months corresponds to a stronger flow aloft. In addition, the polar jet stream fluctuates seasonally such that its average position migrates southward with the approach of winter, and northward as summer nears. By
- 3. midwinter, the jet core may penetrate as far south as central Florida. Because the paths of low-pressure centers are guided by the flow aloft, we can expect the southern tier of states to experience more of their stormy weather in the winter season. During the hot summer months, the storm track is across the northern states, and some cyclones never leave Canada. The northerly storm track associated with summer also applies to Pacific storms, which move toward Alaska during the warm months, thus producing an extended dry season for much of the West Coast. The number of cyclones generated is seasonal as well, with the largest number occurring in the cooler months when the temperature gradients are greatest. This fact is in agreement with the role of cyclonic storms in the distribution of heat across the midlatitudes. Now that we have examined Earth's large-scale circulation, let us turn briefly to winds that influence much smaller areas. Remember that all winds are produced for the same reason: pressure differences that arise because of temperature differences caused by unequal heating of Earth's surface. Local winds are simply small-scale winds produced by a locally generated pressure gradient. Those described here are caused either by topographic effects or by variations in surface composition in the immediate area. Land and Sea Breezes In coastal areas during the warm summer months, the land is heated more intensely during the daylight hours than the adjacent body of water. As a result, the air above the land surface heats, expands, and rises, creating an area of lower pressure. A sea breeze then develops, because cooler air over the water (higher pressure) moves toward the warmer land
- 4. 382 chapter 13 The Atmosphere in Motion ( Local Winds 383 figure 13.16 Average surface barometric pressure in millibars for a. January and b. July, with associated winds . The pressure zones clearly migrate north-south following the Sun's vertical rays. The line labeled "ITCZ" refers to the intertropical convergence zone and corresponds to the equatorial low. This region of ascending moist hot air is associated with abunda nt precipitation. It gets its name because it is the region where the trade winds converge. )(lower pressure) (figure 13.17a). The sea breeze begins to develop shortly before noon and generally reaches its greatest intensity during the mid- to late afternoon. These relatively cool winds can be a significant moderating influence on afternoon temperatures in coastal areas. Small-scale sea breezes can also develop along the shores of large lakes. People who live in a city near the Great Lakes, such as Chicago, recognize this lake effect, especially in the summer. They are reminded daily by weather reports of the cool temperatures near the lake as compared to warmer outlying areas. ( B. Land breeze ) (
- 5. A. Sea breeze )figure 13.17 A sea breeze and a land breeze. a. During the daylight hours, the air above the land heats and expands, creating an area of lower pressure. Cooler and denser air over the water moves onto the land, generating a sea breeze. b. At night, the land cools more rapidly than the water, generating an offshore flow called a land breeze. 384 chapter 13 The Atmosphere in Motion ( Warm air figure 13.18 Valley and mountain breezes. a. Heating during the daylight hours warms the air along the mountain slopes. Thi s warm air rises, generating a valley breeze. b. After sunset, cooling of the air near the mountain can result in cool air drainage into the valley, producing the mountain breeze. B. Mountain breeze )At night, the reverse may take place. The land cools more rapidly than the sea, and the land breeze develops (figure i3.i7b). Mountain and Valley Breezes — -—- *M A. Valley breeze A daily wind similar to land and sea breezes occurs in many mountainous regions. During daylight hours, the air along the slopes of the mountains is heated more intensely than the air at the same elevation over the valley floor. Because this warmer air is less dense, it glides up along the slope and generates a valley breeze (figure i3.i8a). The occurrence of
- 6. these daytime upslope breezes can often be identified by the cumulus clouds that develop on adjacent mountain peaks. After sunset, the pattern may reverse. Rapid radiation cooling along the mountain slopes produces a layer of cooler air next to the ground. Because cool air is denser than warm air, it drains downslope into the valley. This movement of air is called the mountain breeze (figure i3.i8b). The same type of cool air drainage can occur in places that have very modest slopes. The result is that the coldest pockets of air are usually found in the lowest spots. Like many other winds, mountain and valley breezes have seasonal preferences. Although valley breezes are most common during the warm season when solar heating is most intense, mountain breezes tend to be more dominant in the cold season. Chinook and Santa Ana Winds Warm, dry winds sometimes move down the east slopes of the Rockies, where they are called chinooks. Such winds are often created when a strong pressure gradient develops in a mountainous region. As the air descends the leeward slopes of the mountains, it is heated adiabatically (by compression). Because condensation 384 chapter 13 The Atmosphere in Motion How Wind Is Measured 385 DID YOU KNOW? DID YOU KNOW;' ( figure 13.19 This satellite image shows strong Santa Ana winds fanning the flames of several large wildfires in Southern California on October 27,2003. These fires scorched more than 740,000 acres and destroyed more than 3000 homes. (NASA) )
- 7. "Snow eaters" is a local term for chinooks, the warm, dry winds that descend the eastern slopes of the Rockies.These winds have been known to melt more than a foot of snow in a single day. A chinook that moved through Granville, North Dakota, on February 21, 1918, caused temperatures to rise from -33°F to 50°F,an increase of 83°F! may have occurred as the air ascended the windward side, releasing latent heat, the air descending the leeward slope will be warmer and drier than it was at a similar elevation on the windward side. Although the temperature of these winds is generally less than 10°C (50°F), which is not particularly warm, they occur mostly in the winter and spring when the affected areas may be experiencing below-freezing temperatures. Thus, by comparison, these dry, warm winds often bring a drastic change. When the ground has a snow cover, these winds are known to melt it in short order. The word chinook literally means "snow eater." A chinooklike wind that occurs in southern California is the Santa Ana. These hot, desiccating winds greatly increase the threat of fire in this already dry area (figure i 3.19). Two basic wind measurements, direction and speed, are particularly significant to weather observers. One simple device for determining both measurements is the wind sock that is a common sight at small airports and landing strips (figure i3.20a). The cone-shaped bag is open at both ends and is free to change position with shifts in wind direction. The degree to which the sock is inflated is an indication of wind speed. Winds are always labeled by the direction from which they blow. A north wind blows from the north toward the south, an east wind from the east toward the west. The instrument most commonly used to determine wind direction is the wind vane (figure i3.20b, upper right). This instrument, a common sight on
- 8. many buildings, always points into the wind. The wind direction is often shown on a dial that is connected to the wind vane. The dial indicates wind direction, either by points of the compass (N, NE, E, SE, etc.) or by a scale of 0° to 360°. On the latter scale, 0° or 360° are both north, 90° is east, 180° is south, and 270° is west. Wind speed is commonly measured using a cup anemometer (Figure 13.20B, upper left). The wind speed is read from a dial much like the speedometer of an automobile. Places where winds are steady and speeds are relatively high are potential sites for tapping wind energy. When the wind consistently blows more often from one direction than from any other, it is called a prevailing wind. You may be familiar with the prevailing westerlies that dominate the circulation in the midlatitudes. In the United States, for example, these winds consistently move the "weather" from west to east across the continent. Embedded within this general eastward flow are cells of high and low pressure with their characteristic clockwise and counterclockwise flow. As a result, the winds associated with the westerlies, as measured at the surface, often vary considerably from day to day and from place to place. By contrast, the direction of airflow associated with the belt of trade winds is much more consistent, as can be seen in figure 13.21. By knowing the locations of cyclones and anticyclones in relation to where you are, you can predict the changes in wind direction that will occur as a pressure center moves past. Because changes in wind direction often bring changes in temperature and moisture conditions, the ability to predict the winds can be very useful. In the Midwest, for example, a north wind may bring cool, dry air from Canada, whereas a south wind may bring warm, humid air from the Gulf of Mexico. Sir Francis Bacon summed it up nicely when he wrote, "Every wind has its weather."
- 9. D1D YOU KN OW? The highest wind speed recorded at a surface station is 372 km (231 mi) per hour, measured April 12,1934, at Mount Washington, New Hampshire. Located at an elevation of 1886 m (6288 ft), the observatory atop Mount Washington has an average wind speed of 56 km (35 mi) per hour. Faster wind speeds have undoubtedly occurred, but no instruments were in place to record them. Thunderstorms 401 Beginning in the late 1980s, it has been possible to detect cloud-to-ground lightning flashes in real time across the country. Since 1989, the National Lightning Detection Network has recorded an average of about 20 million cloud-to-ground flashes per year in the contiguous 48 states. In addition, about half of all flashes have more than one ground-strike point, so at least 30 million points on the ground are struck in an average year. Besides cloud-to-ground flashes, there are roughly 5 to 10 times as many flashes -within clouds. DID YOU KNOW? DID YOU KNOW;' ( figure 14.11 In parts of the Great Plains, cyclone is a synonym for tornado. The nickname for the athletic teams at Iowa State University is the Cyclones. (Iowa State University is the only Division I school to use Cyclones as its team name.The pictured logo was created to better communicate the school's image by combining the mascot, a cardinal bird named Cy and the Cyclone team name, a sw
- 10. irling twister in the bird's tail.) (Image courtesy of Iowa State University) ) booming thunder generated by a severe thunderstorm can be a spectacular event that elicits both awe and fear (figure 14.12). Of course, hurricanes and tornadoes also attract a great deal of much deserved attention. A single tornado outbreak or hurricane can cause many deaths as well as billions of dollars in property damage. In a typical year, the United States experiences thousands of violent thunderstorms, hundreds of floods and tornadoes, and several hurricanes. ( FIGURE 14.12 This lightning display occurred near Colorado Springs, Colorado. Lightning produces thunder. The el ectrical discharge of lightning superheats the air. In less than a second, the temperature rises by as much as 33,000°C. When air is heated this quickly, it expands explosively and produces the sound we hear as thunder. (Photo by Sean Cayton/The Image Work s) ) Thunderstorms are the first of three severe weather types we will examine in this chapter. Sections on tornadoes and hurricanes follow. Severe weather has a fascination that everyday weather phenomena cannot provide. The lightning display and Thunderstorm Occurrence Almost everyone has observed various small-scale phenomena that result from the vertical movements of relatively warm, unstable air. Perhaps you have seen a dust devil over an open field on a hot day whirling its dusty load to great heights. Or maybe you have noticed a bird glide effortlessly skyward on an invisible thermal of hot air. These examples illustrate the
- 11. dynamic thermal instability that occurs during the development of a thunderstorm. A thunderstorm is simply a storm that generates lightning and thunder. It frequently produces gusty winds, heavy rain, and hail. A thunderstorm may be produced by a single cumulonimbus cloud and influence only a small area, or it may be associated with clusters of cumulonimbus clouds covering a large area. Thunderstorms form when warm, humid air rises in an unstable environment. Various mechanisms can trigger the upward air movement needed to create thunderstorm-producing cumulonimbus clouds. One mechanism, the unequal heating of Earth's surface, significantly contributes to the formation of air- mass thunderstorms. These storms are associated with the scattered puffy cumulonimbus clouds that commonly form DID YOU KNOW? DID YOU KNOW;' 402 chapter 14 Weather Patterns and Severe Weather within maritime tropical air masses and produce scattered thunderstorms on summer days. Such storms are usually short- lived and seldom produce strong winds or hail. Another type of thunderstorm not only benefits from uneven surface heating but is associated with the lifting of warm air, as occurs along a front or a mountain slope. Moreover, diverging winds aloft frequently contribute to the formation of these storms because they tend to draw air from lower levels upward beneath them. Some of the thunderstorms of this type may produce high winds, damaging hail, flash floods, and tornadoes. Such storms are described as severe. At any given time, an estimated 2000 thunderstorms are in progress on Earth. As we would expect, the greatest number occur in the tropics, where warmth, plentiful moisture and instability are always present. About 45,000 thunderstorms take place each day, and more than 16 million occur annually around
- 12. the world. The lightning from these storms strikes Earth 100 times each second (figure i4.i3a). Annually, the United States experiences about 100,000 thunderstorms and millions of lightning strikes. A glance at figure i4.i3b shows that thunderstorms are most frequent in Florida and the eastern Gulf Coast region, where such activity is recorded between 70 and 100 days each year. The region on the east side of the Rockies in Colorado and New Mexico is next, with Because lightning and thunder occur simultaneously, it is possible for you to estimate how far away a lightning stroke occurred. Lightning is seen instantaneously, but sound travels more slowly (about 1000 ft per sec) and reaches us later. If thunder is heard five seconds after lightning is seen, the lightning occurred about 5000 ft (I mi) away. thunderstorms occurring on 60 to 70 days each year. Most of the rest of the nation experiences thunderstorms on 30 to 50 days annually. Clearly, the western margin of the United States has little thunderstorm activity. The same is true for the northern tier of states and for Canada, where warm, moist, unstable mT air seldom penetrates. Stages of Thunderstorm Development All thunderstorms require warm, moist air, which, when lifted, will release sufficient latent heat to provide the buoyancy necessary to maintain its upward flight. This instability ( A. Average annual lightning flashes per square kilometer. figure 14.13 a. Data from space-based optical sensors show the worldwide distribution of lightning, with color variations indicating the
- 13. average an nual number of lightning flashes per square kilometer.The map includes data obtained from April 1995 to March 2000 from NASA's Optical Transient De tector, and from December 1997 to November 2000 from NASA's Lightning Imaging Sensor. Both are satellite-bas ed sensors that use high-speed cameras capable of detecting brief lightning flashes even under daytime conditions. (NASA) B.Average number of days each year with thunderstorms.The humid subtropical climate that dominates the southeastern United States rece ives much of its precipitation in the form of thunderstorms. Most of the Southeast averages 50 or more days each year with thunderstorms. (Environmental Data Service, NOAA) ) Tornadoes 403 ( A. B. figure 14.14- a. Buoyant thermis often produce fair-weather cumulus clouds that soon evaporate into the surrounding air, making it more humid. As this process of cumulus development and evaporation continues, the air eventually becomes sufficiently humid, so that newly forming clouds do not evaporate but continue to grow. (Photo by Henry Lansford/Photo Researchers, Inc.) b .This developing cumulonimbus cloud became a towering August thunderstorm over central i '3 s P-oto by E.J.Tarbuck)
- 14. )and associated buoyancy are triggered by a number of different processes, yet most thunderstorms have a similar life history. Because instability and buoyancy are enhanced by high surface temperatures, thunderstorms are most common in the afternoon and early evening (figure 14.14a). However, surface heating alone is not sufficient for the growth of towering cumulonimbus clouds. A solitary cell of rising hot air produced by surface heating could, at best, produce a small cumulus cloud, which would evaporate within 10 to 15 minutes. The development of 12,000-meter (40,000-foot) (or on rare occasions 18,000-meter [60,000-foot]) cumulonimbus towers requires a continual supply of moist air (figure i4.i4b). Each new surge of warm air rises higher than the last, adding to the height of the cloud (figure 14.15). These updrafts must occasionally reach speeds over 100 kilometers (60 miles) per hour to accommodate the size of hailstones they are capable of carrying upward. Usually within an hour, the amount and size of precipitation that has accumulated is too much for the updrafts to support, and consequently downdrafts develop in one part of the cloud, releasing heavy precipitation. This represents the most active stage of the thunderstorm. Gusty winds, lightning, heavy precipitation, and sometimes hail are experienced. Eventually the warm, moist air supplied by updrafts ceases as downdrafts dominate throughout the cloud. The cooling effect of falling precipitation, coupled with the influx of colder air aloft, marks the end of the thunderstorm activity. The life span of a typical cumulonimbus cell within a thunderstorm complex is only about an hour, but as the storm moves, fresh supplies of warm, water-laden air generate new cells to replace those that are dissipating. Tornadoes are local storms of short duration that must be ranked high among nature's most destructive forces (see the chapter-opening photo, p. 391). The sporadic occurrence and
- 15. violent winds cause many deaths each year. Tornadoes are violent windstorms that take the form of a rotating column of air or vortex that extends downward from a cumulonimbus cloud. Pressures within some tornadoes have been estimated to be as much as 10 percent lower than immediately outside the storm. Drawn by the much lower pressure in the center of the vortex, air near the ground rushes into the tornado DID YO U K N OW? • During the 1988-2007 period, lightning officially claimed an average of 53 lives each year in the United States. However, the National Weather Service estimates that the actual number of lightning deaths each year is closer to 100 because many lightning-related fatalities go unreported. About 10 percent of lightning strike victims are killed. Among the 90 percent that survive, many suffer life-long injury and disability.