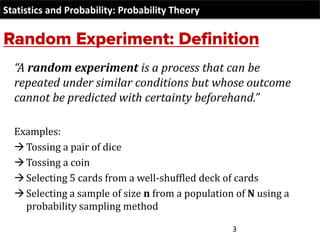
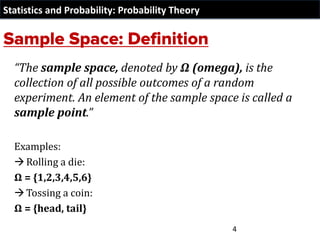
This document provides an introduction to basic probability theory concepts. It defines key terms like random experiment, sample space, sample point, event, mutually exclusive events, and independent events. Examples are given to illustrate these concepts, such as listing the sample spaces and events for experiments like rolling dice, tossing coins, and selecting students. The properties of the impossible event (empty set) and sure event (sample space) are also discussed. Overall, the document aims to explain the basic foundations of probability theory and provide practice applying these concepts to solve probability problems.
JEE Mathematics/ Lakshmikanta Satapathy/ Theory of Probability part 9 which explains Random variables , its probability distribution, Mean of a random variable and Variance of a random variable
PROBABILITYAND PROBABILITY DISTRIBUTIONS
Session 2.2
TEACHING BASIC STATISTICS
Motivation for Studying Chance
Sample StatisticEstimatesPopulation Parameter
e.g. Sample Mean X= 50estimatesPopulation Mean m
Questions:
1.
How do we assess the reliability of our estimate?
2.
What is an adequate sample size? [ We would expect a large sample to give better estimates. Large samples more costly.]
Session 2.3
TEACHING BASIC STATISTICS
An Approach to Solve the Questions
If sample was chosen through chance processes, we have to understand the notion of probability and sampling distribution.
Session 2.4
TEACHING BASIC STATISTICS
To introduce probability….
◼
Random experiment
◼
Sample space
◼
Event as subset of sample space
◼
Likelihood of an event to occur -probability of an event
Session 2.5
TEACHING BASIC STATISTICS
Features of a Random Experiment
◼
All outcomes are known in advance.
◼
The outcome of any one trial is unpredictable.
◼
Trials are repeatable under identical conditions.
Session 2.6
TEACHING BASIC STATISTICS
EXAMPLES
◼
Rolling a die and observing the number of dots on the upturned face
◼
Tossing a one-peso coin and observing the upturned face
◼
Measuring the height of a student enrolled this term
Session 2.7
TEACHING BASIC STATISTICS
SAMPLE SPACE
◼
It is a set such that each element denotes an outcome of a random experiment.
◼
Any performance of the experiment results in an outcome that corresponds to exactly one and only one element.
◼
It is usually denoted by S.
Session 2.8
TEACHING BASIC STATISTICS
ILLUSTRATION
Rolling a die and observing the number of dots on the upturned face
S={ , , , , , }
S={1, 2, 3, 4, 5, 6}
Session 2.9
TEACHING BASIC STATISTICS
EVENT
◼
A subset of the sample space
◼
Usually denoted by capital letters like E, Aor B
◼
Observance of the elements of the subset implies the occurrence of the event
◼
Can either be classified as simple or compound event
Session 2.10
TEACHING BASIC STATISTICS
ILLUSTRATION
S = {1, 2, 3, 4, 5, 6}
An event of observing odd-number of dots in a roll of a die
E1= { 1, 3, 5}
An event of observing even-number of dots in a roll of a die
E2= { 2, 4, 6}
Session 2.11
TEACHING BASIC STATISTICS
Visualizing Events
◼ Contingency Tables
◼ Tree Diagrams
Red 2 24 26
Black 2 24 26
Total 4 48 52
Ace Not Ace Total
Full
Deck
of Cards
Red Cards
Black
Cards
Not an Ace
Ace
Ace
Not an Ace
Session 2.12
TEACHING BASIC STATISTICS
Mutually Exclusive Events
Two events are mutuallyexclusiveif one and only one of them can occur at a time.
Example:
Coin toss: either a head or a tail, but not both. The events head and tail are mutually exclusive.
Session 2.13
TEACHING BASIC STATISTICS
▪
The numerical measure of the likelihood that an event will occur
▪
Between 0 and 1
Note: Sum of the probabilities of all mutually exclusive and collective exhaustive events is 1
Certain
Impossible
0.5
1
0
PROBABILITY
Session 2.14
TEACHING BASIC STATISTICS
Assigning Probabilities
◼
Subjective
confident student views chances of passing a course to
Show drafts
volume_up
Empowering the Data Analytics Ecosystem: A Laser Focus on Value
The data analytics ecosystem thrives when every component functions at its peak, unlocking the true potential of data. Here's a laser focus on key areas for an empowered ecosystem:
1. Democratize Access, Not Data:
Granular Access Controls: Provide users with self-service tools tailored to their specific needs, preventing data overload and misuse.
Data Catalogs: Implement robust data catalogs for easy discovery and understanding of available data sources.
2. Foster Collaboration with Clear Roles:
Data Mesh Architecture: Break down data silos by creating a distributed data ownership model with clear ownership and responsibilities.
Collaborative Workspaces: Utilize interactive platforms where data scientists, analysts, and domain experts can work seamlessly together.
3. Leverage Advanced Analytics Strategically:
AI-powered Automation: Automate repetitive tasks like data cleaning and feature engineering, freeing up data talent for higher-level analysis.
Right-Tool Selection: Strategically choose the most effective advanced analytics techniques (e.g., AI, ML) based on specific business problems.
4. Prioritize Data Quality with Automation:
Automated Data Validation: Implement automated data quality checks to identify and rectify errors at the source, minimizing downstream issues.
Data Lineage Tracking: Track the flow of data throughout the ecosystem, ensuring transparency and facilitating root cause analysis for errors.
5. Cultivate a Data-Driven Mindset:
Metrics-Driven Performance Management: Align KPIs and performance metrics with data-driven insights to ensure actionable decision making.
Data Storytelling Workshops: Equip stakeholders with the skills to translate complex data findings into compelling narratives that drive action.
Benefits of a Precise Ecosystem:
Sharpened Focus: Precise access and clear roles ensure everyone works with the most relevant data, maximizing efficiency.
Actionable Insights: Strategic analytics and automated quality checks lead to more reliable and actionable data insights.
Continuous Improvement: Data-driven performance management fosters a culture of learning and continuous improvement.
Sustainable Growth: Empowered by data, organizations can make informed decisions to drive sustainable growth and innovation.
By focusing on these precise actions, organizations can create an empowered data analytics ecosystem that delivers real value by driving data-driven decisions and maximizing the return on their data investment.
Opendatabay - Open Data Marketplace.pptxOpendatabay
Opendatabay.com unlocks the power of data for everyone. Open Data Marketplace fosters a collaborative hub for data enthusiasts to explore, share, and contribute to a vast collection of datasets.
First ever open hub for data enthusiasts to collaborate and innovate. A platform to explore, share, and contribute to a vast collection of datasets. Through robust quality control and innovative technologies like blockchain verification, opendatabay ensures the authenticity and reliability of datasets, empowering users to make data-driven decisions with confidence. Leverage cutting-edge AI technologies to enhance the data exploration, analysis, and discovery experience.
From intelligent search and recommendations to automated data productisation and quotation, Opendatabay AI-driven features streamline the data workflow. Finding the data you need shouldn't be a complex. Opendatabay simplifies the data acquisition process with an intuitive interface and robust search tools. Effortlessly explore, discover, and access the data you need, allowing you to focus on extracting valuable insights. Opendatabay breaks new ground with a dedicated, AI-generated, synthetic datasets.
Leverage these privacy-preserving datasets for training and testing AI models without compromising sensitive information. Opendatabay prioritizes transparency by providing detailed metadata, provenance information, and usage guidelines for each dataset, ensuring users have a comprehensive understanding of the data they're working with. By leveraging a powerful combination of distributed ledger technology and rigorous third-party audits Opendatabay ensures the authenticity and reliability of every dataset. Security is at the core of Opendatabay. Marketplace implements stringent security measures, including encryption, access controls, and regular vulnerability assessments, to safeguard your data and protect your privacy.
Levelwise PageRank with Loop-Based Dead End Handling Strategy : SHORT REPORT ...Subhajit Sahu
Abstract — Levelwise PageRank is an alternative method of PageRank computation which decomposes the input graph into a directed acyclic block-graph of strongly connected components, and processes them in topological order, one level at a time. This enables calculation for ranks in a distributed fashion without per-iteration communication, unlike the standard method where all vertices are processed in each iteration. It however comes with a precondition of the absence of dead ends in the input graph. Here, the native non-distributed performance of Levelwise PageRank was compared against Monolithic PageRank on a CPU as well as a GPU. To ensure a fair comparison, Monolithic PageRank was also performed on a graph where vertices were split by components. Results indicate that Levelwise PageRank is about as fast as Monolithic PageRank on the CPU, but quite a bit slower on the GPU. Slowdown on the GPU is likely caused by a large submission of small workloads, and expected to be non-issue when the computation is performed on massive graphs.
Adjusting primitives for graph : SHORT REPORT / NOTESSubhajit Sahu
Graph algorithms, like PageRank Compressed Sparse Row (CSR) is an adjacency-list based graph representation that is
Multiply with different modes (map)
1. Performance of sequential execution based vs OpenMP based vector multiply.
2. Comparing various launch configs for CUDA based vector multiply.
Sum with different storage types (reduce)
1. Performance of vector element sum using float vs bfloat16 as the storage type.
Sum with different modes (reduce)
1. Performance of sequential execution based vs OpenMP based vector element sum.
2. Performance of memcpy vs in-place based CUDA based vector element sum.
3. Comparing various launch configs for CUDA based vector element sum (memcpy).
4. Comparing various launch configs for CUDA based vector element sum (in-place).
Sum with in-place strategies of CUDA mode (reduce)
1. Comparing various launch configs for CUDA based vector element sum (in-place).
2. Statistics and Probability: Probability Theory
❖Define the terms related to basic probability theory
❖Illustrate the properties of a probability function
❖Define mutually exclusive events, conditional
probability and independent events
❖Apply basic concepts in probability theory
❖Solve problems involving probabilities
2
3. Statistics and Probability: Probability Theory
“A random experiment is a process that can be
repeated under similar conditions but whose outcome
cannot be predicted with certainty beforehand.”
Examples:
→Tossing a pair of dice
→Tossing a coin
→Selecting 5 cards from a well-shuffled deck of cards
→Selecting a sample of size n from a population of N using a
probability sampling method
3
4. Statistics and Probability: Probability Theory
“The sample space, denoted by Ω (omega), is the
collection of all possible outcomes of a random
experiment. An element of the sample space is called a
sample point.”
Examples:
→Rolling a die:
Ω = {1,2,3,4,5,6}
→Tossing a coin:
Ω = {head, tail}
4
5. Statistics and Probability: Probability Theory
Examples:
List the elements of the sample spaces of the following random
experiments:
1. Tossing a coin twice
2. Tossing a pair of dice
3. Four students are selected at random from a senior high
school and classified as grade 11 or grade 12 student. Using
the letter J for grade 11 and S for grade 12, list the elements
of the sample space.
5
6. Statistics and Probability: Probability Theory
1. Tossing a coin twice
Ω = { HH, HT, TH, TT }
2. Tossing a pair of dice
Ω = { (1,1), (1,2), (1,3), (1,4), (1,5), (1,6), (2,1), (2,2), (2,3), (2,4), (2,5),
(2,6), (3,1), (3,2), (3,3), (3,4), (3,5), (3,6), (4,1), (4,2), (4,3), (4,4), (4,5),
(4,6), (5,1), (5,2), (5,3), (5,4), (5,5), (5,6), (6,1), (6,2), (6,3), (6,4), (6,5),
(6,6) }
3. Four students are selected at random from a senior high school and
classified as grade 11 or grade 12 student. Using the letter J for grade 11 and
S for grade 12, list the elements of the sample space.
Ω = { JJJJ, SSSS, JSSS, JJSS, JJJS, SSSJ, SSJJ, SJJJ, SJSJ, JSJS, SSJS, JJSJ, SJSS, JSJJ,
JSSJ, SJJS }
6
7. Statistics and Probability: Probability Theory
“An event is a subset of the sample space whose
probability is defined. We say that an event occurred if
the outcome of a random experiment is one of the
elements belonging in the event. Otherwise, the event did
not occur.”
We will use any capital Latin letter to denote an event of interest.
7
8. Statistics and Probability: Probability Theory
Consider the random experiment of rolling a die.
The sample space is given to be:
Ω = {1,2,3,4,5,6}
List the elements of the following events…
1. A = event of observing odd number of dots in a roll of a die
2. B = event of observing even number of dots in a roll of a die
3. C = event of observing less than 3 dots in a roll of a die
8
9. Statistics and Probability: Probability Theory
Consider the random experiment of rolling a die.
The sample space is given to be:
Ω = {1,2,3,4,5,6}
A = event of observing odd number of dots in a roll of a die
= {1,3,5}
B = event of observing even number of dots in a roll of a die
= {2,4,6}
C = event of observing less than 3 dots in a roll of a die
= {1,2}
9
10. Statistics and Probability: Probability Theory
Consider the experiment of tossing a pair of dice.
The sample space is given to be:
Ω = { (1,1), (1,2), (1,3), (1,4), (1,5), (1,6), (2,1), (2,2), (2,3), (2,4), (2,5), (2,6), (3,1),
(3,2), (3,3), (3,4), (3,5), (3,6), (4,1), (4,2), (4,3), (4,4), (4,5), (4,6), (5,1), (5,2), (5,3),
(5,4), (5,5), (5,6), (6,1), (6,2), (6,3), (6,4), (6,5), (6,6) }
List the elements of the following events:
1. A = event of having the same number of dots on both dice
2. B = event of 3 dots on one die
3. C = event of getting a sum of 5 dots on both dice
4. D = event of 7 dots on one die
5. E = event of not having the same number of dots on both
dice
10
11. Statistics and Probability: Probability Theory
Consider the experiment of tossing a pair of dice.
The sample space is given to be:
Ω = { (1,1), (1,2), (1,3), (1,4), (1,5), (1,6), (2,1), (2,2), (2,3), (2,4), (2,5), (2,6), (3,1),
(3,2), (3,3), (3,4), (3,5), (3,6), (4,1), (4,2), (4,3), (4,4), (4,5), (4,6), (5,1), (5,2), (5,3),
(5,4), (5,5), (5,6), (6,1), (6,2), (6,3), (6,4), (6,5), (6,6) }
A = event of having the same number of dots on both dice
= { (1,1), (2,2), (3,3), (4,4), (5,5), (6,6) }
B = event of 3 dots on one die
= { (3,1), (3,2), (3,3), (3,4), (3,5), (3,6), (1,3), (2,3), (4,3),
(5,3), (6,3) }
C = event of getting a sum of 5 dots on both dice
= { (1,4), (2,3), (3,2), (4,1) }
11
12. Statistics and Probability: Probability Theory
Consider the experiment of tossing a pair of dice.
The sample space is given to be:
Ω = { (1,1), (1,2), (1,3), (1,4), (1,5), (1,6), (2,1), (2,2), (2,3), (2,4), (2,5), (2,6), (3,1),
(3,2), (3,3), (3,4), (3,5), (3,6), (4,1), (4,2), (4,3), (4,4), (4,5), (4,6), (5,1), (5,2), (5,3),
(5,4), (5,5), (5,6), (6,1), (6,2), (6,3), (6,4), (6,5), (6,6) }
D = event of 7 dots on one die
= 𝜙
E = event of not having the same number of dots on both dice
= { (1,2), (1,3), (1,4), (1,5), (1,6), (2,1), (2,3), (2,4), (2,5),
(2,6), (3,1), (3,2), (3,4), (3,5), (3,6), (4,1), (4,2), (4,3), (4,5),
(4,6), (5,1), (5,2), (5,3), (5,4), (5,6), (6,1), (6,2), (6,3), (6,4),
(6,5) }
12
13. Statistics and Probability: Probability Theory
“The impossible event is the empty set 𝟇”
“The sure event is the sample space Ω.”
Note: These two subsets of the sample space will always be events.
Remember that an event occurs if the outcome of the experiment belongs in
it. But 𝜙 is the empty set so it does not contain any elements and thus, it is
impossible for this event to happen.
On the other hand, Ω is the sample space so it contains all possible outcomes
of the experiment and thus we are sure that it will always occur.
13
17. Statistics and Probability: Probability Theory
Consider the experiment of tossing a pair of dice.
The sample space is again given to be:
Ω = { (1,1), (1,2), (1,3), (1,4), (1,5), (1,6), (2,1), (2,2), (2,3), (2,4), (2,5), (2,6),
(3,1), (3,2), (3,3), (3,4), (3,5), (3,6), (4,1), (4,2), (4,3), (4,4), (4,5), (4,6), (5,1),
(5,2), (5,3), (5,4), (5,5), (5,6), (6,1), (6,2), (6,3), (6,4), (6,5), (6,6) }
From “Event: Example 2”, we know the following:
A = { (1,1), (2,2), (3,3), (4,4), (5,5), (6,6) }
B = { (3,1), (3,2), (3,3), (3,4), (3,5), (3,6), (1,3), (2,3), (4,3), (5,3), (6,3) }
C = { (1,4), (2,3), (3,2), (4,1) }
Find the following:
1. 𝐴𝐶 2. A ∪ B 3. A ∩ B 4. A ∪ B ∪ C 5. A ∩ B ∩ C
17
18. Statistics and Probability: Probability Theory
From “Event: Example 2”, we know the following:
A = { (1,1), (2,2), (3,3), (4,4), (5,5), (6,6) }
B = { (3,1), (3,2), (3,3), (3,4), (3,5), (3,6), (1,3), (2,3), (4,3), (5,3), (6,3) }
C = { (1,4), (2,3), (3,2), (4,1) }
𝑨𝑪
= sample points in the sample space but not in A
= { (1,2), (1,3), (1,4), (1,5), (1,6), (2,1), (2,3), (2,4), (2,5), (2,6), (3,1), (3,2),
(3,4), (3,5), (3,6), (4,1), (4,2), (4,3), (4,5), (4,6), (5,1), (5,2), (5,3), (5,4), (5,6),
(6,1), (6,2), (6,3), (6,4), (6,5) }
A ∪ B = union of A and B
= { (1,1), (2,2), (3,3), (4,4), (5,5), (6,6), (3,1), (3,2), (3,4), (3,5), (3,6), (1,3),
(2,3), (4,3), (5,3), (6,3) }
18
19. Statistics and Probability: Probability Theory
From “Event: Example 2”, we know the following:
A = { (1,1), (2,2), (3,3), (4,4), (5,5), (6,6) }
B = { (3,1), (3,2), (3,3), (3,4), (3,5), (3,6), (1,3), (2,3), (4,3), (5,3), (6,3) }
C = { (1,4), (2,3), (3,2), (4,1) }
A ∩ B = intersection of A and B
= { (3,3) }
A ∪ B ∪ C = union of A, B and C
= { (1,1), (2,2), (3,3), (4,4), (5,5), (6,6), (3,1), (3,2), (3,4), (3,5),
(3,6), (1,3), (2,3), (4,3), (5,3), (6,3) (1,4), (4,1) }
19
20. Statistics and Probability: Probability Theory
From “Event: Example 2”, we know the following:
A = { (1,1), (2,2), (3,3), (4,4), (5,5), (6,6) }
B = { (3,1), (3,2), (3,3), (3,4), (3,5), (3,6), (1,3), (2,3), (4,3), (5,3), (6,3) }
C = { (1,4), (2,3), (3,2), (4,1) }
A ∩ B ∩ C = intersection of A, B, C
= 𝜙
20
21. Statistics and Probability: Probability Theory
2. An engineering firm is hired to determine if certain
waterways in Visayas are safe for fishing. Samples are taken
from three rivers. Getting the sample space for the three rivers
where F means safe for fishing and N is not safe for fishing:
Ω = { FFF, NFF, FFN, NFN, NNN, FNF, FNN, NNF } – 8 sample pts.
Your task is to define an event Y in words that has the
following elements:
Y = { FFF, NFF, FFN, NFN }
21
22. Statistics and Probability: Probability Theory
SOLUTION:
Define an event Y in words that has the following sample points:
Y = { FFF, NFF, FFN, NFN }
To answer this question, we must ask this…
WHAT IS THE SIMILARITIES BETWEEN THE ELEMENTS OF Y???
Note that each element of Y has “F” as the characteristic of the
SECOND RIVER. “F” means that IT IS SAFE FOR FISHING. Hence,
Answer:
Y is the EVENT that the SECOND RIVER IS SAFE FOR FISHING!!!
22
23. Statistics and Probability: Probability Theory
“Two events A and B are mutually exclusive if and only
if A ∩ B = 𝜙, that is, A and B have no elements in
common.”
Example:
➢ A and 𝐴𝐶
➢ A ∩ B and A ∩ 𝐵𝐶
➢ A and B ∩ 𝐴𝐶
➢ A and 𝜙
23
25. Statistics and Probability: Probability Theory
Suppose that a family decided to leave Manila to spend their vacation in a
beach town. Let M be the event that they will experience mechanical
problems, T is the event that they will receive a ticket for committing a
traffic violation, and V is the event that they will arrive at a beach hotel
with no vacancies.
1. Referring to the Venn diagram below, state in words the events
represented by the following regions:
a. Region 5
b. Region 3
c. Region 1 and 2 together
d. Region 4 and 7 together
e. Region 3, 6, 7, and 8 together
25
26. Statistics and Probability: Probability Theory
a. Region 5
𝑻𝑪 ∩ 𝑽𝑪 ∩ 𝑴
The family will not
receive a ticket and will
not arrive at a beach
hotel with no vacancies
but will have a
mechanical problem.
26
27. Statistics and Probability: Probability Theory
b. Region 3
𝑻 ∩ 𝑽 ∩ 𝑴𝑪
The family will receive a
ticket and will arrive at a
beach hotel with no
vacancies but will not
have a mechanical
problem.
27
28. Statistics and Probability: Probability Theory
c. Region 1 and 2 together
𝑴 ∩ 𝑽
The family will have a
mechanical problem and
will arrive at a beach
hotel with no vacancies.
28
29. Statistics and Probability: Probability Theory
d. Region 4 and 7 together
𝑽𝑪 ∩ 𝑻
The family will not arrive
at a beach hotel with no
vacancies and will
receive a ticket for
committing a traffic
violation.
29
30. Statistics and Probability: Probability Theory
e. Region 3, 6, 7 and 8
together
𝑴𝑪
The family will not have a
mechanical problem.
30
31. Statistics and Probability: Probability Theory
2. Referring to the same Venn diagram, list the
numbers of the regions represented by the following
events:
a. The family will experience no mechanical
problem and will not receive a ticket for
violation but will arrive at a beach hotel with
no vacancies.
b. The family will experience both mechanical
problems and trouble in locating a hotel with
vacancy but will not receive a ticket for traffic
violation.
c. The family will either have mechanical trouble
or arrive at a beach hotel with no vacancies
but will not receive a ticket for traffic violation.
d. The family will not arrive at a beach hotel with
no vacancies.
31
32. Statistics and Probability: Probability Theory
a. The family will
experience no
mechanical problem
and will not receive a
ticket for violation
but will arrive at a
beach hotel with no
vacancies.
6
32
33. Statistics and Probability: Probability Theory
b. The family will
experience both
mechanical problems
and trouble in locating a
hotel with vacancy but
will not receive a ticket
for traffic violation.
2
33
34. Statistics and Probability: Probability Theory
c. The family will either
have mechanical trouble
or arrive at a beach hotel
with no vacancies but
will not receive a ticket
for traffic violation.
2, 5, 6
34
35. Statistics and Probability: Probability Theory
d. The family will not
arrive at a beach hotel
with no vacancies.
4, 5, 7, 8
35