THE HYDRONIUM ION
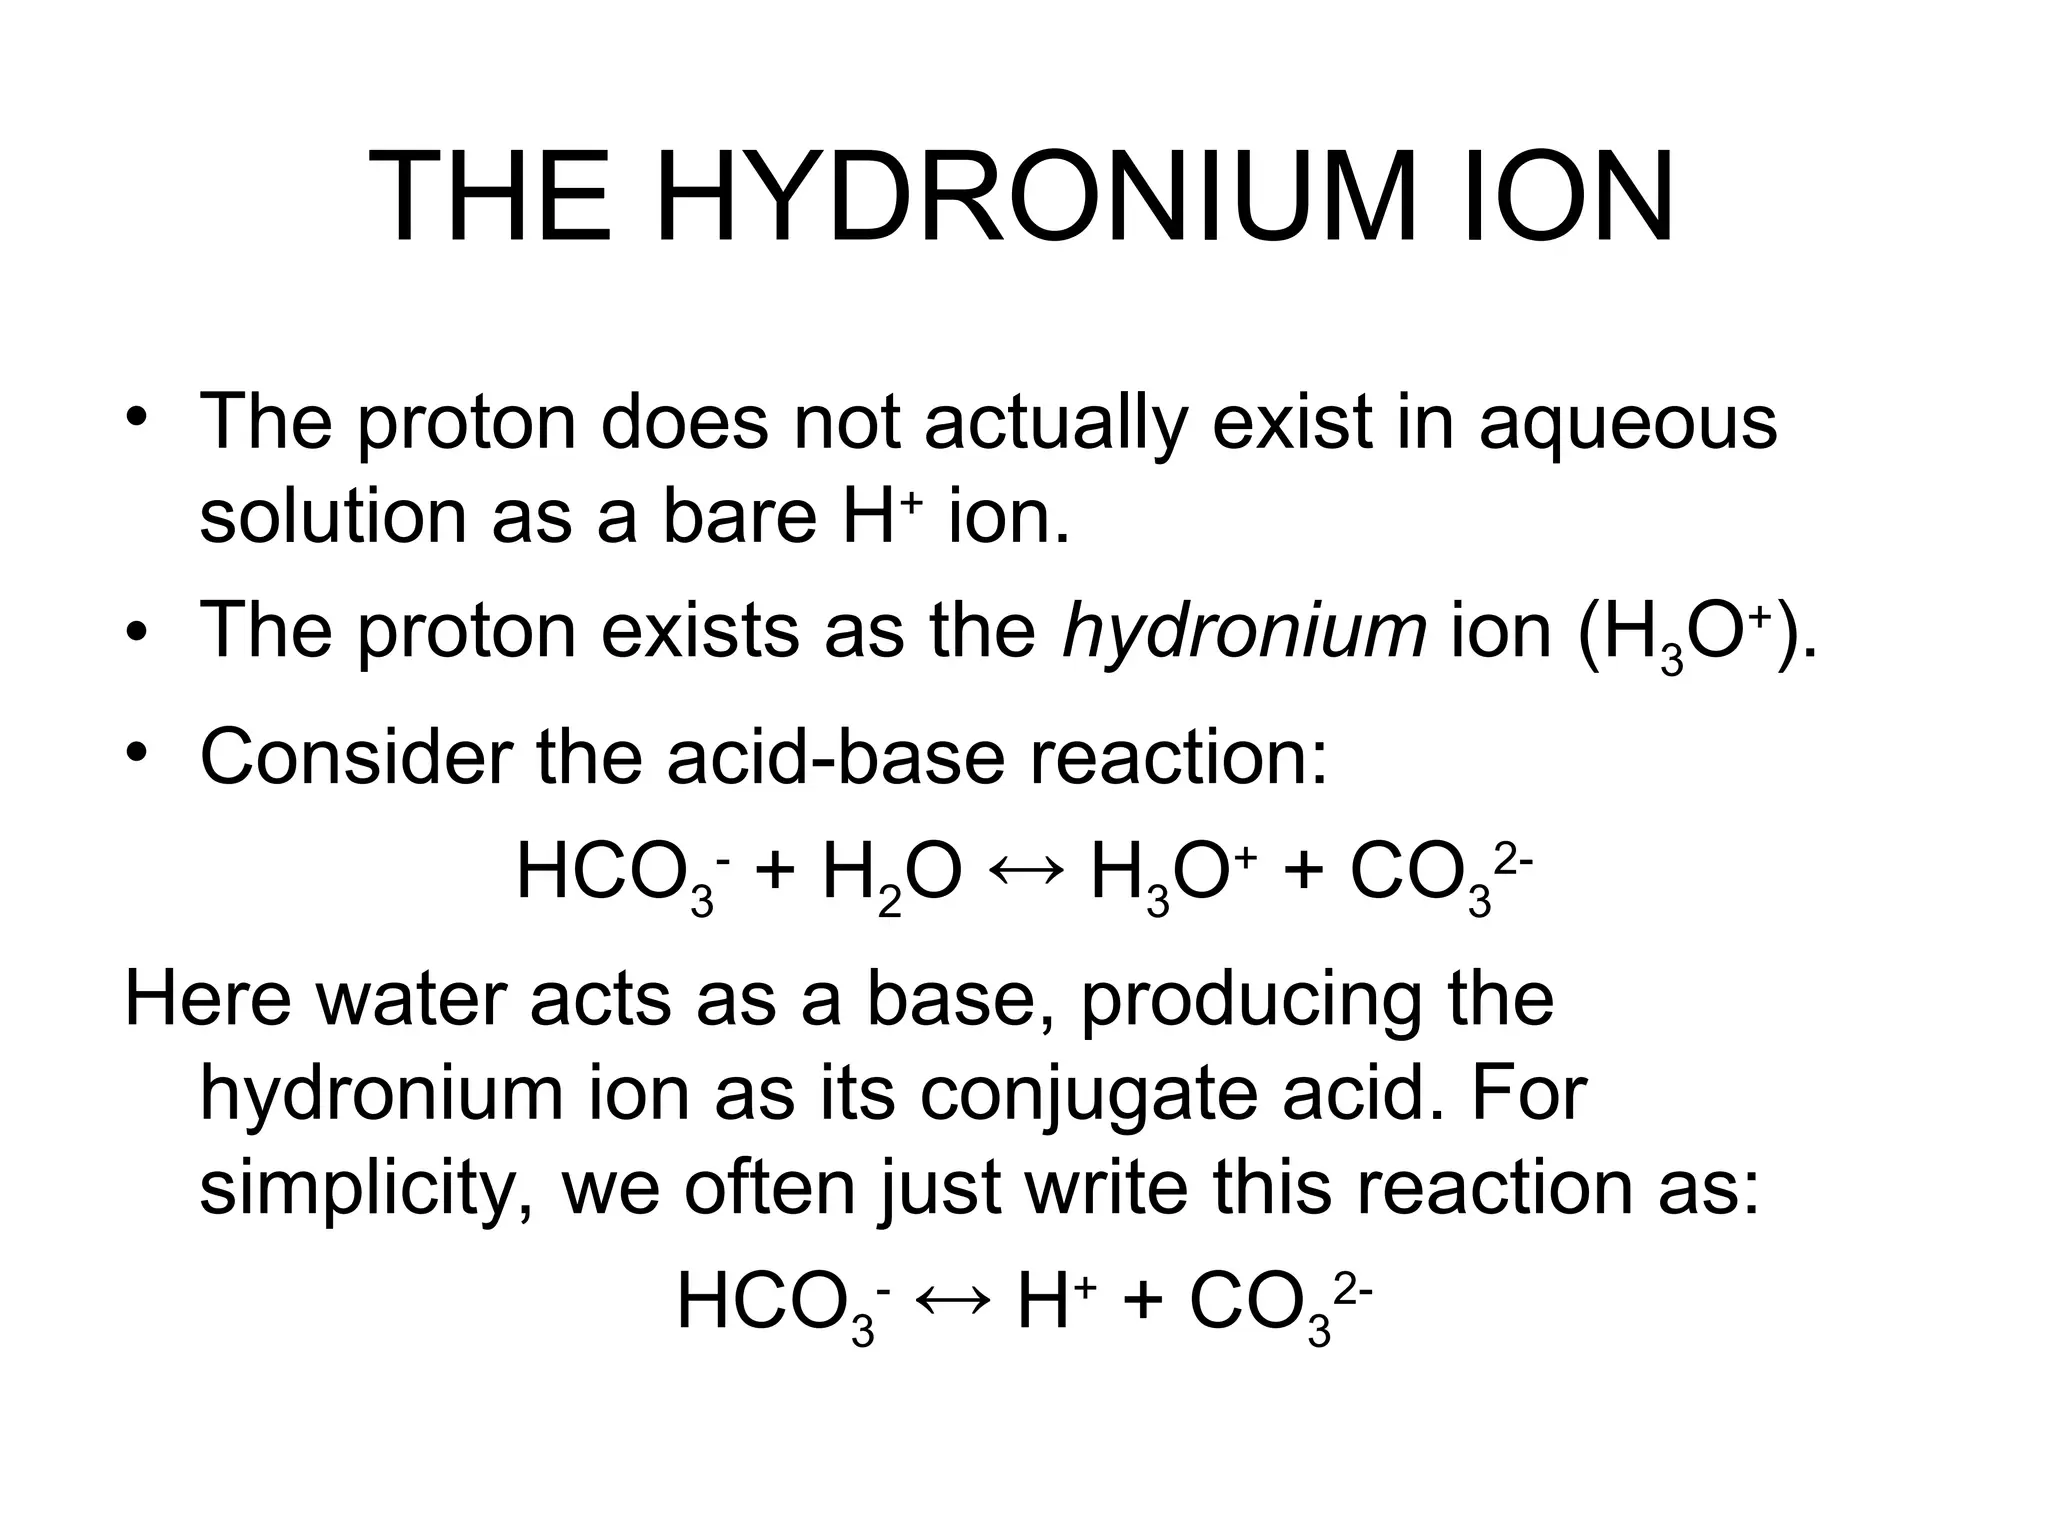
•The proton does not actually exist in aqueous
solution as a bare H+
ion.
• The proton exists as the hydronium ion (H3O+
).
• Consider the acid-base reaction:
HCO3
-
+ H2O H3O+
+ CO3
2-
Here water acts as a base, producing the
hydronium ion as its conjugate acid. For
simplicity, we often just write this reaction as:
HCO3
-
H+
+ CO3
2-
2.
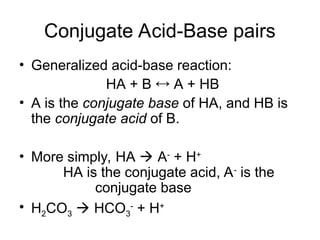
Conjugate Acid-Base pairs
•Generalized acid-base reaction:
HA + B A + HB
• A is the conjugate base of HA, and HB is
the conjugate acid of B.
• More simply, HA A-
+ H+
HA is the conjugate acid, A-
is the
conjugate base
• H2CO3 HCO3
-
+ H+
3.
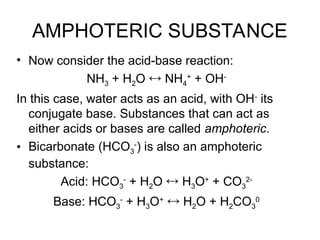
AMPHOTERIC SUBSTANCE
• Nowconsider the acid-base reaction:
NH3 + H2O NH4
+
+ OH-
In this case, water acts as an acid, with OH-
its
conjugate base. Substances that can act as
either acids or bases are called amphoteric.
• Bicarbonate (HCO3
-
) is also an amphoteric
substance:
Acid: HCO3
-
+ H2O H3O+
+ CO3
2-
Base: HCO3
-
+ H3O+
H2O + H2CO3
0
4.
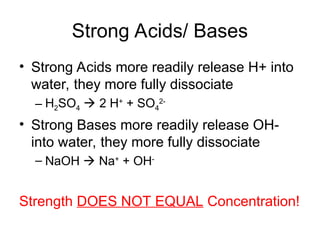
Strong Acids/ Bases
•Strong Acids more readily release H+ into
water, they more fully dissociate
– H2SO4 2 H+
+ SO4
2-
• Strong Bases more readily release OH-
into water, they more fully dissociate
– NaOH Na+
+ OH-
Strength DOES NOT EQUAL Concentration!
5.
Acid-base Dissociation
• Forany acid, describe it’s reaction in water:
– HxA + H2O x H+
+ A-
+ H2O
– Describe this as an equilibrium expression, K (often
denotes KA or KB for acids or bases…)
• Strength of an acid or base is then related to the
dissociation constant Big K, strong acid/base!
• pK = -log K as before, lower pK=stronger
acid/base!
]
[
]
][
[
A
H
H
A
K
x
x
6.
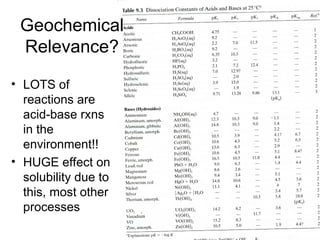
• LOTS of
reactionsare
acid-base rxns
in the
environment!!
• HUGE effect on
solubility due to
this, most other
processes
Geochemical
Relevance?
7.
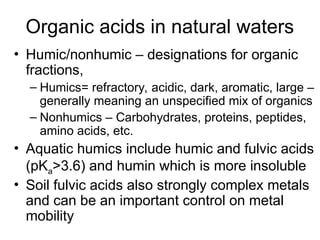
Organic acids innatural waters
• Humic/nonhumic – designations for organic
fractions,
– Humics= refractory, acidic, dark, aromatic, large –
generally meaning an unspecified mix of organics
– Nonhumics – Carbohydrates, proteins, peptides,
amino acids, etc.
• Aquatic humics include humic and fulvic acids
(pKa>3.6) and humin which is more insoluble
• Soil fulvic acids also strongly complex metals
and can be an important control on metal
mobility
8.
pH
• Commonly representedas a range between
0 and 14, and most natural waters are
between pH 4 and 9
• Remember that pH = - log [H+
]
– Can pH be negative?
– Of course! pH -3 [H+
]=103
= 1000 molal?
– But what’s ?? Turns out to be quite small
0.002 or so…
– How would you determine this??
9.
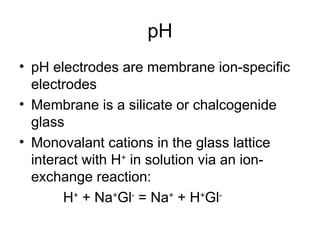
pH
• pH electrodesare membrane ion-specific
electrodes
• Membrane is a silicate or chalcogenide
glass
• Monovalant cations in the glass lattice
interact with H+
in solution via an ion-
exchange reaction:
H+
+ Na+
Gl-
= Na+
+ H+
Gl-
10.
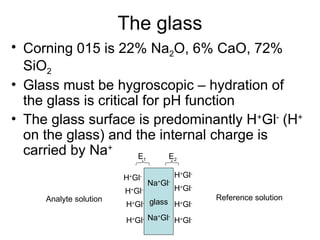
The glass
• Corning015 is 22% Na2O, 6% CaO, 72%
SiO2
• Glass must be hygroscopic – hydration of
the glass is critical for pH function
• The glass surface is predominantly H+
Gl-
(H+
on the glass) and the internal charge is
carried by Na+
glass
H+
Gl-
H+
Gl-
H+
Gl-
H+
Gl-
H+
Gl-
H+
Gl-
H+
Gl-
H+
Gl-
Na+
Gl-
Na+
Gl-
E1 E2
Analyte solution Reference solution
11.
pH = -log {H+
}; glass membrane electrode
pH electrode has different
H+
activity than the solution
SCE // {H+
}= a1 / glass membrane/ {H+
}= a2, [Cl-
] = 0.1 M, AgCl (sat’d) / Ag
ref#1 // external analyte solution / Eb=E1-E2 / ref#2
E1 E2
H+
gradient across the glass; Na+
is
the charge carrier at the internal
dry part of the membrane
soln glass soln glass
H+
+ Na+
Gl-
Na+
+ H+
Gl-
12.
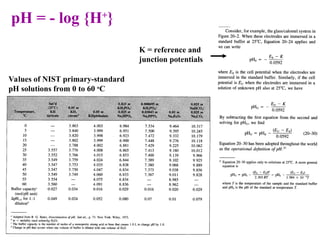
Values of NISTprimary-standard
pH solutions from 0 to 60 o
C
pH = - log {H+
}
K = reference and
junction potentials
13.
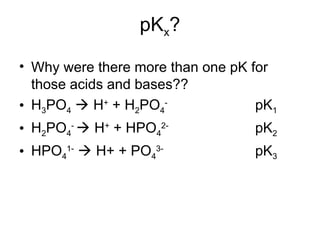
pKx?
• Why werethere more than one pK for
those acids and bases??
• H3PO4 H+
+ H2PO4
-
pK1
• H2PO4
-
H+
+ HPO4
2-
pK2
• HPO4
1-
H+ + PO4
3-
pK3
14.
BUFFERING
• When thepH is held ‘steady’ because of
the presence of a conjugate acid/base
pair, the system is said to be buffered
• In the environment, we must think about
more than just one conjugate acid/base
pairings in solution
• Many different acid/base pairs in solution,
minerals, gases, can act as buffers…
15.
Henderson-Hasselbach Equation:
• Whenacid or base added to buffered system
with a pH near pK (remember that when pH=pK
HA and A- are equal), the pH will not change
much
• When the pH is further from the pK, additions of
acid or base will change the pH a lot
]
[
]
[
log
HA
A
pK
pH
16.
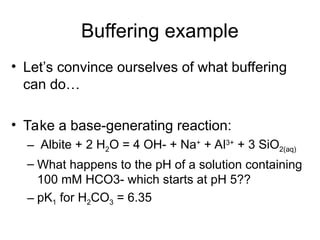
Buffering example
• Let’sconvince ourselves of what buffering
can do…
• Take a base-generating reaction:
– Albite + 2 H2O = 4 OH- + Na+
+ Al3+
+ 3 SiO2(aq)
– What happens to the pH of a solution containing
100 mM HCO3- which starts at pH 5??
– pK1 for H2CO3 = 6.35
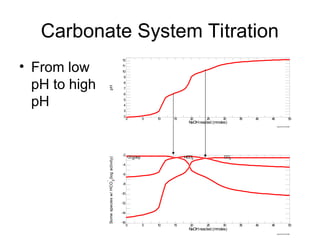
17.
• Think ofalbite dissolution as titrating OH-
into
solution – dissolve 0.05 mol albite = 0.2 mol OH-
• 0.2 mol OH- pOH = 0.7, pH = 13.3 ??
• What about the buffer??
– Write the pH changes via the Henderson-Hasselbach
equation
• 0.1 mol H2CO3(aq), as the pH increases, some of this
starts turning into HCO3-
• After 12.5 mmoles albite react (50 mmoles OH-):
– pH=6.35+log (HCO3-
/H2CO3) = 6.35+log(50/50)
• After 20 mmoles albite react (80 mmoles OH-
):
– pH=6.35+log(80/20) = 6.35 + 0.6 = 6.95
]
[
]
[
log
HA
A
pK
pH
Greg Mon Oct 11 2004
0 10 20 30 40 50 60 70 80 90 100
5
5.5
6
6.5
7
7.5
8
8.5
Albite reacted (mmoles)
pH
18.
Bjerrum Plots
• 2D plots of species activity (y axis) and
pH (x axis)
• Useful to look at how conjugate acid-base
pairs for many different species behave as
pH changes
• At pH=pK the activity of the conjugate acid
and base are equal
19.
pH
0 2 46 8 10 12 14
log
a
i
-12
-10
-8
-6
-4
-2
H2S0
HS-
S
2-
H+
OH
-
7.0 13.0
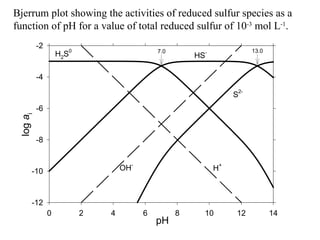
Bjerrum plot showing the activities of reduced sulfur species as a
function of pH for a value of total reduced sulfur of 10-3
mol L-1
.
20.
pH
0 2 46 8 10 12 14
log
a
i
-8
-7
-6
-5
-4
-3
-2
6.35 10.33
H2CO3* HCO3
-
CO3
2-
H+
OH-
Common pH
range in nature
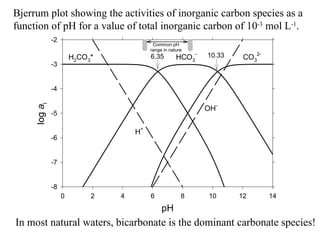
Bjerrum plot showing the activities of inorganic carbon species as a
function of pH for a value of total inorganic carbon of 10-3
mol L-1
.
In most natural waters, bicarbonate is the dominant carbonate species!
21.
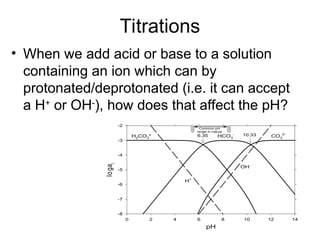
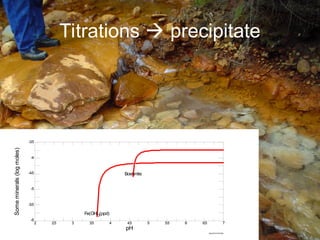
Titrations
• When weadd acid or base to a solution
containing an ion which can by
protonated/deprotonated (i.e. it can accept
a H+
or OH-
), how does that affect the pH?
pH
0 2 4 6 8 10 12 14
lo
g
a
i
-8
-7
-6
-5
-4
-3
-2
6.35 10.33
H2CO3* HCO3
-
CO3
2-
H+
OH
-
Common pH
range in nature
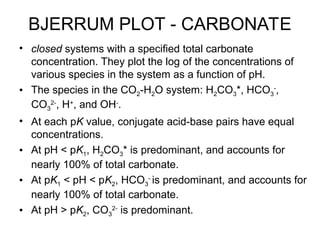
BJERRUM PLOT -CARBONATE
• closed systems with a specified total carbonate
concentration. They plot the log of the concentrations of
various species in the system as a function of pH.
• The species in the CO2-H2O system: H2CO3*, HCO3
-
,
CO3
2-
, H+
, and OH-
.
• At each pK value, conjugate acid-base pairs have equal
concentrations.
• At pH < pK1, H2CO3* is predominant, and accounts for
nearly 100% of total carbonate.
• At pK1 < pH < pK2, HCO3
-
is predominant, and accounts for
nearly 100% of total carbonate.
• At pH > pK2, CO3
2-
is predominant.
25.
pH
0 2 46 8 10 12 14
log
a
i
-8
-7
-6
-5
-4
-3
-2
6.35 10.33
H2CO3* HCO3
-
CO3
2-
H+
OH-
Common pH
range in nature
Bjerrum plot showing the activities of inorganic carbon species as a
function of pH for a value of total inorganic carbon of 10-3
mol L-1
.
In most natural waters, bicarbonate is the dominant carbonate species!
Editor's Notes
#1 Bare protons do not exist in aqueous solutions. The H+ ion, being quite small, has a strong tendency to attract the negative end of polar water molecules to it; in other words, the proton is strongly hydrated (see lecture 1). We often write the hydrated proton as the hydronium ion, H3O+. In fact, the proton is almost certainly hydrated by more than one water molecule, and it might be more appropriate to write the hydrated proton with four water molecules, e.g., H9O4+, or perhaps even a larger number of waters of hydration. However, as long as we keep the hydration of the proton in mind, it is permissible to write reactions in terms of H+ for simplicity. From a thermodynamic point of view, it does not matter whether H+ is hydrated or not, because thermodynamics deals only with macroscopic properties. On the other hand, the hydration of the proton needs to be taken into account when considering reaction mechanisms or kinetics.
#3 Some substances can either donate or accept a proton, depending on the pH of the solution. Such substances are termed amphoteric. If pH is low (i.e., the activity of H+ is high), an amphoteric substance will act as a base and accept a proton. However, if pH is high (i.e., H+ ions are scarce), an amphoteric substance will act as an acid and donate a proton. Examples of amphoteric substances include H2O and HCO3- as shown above, as well as HSO4-, H2PO4-, HPO42-, etc.
Acid: HSO4- SO42- + H+
Base: HSO4- + H+ H2SO40
Acid: H2PO4- HPO42- + H+
Base: H2PO4- + H+ H3PO40
Acid: HPO42- PO43- + H+
Base: HPO42- + H+ H2PO4-
#19 In slide 8 we saw that, in the pH range of most natural waters, bicarbonate was the predominant species in the CO2-H2O system. In this slide, we see that the predominant species in the H2S-H2O system over the pH range of most natural waters is H2S0 (pH < 7.0) or HS- (pH > 7.0). This diagram can be constructed in exactly the same way as outlined for the previous diagram. Note that, as expected, the positions of the lines representing the concentrations of H+ and OH- have not changed.
#20 Although Bjerrum plots can be constructed rigorously by solving the combined mass-action and mass-balance expressions in the system for the concentrations of each of the species, there is a faster, approximate route to the construction of these diagrams. Once the total carbonate concentration (CT) is chosen and the pK values are known, the first step is to plot points with pH coordinates equal to the pK values, and concentration coordinates equal to log CT - 0.301. At pH = pK, the concentrations of two species are equal, and therefore equal to CT/2, the log of which is log CT - 0.301. For example, at pH = pK1 = 6.35, the concentrations of H2CO3* and HCO3- are equal to one another and to CT/2. Likewise, at pH = pK2 = 10.33, the concentrations of HCO3- and CO32- are equal to one another and to CT/2. The points where species concentrations are equal are called cross-over points. At pH < pK1 = 6.35, H2CO3* accounts for more than 99% of CT, so the concentration of H2CO3* plots as a horizontal line with a Y-intercept of log CT. As pH nears pK1, the line must bend down to intersect the HCO3- line at the first cross-over point. The HCO3- line extends from the first cross-over point towards lower pH with a slope of +1. At pK1 < pH < pK2, HCO3- accounts for the bulk of CT, so its concentration now plots as a horizontal line. In this pH range, the H2CO3* line descends away from the cross-over point towards higher pH with a slope of -1. As pH approaches pK2, the HCO3- line drops down to the second cross-over point. At pH > pK2, CO32- is the predominant species, so its concentration now plots as a horizontal line at log CT, and the HCO3- line descends from the second cross-over point towards higher pH with a slope of -1. In the range pH > pK2, the H2CO3* line now descends towards higher pH with a slope of -2. As the CO32- line passes through the second cross-over point towards lower pH into the region where pK1 < pH < pK2, it descends with a slope of +1. When this same line crosses under the first cross-over point into the region where pH < pK1, its slope changes to +2.
#24 A Bjerrum plot shows the relative importance of the various species in an acid-base system under closed conditions (i.e., the total concentration of all species is constant). For example, for the CO2-H2O system, a Bjerrum plot shows the concentrations of H2CO3*, HCO3-, CO32-, H+, and OH-, under the condition that the sum of the concentrations of H2CO3*, HCO3- and CO32- is constant. The Bjerrum plot is constructed based partially on the concepts discussed in slide 6. That is: 1) At each pK value, conjugate acid-base pairs have equal concentrations; 2) At pH < pK1, H2CO3* is predominant, and accounts for nearly 100% of total carbonate; 3) At pK1 < pH < pK2, HCO3- is predominant, and accounts for nearly 100% of total carbonate; and 4) At pH > pK2, CO32- is predominant. The Bjerrum plot is also constructed assuming that activity coefficients can be neglected. When pH < pK1, and H2CO3* is predominant, the concentrations/activities of the other carbonate species can be derived by rearranging the mass-action expressions for the dissociation reactions, and the mass-balance constraint that the sum of the concentrations of H2CO3*, HCO3- and CO32- is constant. For example, rearranging the equation given in the notes to slide 6 yields:
log aHCO3- = pH - pK1 + log aH2CO3*
At pH < pK1, the concentration of H2CO3* is approximately equal to the total concentration of all carbonate species, and is hence, approximately constant. Thus, the equation shows that, at pH < pK1, the concentration of bicarbonate increases one log unit for each unit increase in pH. Similar equations can be derived for all the carbonate species in each of the pH ranges of the diagram. For more details, consult Faure (1998) Principles and Applications of Geochemistry, Prentice-Hall (Chapter 9, pp. 123-124).
#25 Although Bjerrum plots can be constructed rigorously by solving the combined mass-action and mass-balance expressions in the system for the concentrations of each of the species, there is a faster, approximate route to the construction of these diagrams. Once the total carbonate concentration (CT) is chosen and the pK values are known, the first step is to plot points with pH coordinates equal to the pK values, and concentration coordinates equal to log CT - 0.301. At pH = pK, the concentrations of two species are equal, and therefore equal to CT/2, the log of which is log CT - 0.301. For example, at pH = pK1 = 6.35, the concentrations of H2CO3* and HCO3- are equal to one another and to CT/2. Likewise, at pH = pK2 = 10.33, the concentrations of HCO3- and CO32- are equal to one another and to CT/2. The points where species concentrations are equal are called cross-over points. At pH < pK1 = 6.35, H2CO3* accounts for more than 99% of CT, so the concentration of H2CO3* plots as a horizontal line with a Y-intercept of log CT. As pH nears pK1, the line must bend down to intersect the HCO3- line at the first cross-over point. The HCO3- line extends from the first cross-over point towards lower pH with a slope of +1. At pK1 < pH < pK2, HCO3- accounts for the bulk of CT, so its concentration now plots as a horizontal line. In this pH range, the H2CO3* line descends away from the cross-over point towards higher pH with a slope of -1. As pH approaches pK2, the HCO3- line drops down to the second cross-over point. At pH > pK2, CO32- is the predominant species, so its concentration now plots as a horizontal line at log CT, and the HCO3- line descends from the second cross-over point towards higher pH with a slope of -1. In the range pH > pK2, the H2CO3* line now descends towards higher pH with a slope of -2. As the CO32- line passes through the second cross-over point towards lower pH into the region where pK1 < pH < pK2, it descends with a slope of +1. When this same line crosses under the first cross-over point into the region where pH < pK1, its slope changes to +2.

![Acid-base Dissociation
• For any acid, describe it’s reaction in water:
– HxA + H2O x H+
+ A-
+ H2O
– Describe this as an equilibrium expression, K (often
denotes KA or KB for acids or bases…)
• Strength of an acid or base is then related to the
dissociation constant Big K, strong acid/base!
• pK = -log K as before, lower pK=stronger
acid/base!
]
[
]
][
[
A
H
H
A
K
x
x
](https://image.slidesharecdn.com/lecture7-acid-basechemistry-250511082711-5c9e47b4/85/Lecture-7-Acid-base-chemistry-science-5-320.jpg)
![pH
• Commonly represented as a range between
0 and 14, and most natural waters are
between pH 4 and 9
• Remember that pH = - log [H+
]
– Can pH be negative?
– Of course! pH -3 [H+
]=103
= 1000 molal?
– But what’s ?? Turns out to be quite small
0.002 or so…
– How would you determine this??](https://image.slidesharecdn.com/lecture7-acid-basechemistry-250511082711-5c9e47b4/85/Lecture-7-Acid-base-chemistry-science-8-320.jpg)
![pH = - log {H+
}; glass membrane electrode
pH electrode has different
H+
activity than the solution
SCE // {H+
}= a1 / glass membrane/ {H+
}= a2, [Cl-
] = 0.1 M, AgCl (sat’d) / Ag
ref#1 // external analyte solution / Eb=E1-E2 / ref#2
E1 E2
H+
gradient across the glass; Na+
is
the charge carrier at the internal
dry part of the membrane
soln glass soln glass
H+
+ Na+
Gl-
Na+
+ H+
Gl-](https://image.slidesharecdn.com/lecture7-acid-basechemistry-250511082711-5c9e47b4/85/Lecture-7-Acid-base-chemistry-science-11-320.jpg)
![Henderson-Hasselbach Equation:
• When acid or base added to buffered system
with a pH near pK (remember that when pH=pK
HA and A- are equal), the pH will not change
much
• When the pH is further from the pK, additions of
acid or base will change the pH a lot
]
[
]
[
log
HA
A
pK
pH
](https://image.slidesharecdn.com/lecture7-acid-basechemistry-250511082711-5c9e47b4/85/Lecture-7-Acid-base-chemistry-science-15-320.jpg)
![• Think of albite dissolution as titrating OH-
into
solution – dissolve 0.05 mol albite = 0.2 mol OH-
• 0.2 mol OH- pOH = 0.7, pH = 13.3 ??
• What about the buffer??
– Write the pH changes via the Henderson-Hasselbach
equation
• 0.1 mol H2CO3(aq), as the pH increases, some of this
starts turning into HCO3-
• After 12.5 mmoles albite react (50 mmoles OH-):
– pH=6.35+log (HCO3-
/H2CO3) = 6.35+log(50/50)
• After 20 mmoles albite react (80 mmoles OH-
):
– pH=6.35+log(80/20) = 6.35 + 0.6 = 6.95
]
[
]
[
log
HA
A
pK
pH
Greg Mon Oct 11 2004
0 10 20 30 40 50 60 70 80 90 100
5
5.5
6
6.5
7
7.5
8
8.5
Albite reacted (mmoles)
pH](https://image.slidesharecdn.com/lecture7-acid-basechemistry-250511082711-5c9e47b4/85/Lecture-7-Acid-base-chemistry-science-17-320.jpg)