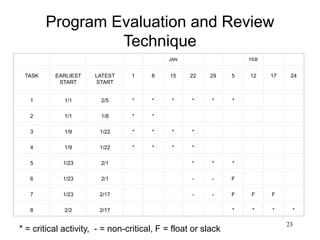
1
Project Scheduling and
Tracking
CIS 375
Bruce R. Maxim
UM-Dearborn
2
What does the customer want to
know?
• Do you understand my needs?
• Can you design a system to help me?
• How long will it take?
• How much will it cost?
3
Scheduling Principles - 1
• Compartmentalization
– the product and process must be decomposed
into a manageable number of activities and tasks
• Interdependency
– tasks that can be completed in parallel must be
separated from those that must completed serially
• Time allocation
– every task has start and completion dates that
take the task interdependencies into account
4
Scheduling Principles - 2
• Effort validation
– project manager must ensure that on any
given day there are enough staff members
assigned to completed the tasks within the
time estimated in the project plan
• Defined Responsibilities
– every scheduled task needs to be assigned
to a specific team member
5
Scheduling Principles - 3
• Defined outcomes
– every task in the schedule needs to have a
defined outcome (usually a work product or
deliverable)
• Defined milestones
– a milestone is accomplished when one or
more work products from an engineering
task have passed quality review
6
Step 1
List the Deliverables
• Documents.
• Demonstration of function.
• Demonstration of subsystem.
• Demonstration of accuracy.
• Demonstration of reliability, security, or
speed.
7
Step 2
Define the Milestones
• Completion of an activity or deliverable
(must be measurable).
• Activities must have definite a start and
stop.
• A milestone is point in time not a time
period like an activity.
8
Step 3
Work Breakdown Structure
• Create the work breakdown structure
• Separate the project into phases
composed of steps
• Subdivide steps into activities as
needed
9
Project Effort Distribution
Generally accepted guidelines are:
02-03 % planning
10-25 % requirements analysis
20-25 % design
15-20 % coding
30-40 % testing and debugging
10
Defining a Task Set
• Consider project type.
• Degree of rigor.
• Review rigor adaptation criteria.
• Determine task selector value.
• Consider concept development tasks.
11
Software Project Types - 1
• Concept development
– initiated to explore new business concept or new
application of technology
• New application development
– new product requested by customer
• Application enhancement
– major modifications to function, performance, or
interfaces (observable to user)
12
Software Project Types - 2
• Application maintenance
– correcting, adapting, or extending existing
software (not immediately obvious to user)
• Reengineering
– rebuilding all (or part) of a legacy system
13
Software Process Degree of
Rigor - 1
• Casual
– all framework activities applied, only
minimum task set required (umbrella
activities minimized and documentation
reduced)
• Structured
– all framework and umbrella activities
applied (SQA, SCM, documentation, and
measurement tasks are streamlined)
14
Software Process Degree of
Rigor - 2
• Strict
– full process and umbrella activities applied (high
quality products and robust documentation
produced)
• Quick reaction
– emergency situation, process framework used, but
only tasks essential to good quality are applied
(back filling used to develop documentation and
conduct additional reviews after product is
delivered)
15
Rigor Adaptation Criteria
• Size of project
• Number of potential
users
• Mission criticality
• Application longevity
• Requirement stability
• Ease of
customer/developer
communication
• Maturity of
applicable
technology
• Performance
constraints
• Embedded/non-
embedded
characteristics
• Project staffing
• Reengineering factors
16
Task Selector Value
• Computed by scoring rigor adaptation criteria
and adjusting the scores using differential
weighting based on project characteristics.
• Once computed the task selector value can
be used to select the appropriate task set
(casual, structured, strict) for the project.
• It is OK to choose a less formal degree of
rigor when the task selector value falls in the
overlap area between two levels of rigor,
unless project risk is high.
17
Concept Development Tasks -1
• Concept scoping
– determine overall project scope
• Preliminary concept planning
– establishes development team's ability to
undertake the proposed work
• Technology risk assessment
– evaluates the risk associated with the
technology implied by the software scope
18
Concept Development Tasks - 2
• Proof of concept
– demonstrates the feasibility of the technology in
the software context
• Concept implementation
– concept represented in a form that can be used to
sell it to the customer
• Customer reaction to concept
– solicits feedback on new technology from
customer
19
Activity Graph
Each activity has:
1. Precursor
2. Duration
3. Due date
4. End point
(milestone or
deliverable)
20
CPM
Critical Path Method
21
Activity Precursor Duration EST EFT LST LFT Slack
Start - 0 0 0 0 0 0
A Start 2 0 2 0 2 0
B Start 3 0 3 4 7 4
C A 5 2 7 2 7 0
D A,B 4 3 7 7 11 4
E D 2 7 9 11 13 4
F B,C 6 7 13 7 13 0
FINISH E,F 0 13 13 13 13 0
EST = earliest start time, EFT = earliest finish time.
LST = latest start time, LFT = latest finish time.
Slack = (LST - EST) or (LFT - EFT).
22
CPM Equations
EST(START) always = 0, EFT(START) always = 0.
LST(START) always = 0, LFT(START) always = 0.
EFT(I) = EST(I) + DUR(I).
EST(I) = max(EFT of all predecessors).
LST(I) = LFT(I) - DUR(I).
LFT(I) = min(LST of all sucessors).
LFT(FINISH) = LST(FINISH) = EST(FINISH) = EFT(FINISH).
Critical path is all nodes with Slack = 0.
23
Program Evaluation and Review
Technique
JAN FEB
TASK EARLIEST
START
LATEST
START
1 8 15 22 29 5 12 17 24
1 1/1 2/5 * * * * * *
2 1/1 1/8 * *
3 1/9 1/22 * * * *
4 1/9 1/22 * * * *
5 1/23 2/1 * * *
6 1/23 2/1 - - F
7 1/23 2/17 - - F F F
8 2/2 2/17 * * * *
* = critical activity, - = non-critical, F = float or slack
24
Gantt Chart
25
Overlay Resources on Gantt
Chart
26
Milestone Chart
27
Line Graph
28
People and Effort
• Adding people to a project after it is behind schedule
often causes the schedule to slip further
• The relationship between the number of people on a
project and overall productivity is not linear (e.g. 3
people do not produce 3 times the work of 1 person,
if the people have to work in cooperation with one
another)
• The main reasons for using more than 1 person on a
project are to get the job done more rapidly and to
improve software quality.
29
Earned Value Analysis
• Earned value is a quantitative measure
of percent of project completed so far.
• The total hours to complete the entire
project are estimated and each task is
given an earned value based on its
estimated percentage contribution to the
total.
30
Error Tracking
• Allows comparison of current work to
past projects and provides a
quantitative indication of the quality of
the work being conducted.
• The more quantitative the approach to
project tracking and control, the more
likely problems can be anticipated and
dealt with in a proactive manner.

lec11.ppt

  • 1.
    1 Project Scheduling and Tracking CIS375 Bruce R. Maxim UM-Dearborn
  • 2.
    2 What does thecustomer want to know? • Do you understand my needs? • Can you design a system to help me? • How long will it take? • How much will it cost?
  • 3.
    3 Scheduling Principles -1 • Compartmentalization – the product and process must be decomposed into a manageable number of activities and tasks • Interdependency – tasks that can be completed in parallel must be separated from those that must completed serially • Time allocation – every task has start and completion dates that take the task interdependencies into account
  • 4.
    4 Scheduling Principles -2 • Effort validation – project manager must ensure that on any given day there are enough staff members assigned to completed the tasks within the time estimated in the project plan • Defined Responsibilities – every scheduled task needs to be assigned to a specific team member
  • 5.
    5 Scheduling Principles -3 • Defined outcomes – every task in the schedule needs to have a defined outcome (usually a work product or deliverable) • Defined milestones – a milestone is accomplished when one or more work products from an engineering task have passed quality review
  • 6.
    6 Step 1 List theDeliverables • Documents. • Demonstration of function. • Demonstration of subsystem. • Demonstration of accuracy. • Demonstration of reliability, security, or speed.
  • 7.
    7 Step 2 Define theMilestones • Completion of an activity or deliverable (must be measurable). • Activities must have definite a start and stop. • A milestone is point in time not a time period like an activity.
  • 8.
    8 Step 3 Work BreakdownStructure • Create the work breakdown structure • Separate the project into phases composed of steps • Subdivide steps into activities as needed
  • 9.
    9 Project Effort Distribution Generallyaccepted guidelines are: 02-03 % planning 10-25 % requirements analysis 20-25 % design 15-20 % coding 30-40 % testing and debugging
  • 10.
    10 Defining a TaskSet • Consider project type. • Degree of rigor. • Review rigor adaptation criteria. • Determine task selector value. • Consider concept development tasks.
  • 11.
    11 Software Project Types- 1 • Concept development – initiated to explore new business concept or new application of technology • New application development – new product requested by customer • Application enhancement – major modifications to function, performance, or interfaces (observable to user)
  • 12.
    12 Software Project Types- 2 • Application maintenance – correcting, adapting, or extending existing software (not immediately obvious to user) • Reengineering – rebuilding all (or part) of a legacy system
  • 13.
    13 Software Process Degreeof Rigor - 1 • Casual – all framework activities applied, only minimum task set required (umbrella activities minimized and documentation reduced) • Structured – all framework and umbrella activities applied (SQA, SCM, documentation, and measurement tasks are streamlined)
  • 14.
    14 Software Process Degreeof Rigor - 2 • Strict – full process and umbrella activities applied (high quality products and robust documentation produced) • Quick reaction – emergency situation, process framework used, but only tasks essential to good quality are applied (back filling used to develop documentation and conduct additional reviews after product is delivered)
  • 15.
    15 Rigor Adaptation Criteria •Size of project • Number of potential users • Mission criticality • Application longevity • Requirement stability • Ease of customer/developer communication • Maturity of applicable technology • Performance constraints • Embedded/non- embedded characteristics • Project staffing • Reengineering factors
  • 16.
    16 Task Selector Value •Computed by scoring rigor adaptation criteria and adjusting the scores using differential weighting based on project characteristics. • Once computed the task selector value can be used to select the appropriate task set (casual, structured, strict) for the project. • It is OK to choose a less formal degree of rigor when the task selector value falls in the overlap area between two levels of rigor, unless project risk is high.
  • 17.
    17 Concept Development Tasks-1 • Concept scoping – determine overall project scope • Preliminary concept planning – establishes development team's ability to undertake the proposed work • Technology risk assessment – evaluates the risk associated with the technology implied by the software scope
  • 18.
    18 Concept Development Tasks- 2 • Proof of concept – demonstrates the feasibility of the technology in the software context • Concept implementation – concept represented in a form that can be used to sell it to the customer • Customer reaction to concept – solicits feedback on new technology from customer
  • 19.
    19 Activity Graph Each activityhas: 1. Precursor 2. Duration 3. Due date 4. End point (milestone or deliverable)
  • 20.
  • 21.
    21 Activity Precursor DurationEST EFT LST LFT Slack Start - 0 0 0 0 0 0 A Start 2 0 2 0 2 0 B Start 3 0 3 4 7 4 C A 5 2 7 2 7 0 D A,B 4 3 7 7 11 4 E D 2 7 9 11 13 4 F B,C 6 7 13 7 13 0 FINISH E,F 0 13 13 13 13 0 EST = earliest start time, EFT = earliest finish time. LST = latest start time, LFT = latest finish time. Slack = (LST - EST) or (LFT - EFT).
  • 22.
    22 CPM Equations EST(START) always= 0, EFT(START) always = 0. LST(START) always = 0, LFT(START) always = 0. EFT(I) = EST(I) + DUR(I). EST(I) = max(EFT of all predecessors). LST(I) = LFT(I) - DUR(I). LFT(I) = min(LST of all sucessors). LFT(FINISH) = LST(FINISH) = EST(FINISH) = EFT(FINISH). Critical path is all nodes with Slack = 0.
  • 23.
    23 Program Evaluation andReview Technique JAN FEB TASK EARLIEST START LATEST START 1 8 15 22 29 5 12 17 24 1 1/1 2/5 * * * * * * 2 1/1 1/8 * * 3 1/9 1/22 * * * * 4 1/9 1/22 * * * * 5 1/23 2/1 * * * 6 1/23 2/1 - - F 7 1/23 2/17 - - F F F 8 2/2 2/17 * * * * * = critical activity, - = non-critical, F = float or slack
  • 24.
  • 25.
  • 26.
  • 27.
  • 28.
    28 People and Effort •Adding people to a project after it is behind schedule often causes the schedule to slip further • The relationship between the number of people on a project and overall productivity is not linear (e.g. 3 people do not produce 3 times the work of 1 person, if the people have to work in cooperation with one another) • The main reasons for using more than 1 person on a project are to get the job done more rapidly and to improve software quality.
  • 29.
    29 Earned Value Analysis •Earned value is a quantitative measure of percent of project completed so far. • The total hours to complete the entire project are estimated and each task is given an earned value based on its estimated percentage contribution to the total.
  • 30.
    30 Error Tracking • Allowscomparison of current work to past projects and provides a quantitative indication of the quality of the work being conducted. • The more quantitative the approach to project tracking and control, the more likely problems can be anticipated and dealt with in a proactive manner.