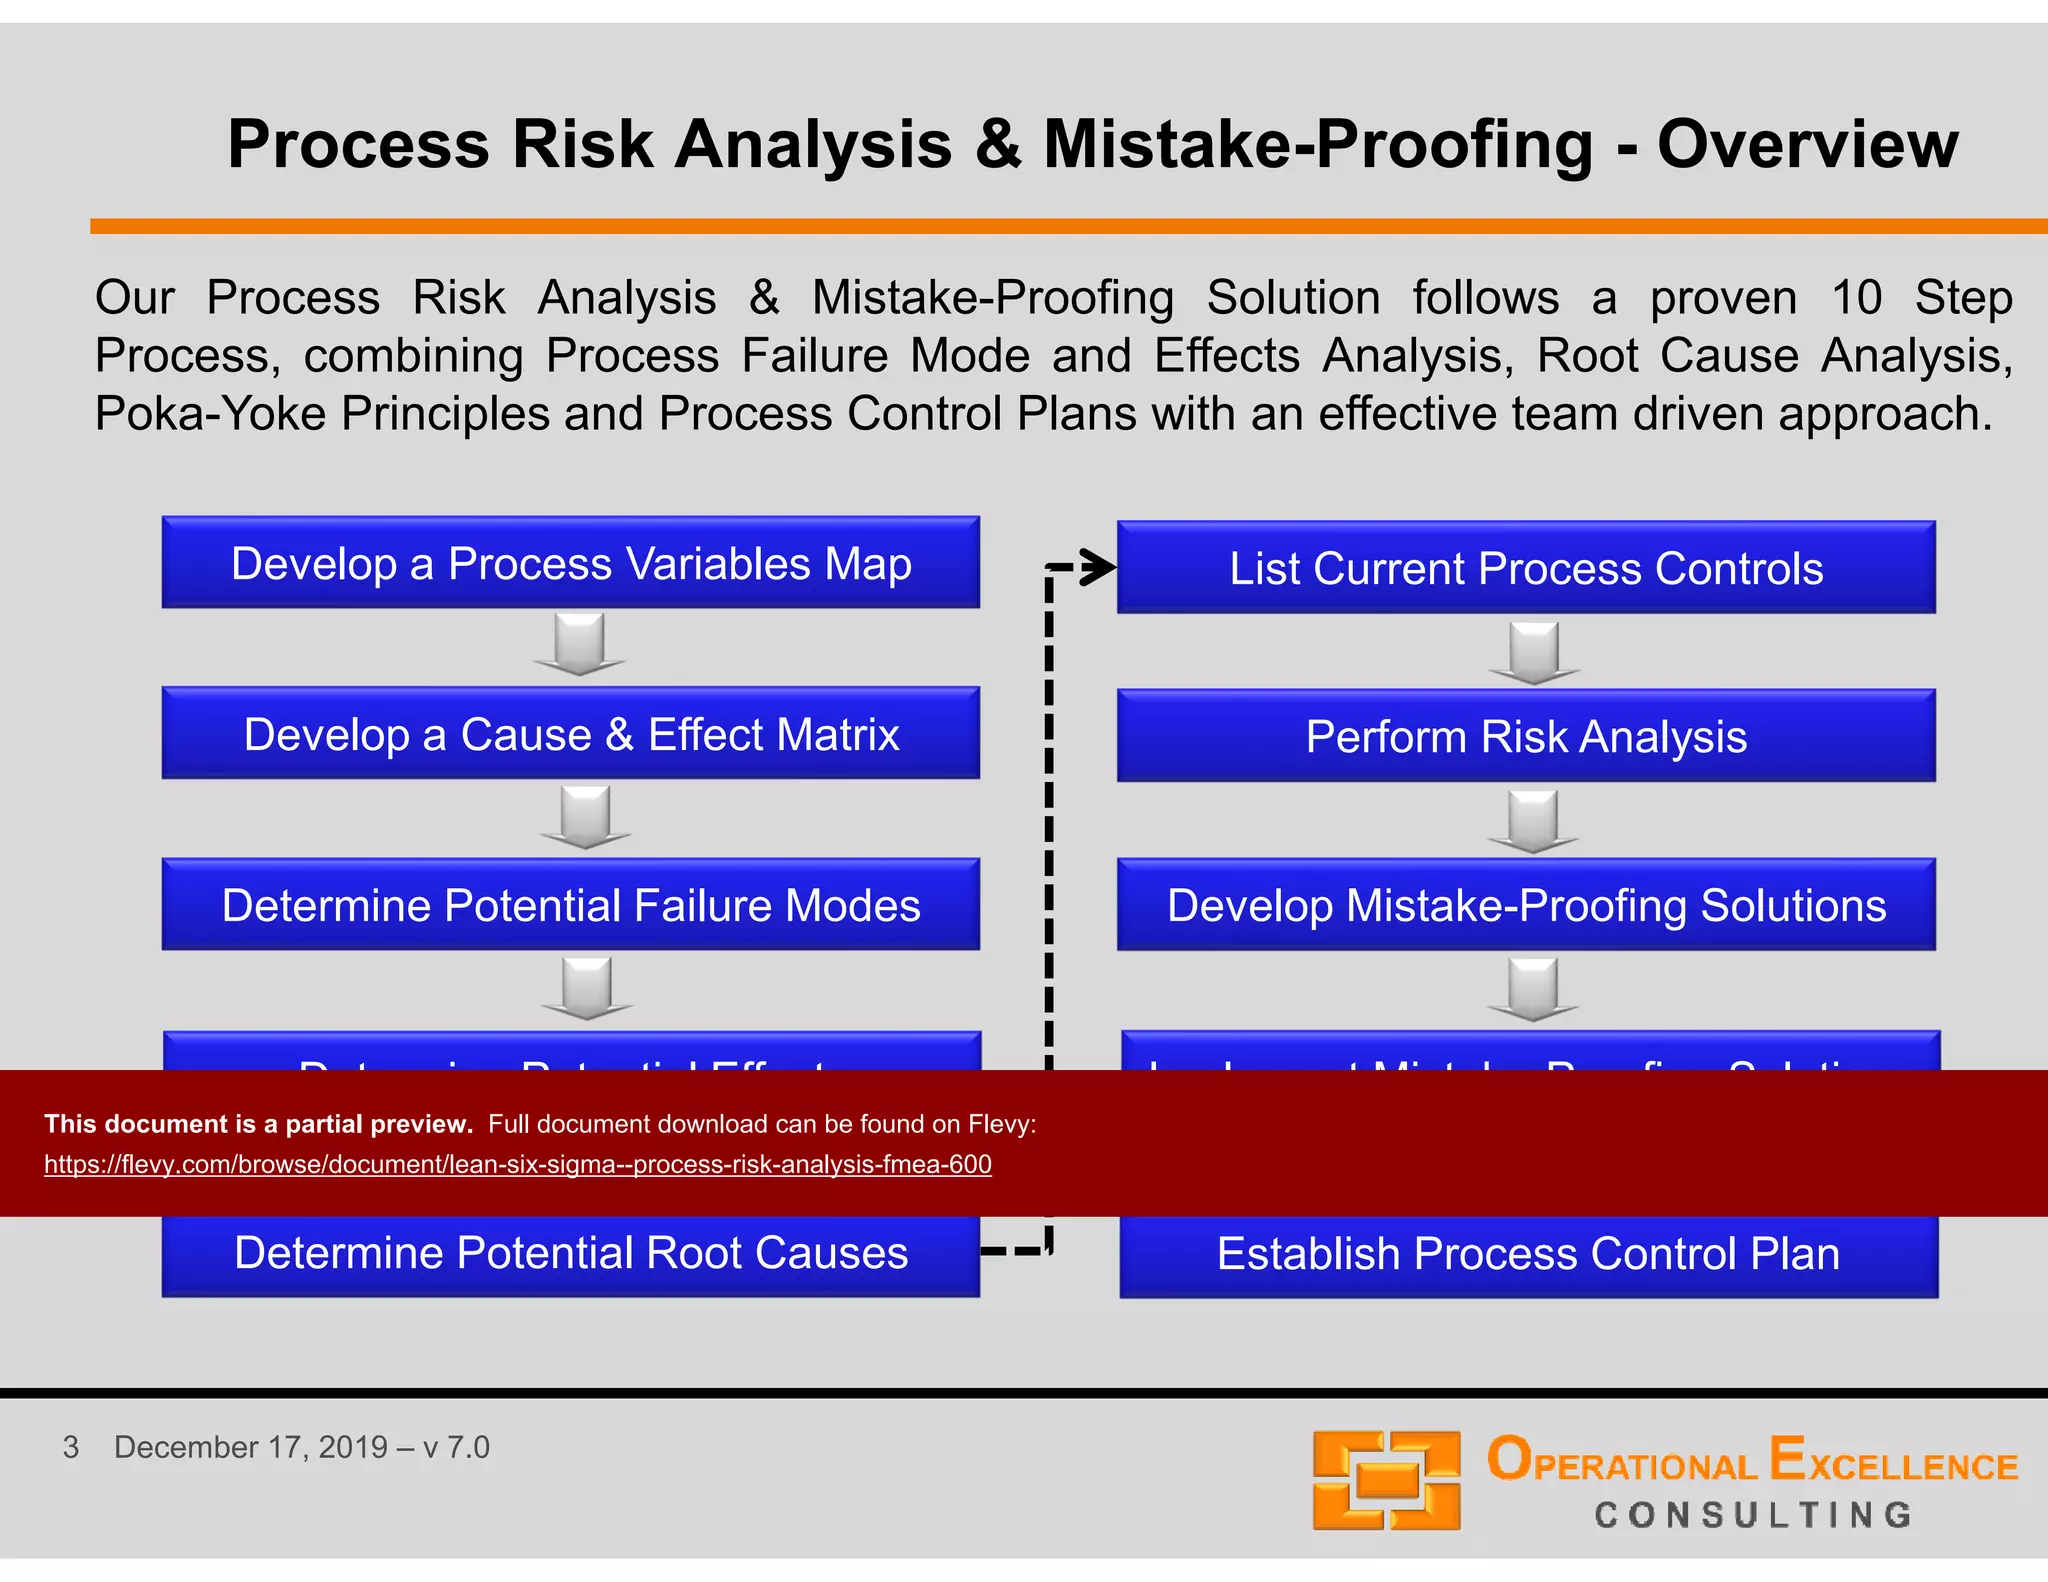
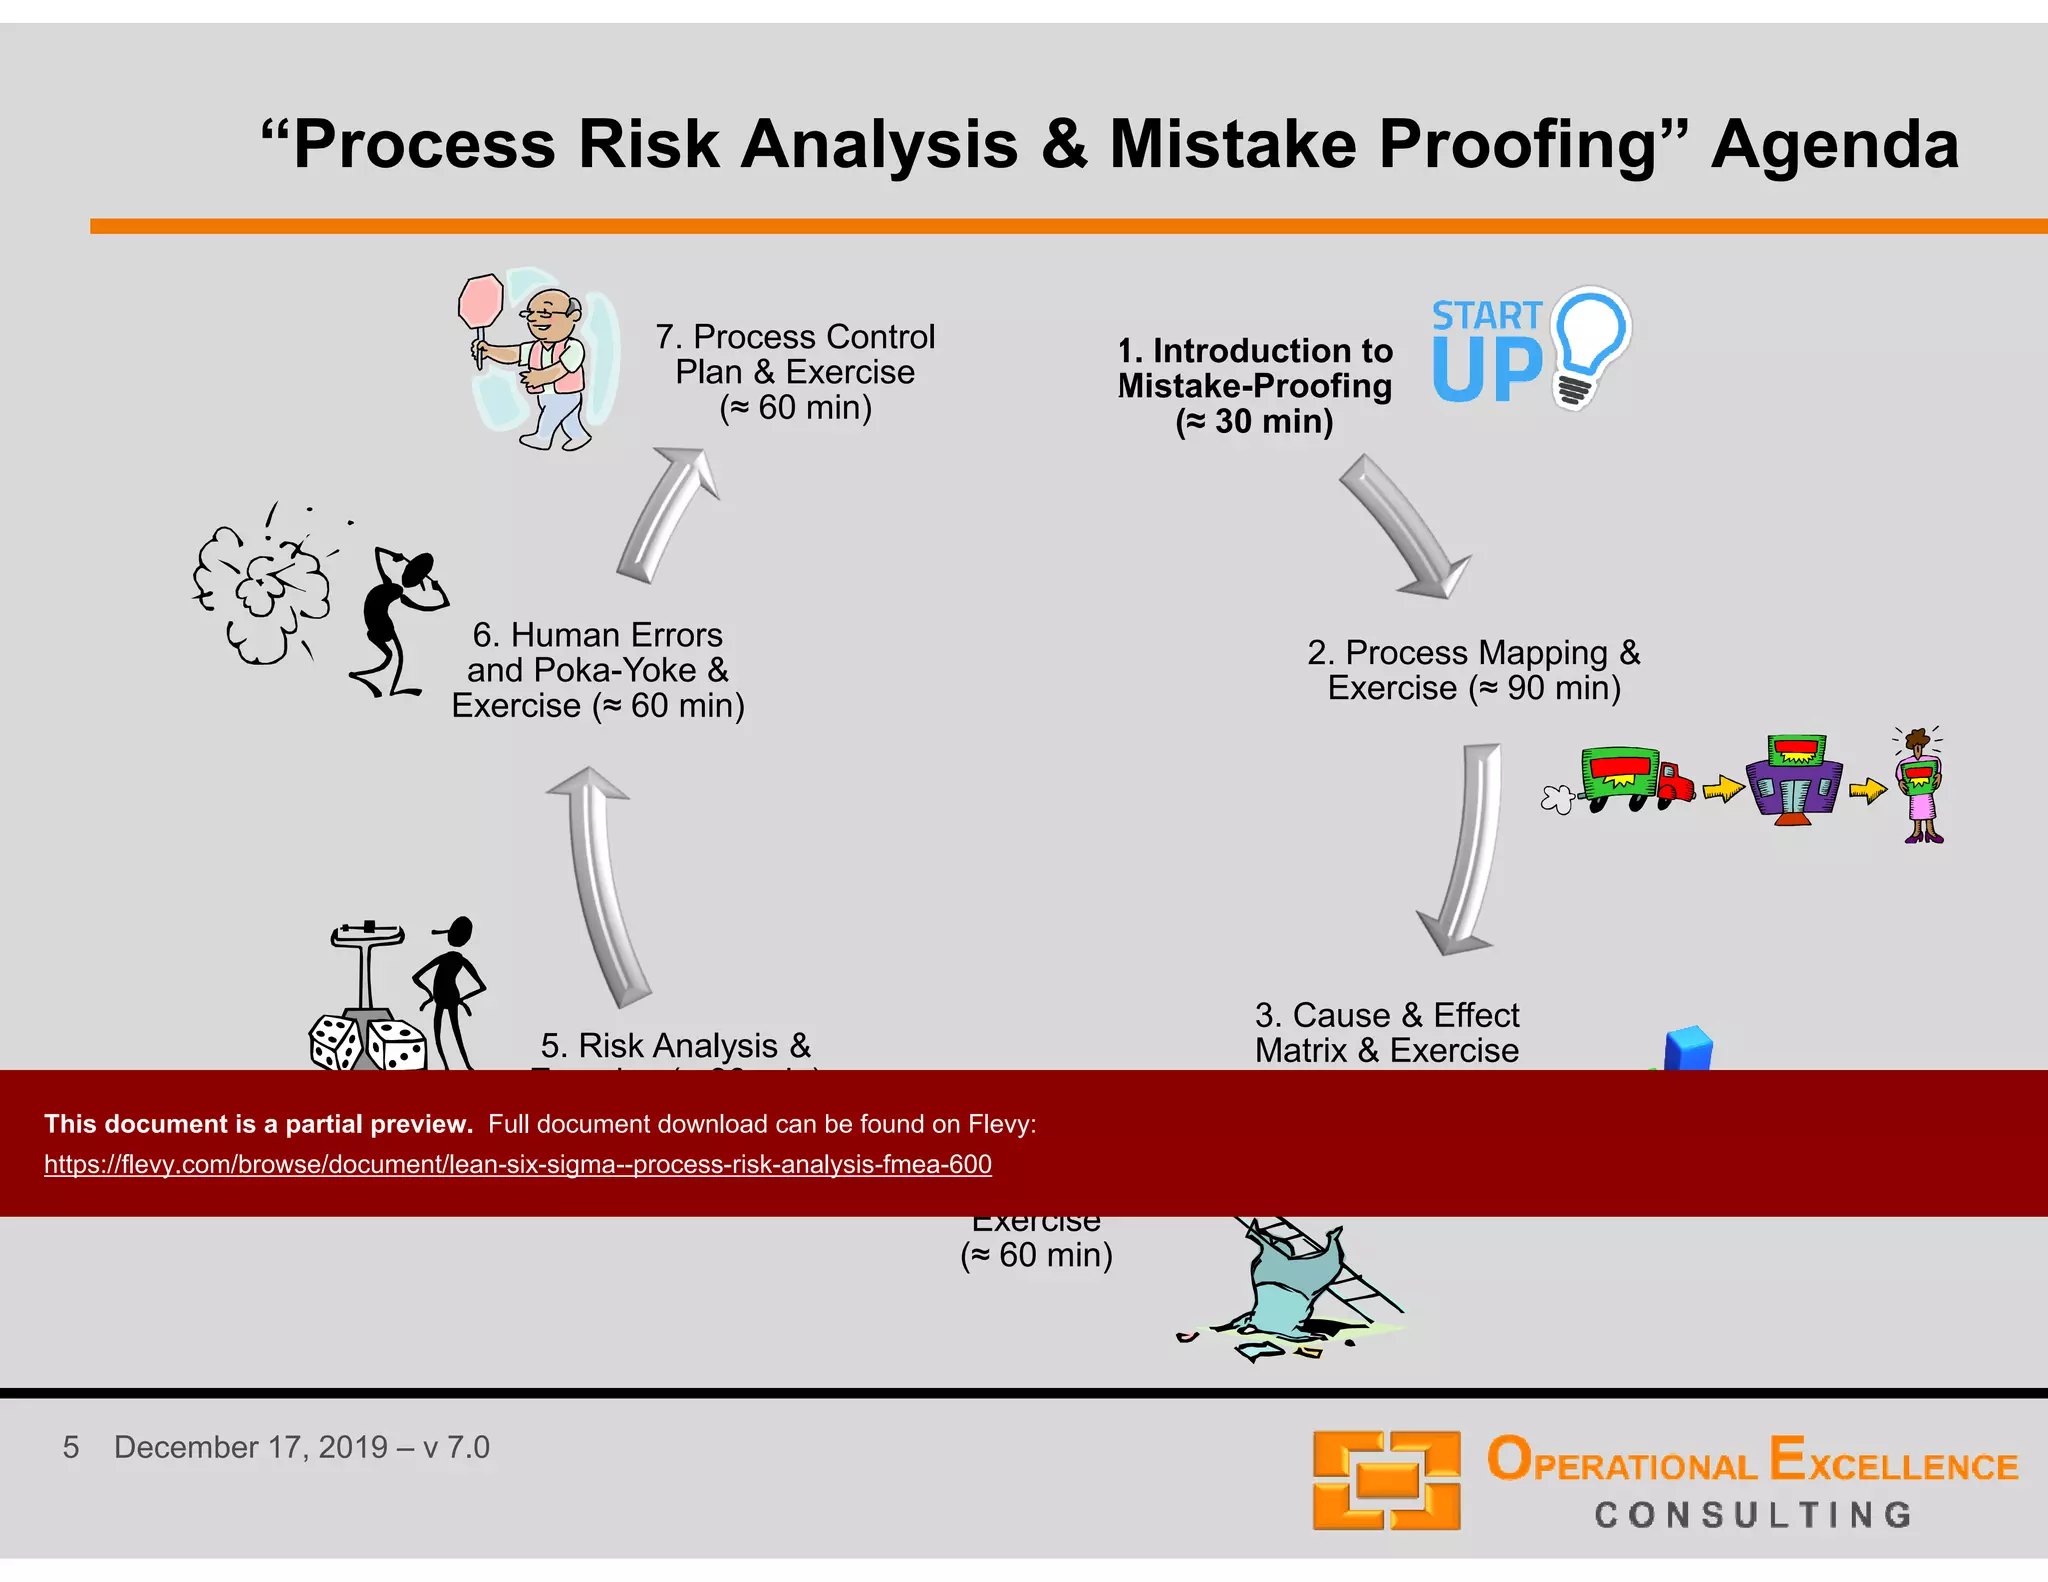
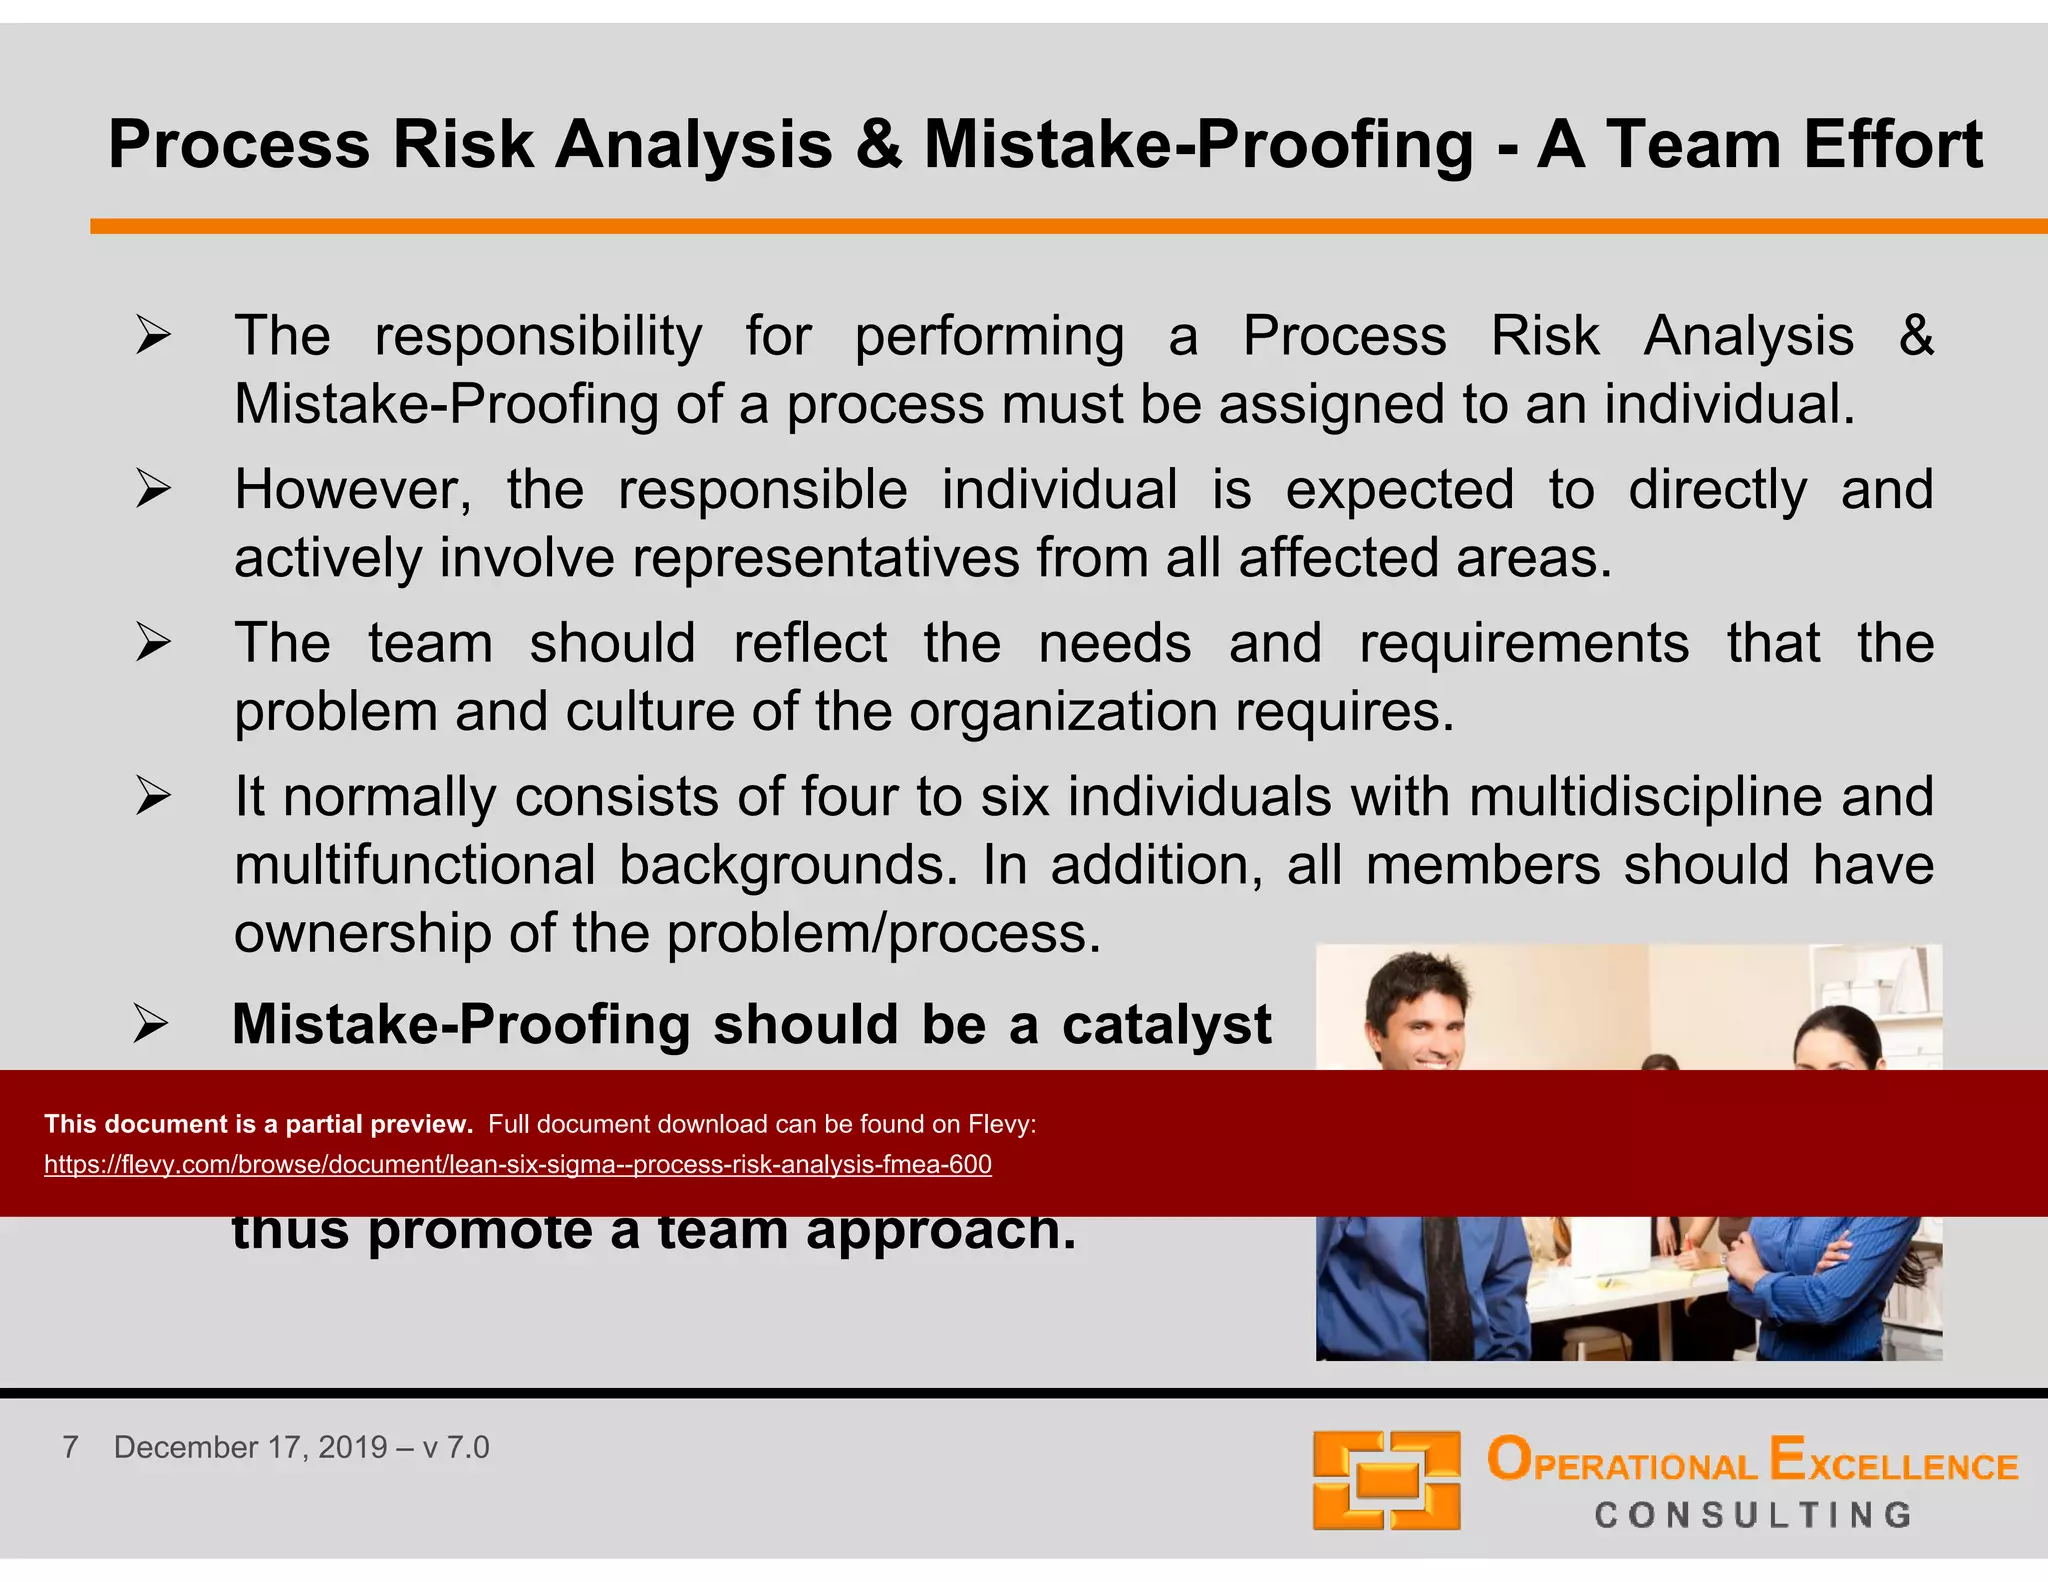


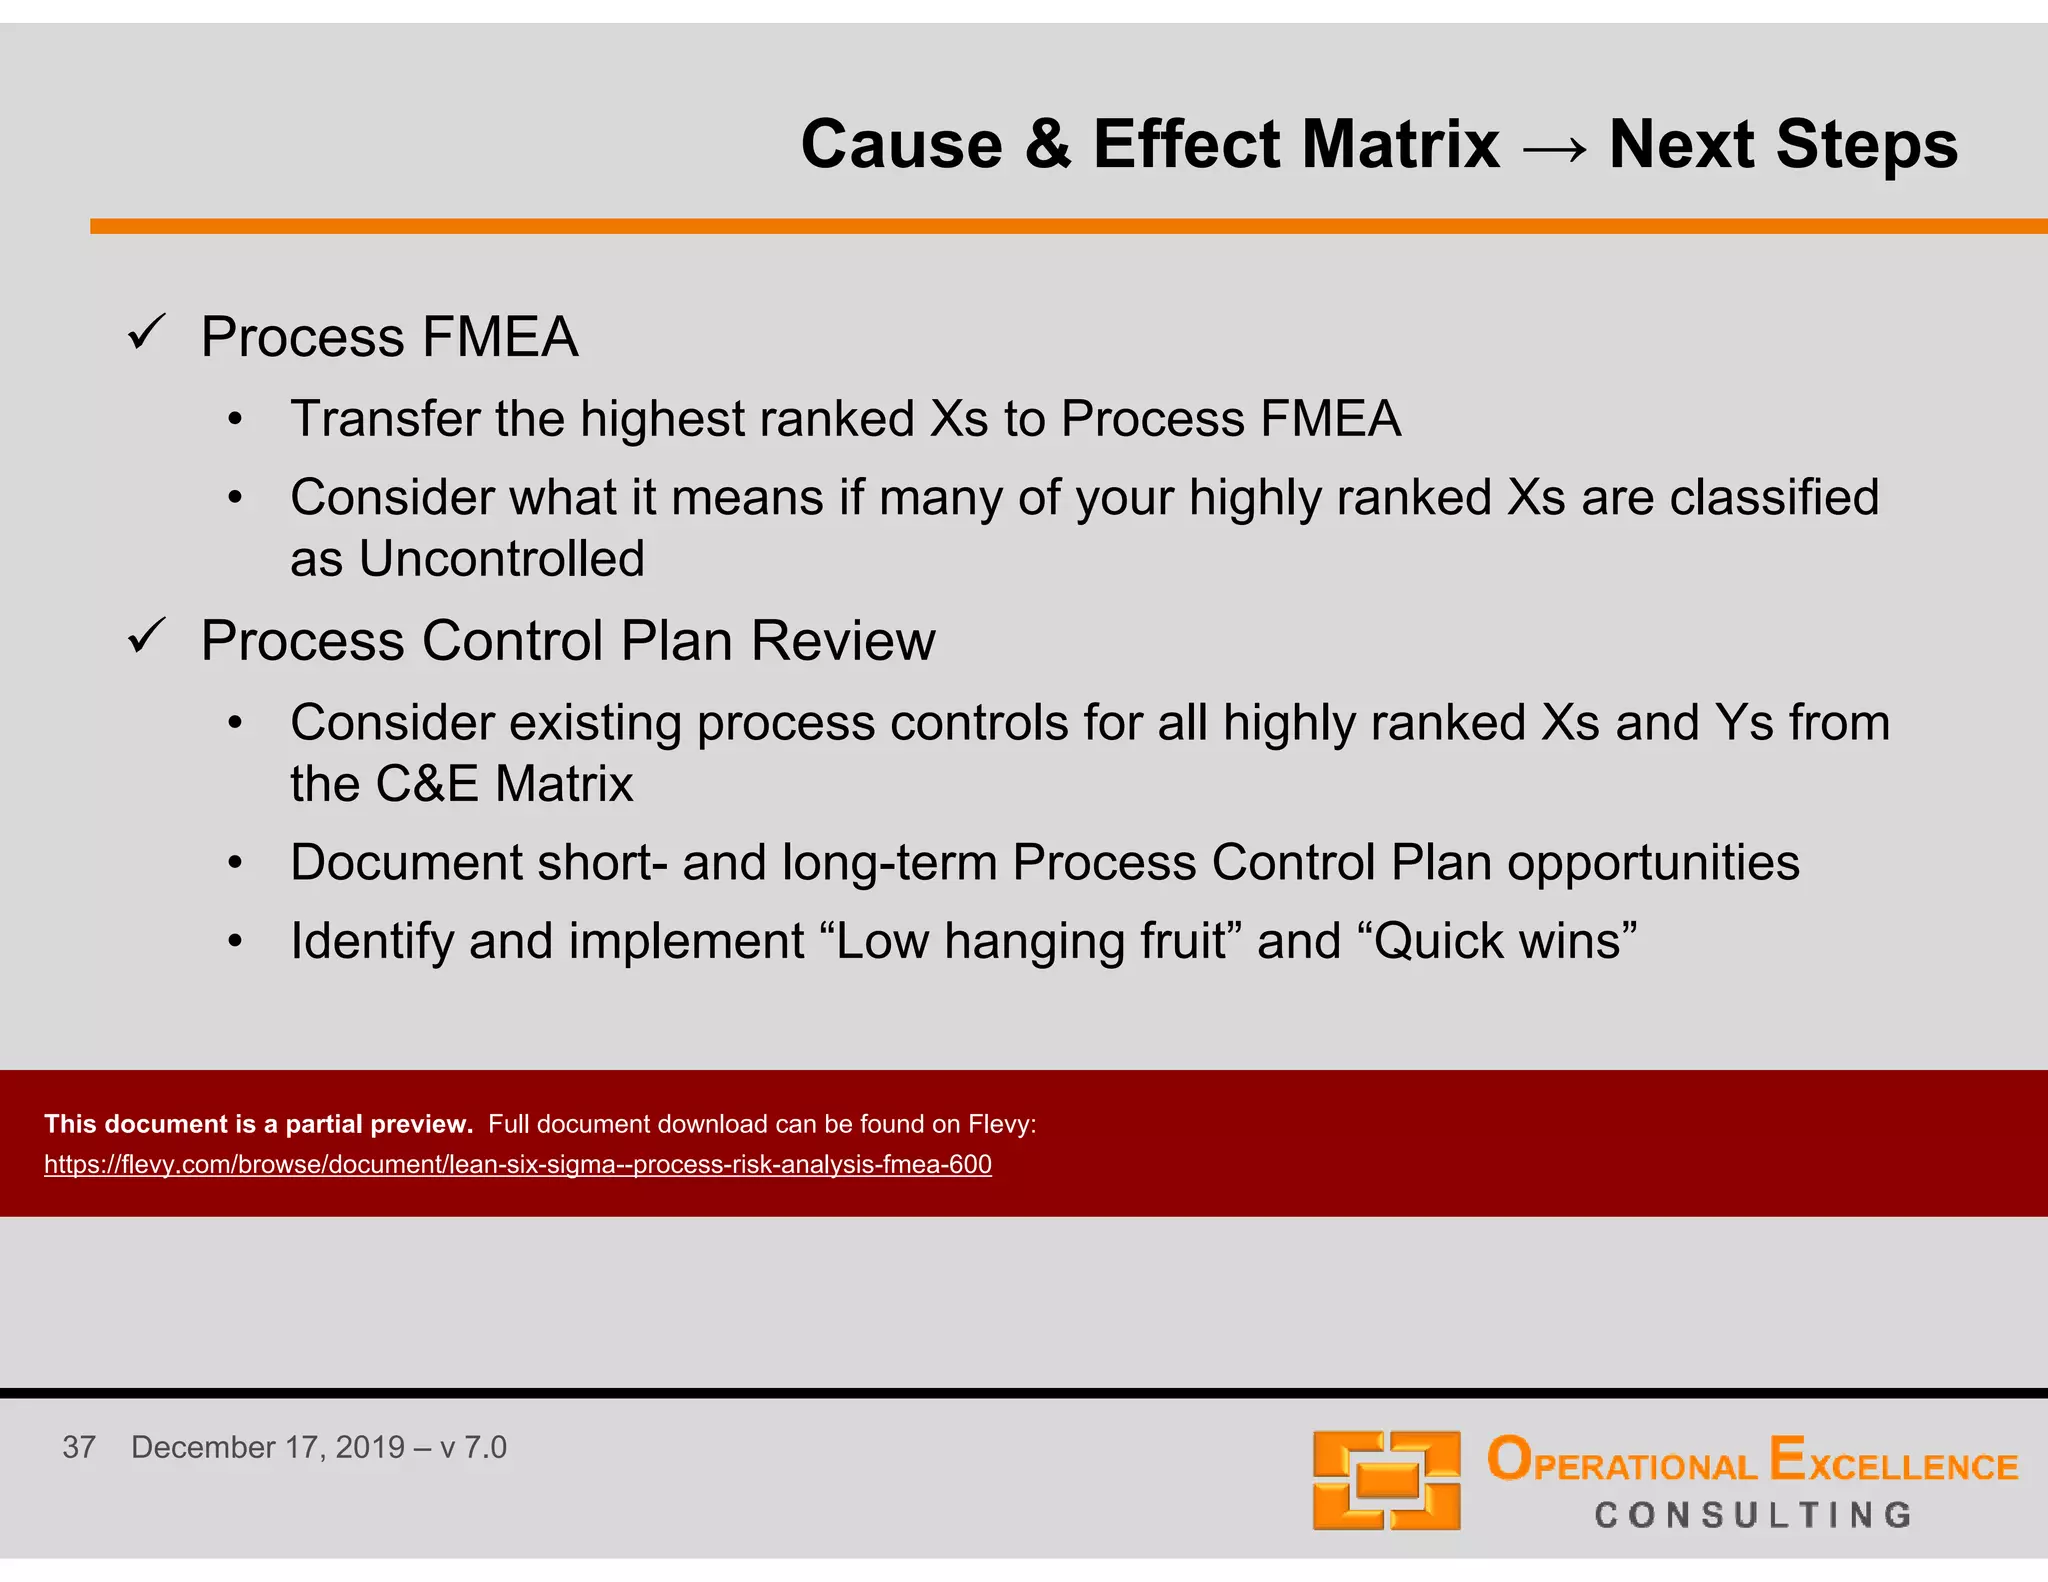


The document outlines a 10-step process risk analysis and mistake-proofing solution that incorporates principles such as failure mode and effects analysis (FMEA), root cause analysis, and poka-yoke. It emphasizes the importance of a team-driven approach with multi-disciplinary involvement to identify and mitigate potential risks while enhancing process control. Additionally, the document details various methodologies and categorizations involved in analyzing and mapping processes for improved efficiency and quality.


![7 qc tools training material[1]](https://cdn.slidesharecdn.com/ss_thumbnails/7qctoolstrainingmaterial1-120925054558-phpapp02-thumbnail.jpg?width=640&height=640&fit=bounds)


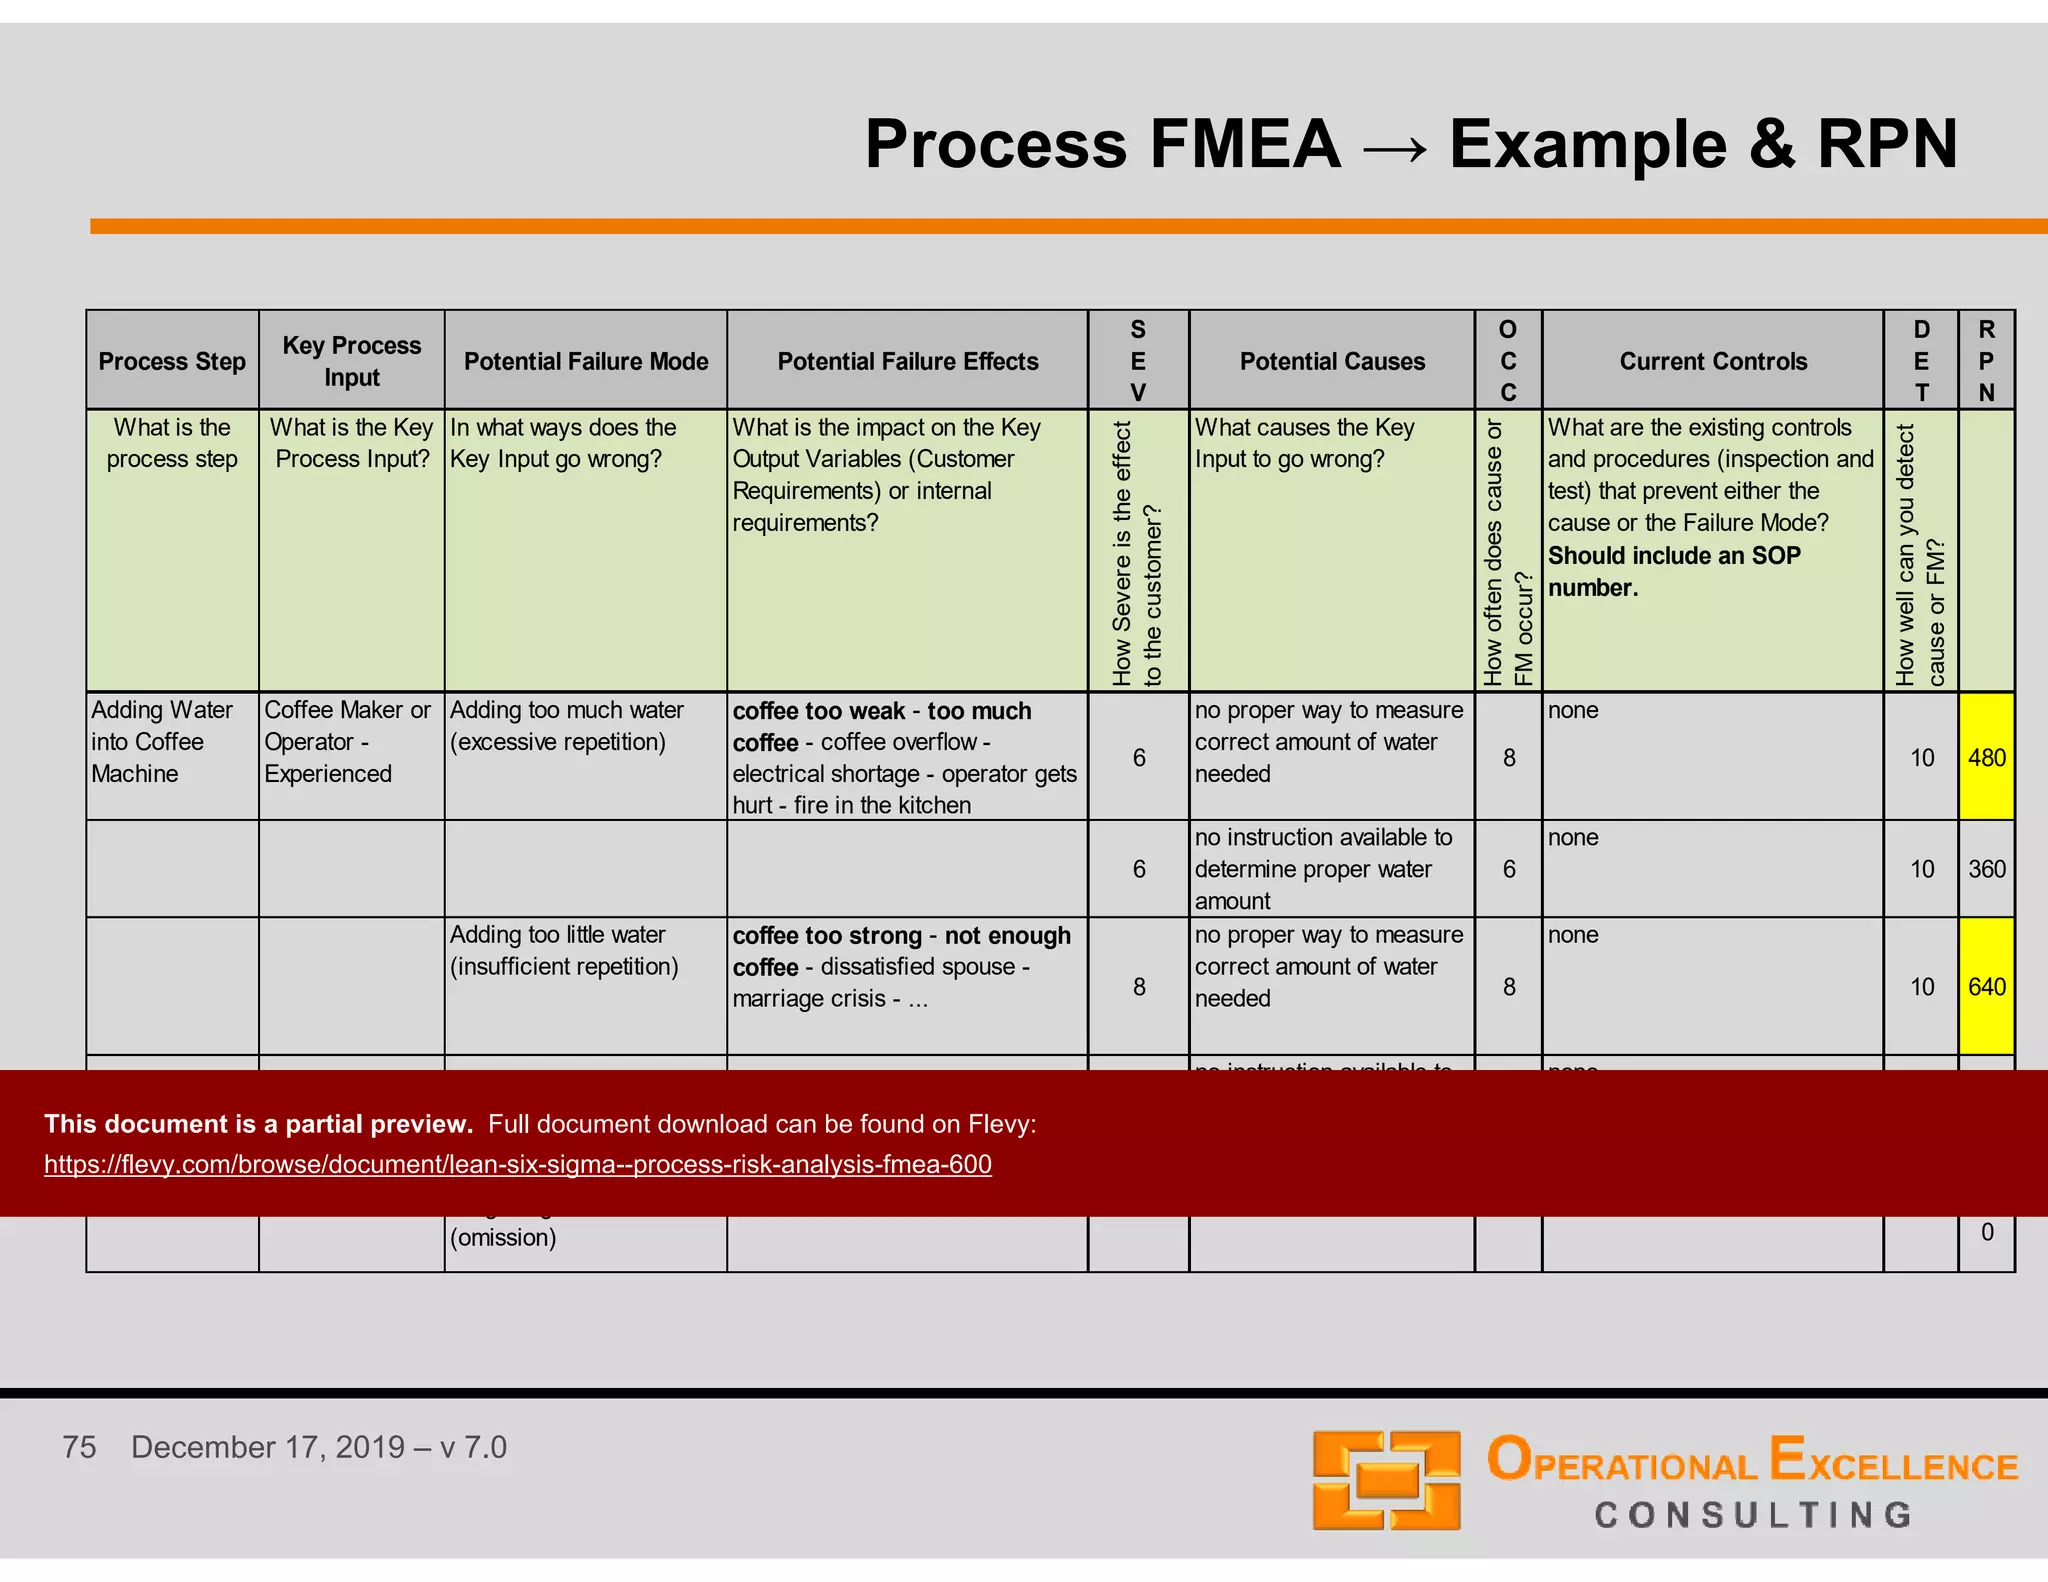
![Fmea Handbook V4.1[1][1]](https://cdn.slidesharecdn.com/ss_thumbnails/fmeahandbookv4111-1310447612699-phpapp01-110712001630-phpapp01-thumbnail.jpg?width=640&height=640&fit=bounds)


![[Whitepaper] 8 Key Steps of Data Integration: Restructuring Redeployment Asse...](https://cdn.slidesharecdn.com/ss_thumbnails/8keystepsofdataintegrationrestructuringredeploymentassessmentmanagementbymarkbridgesfeb2021medium-210217191155-thumbnail.jpg?width=640&height=640&fit=bounds)
![[Whitepaper] The “Theory of Constraints:” What’s Limiting Your Organization?](https://cdn.slidesharecdn.com/ss_thumbnails/theoryof-210212191639-thumbnail.jpg?width=640&height=640&fit=bounds)
![[Whitepaper] Business Model Innovation: Creation of Scalable Business Models ...](https://cdn.slidesharecdn.com/ss_thumbnails/businessmodelinnovationcreationofscalablebusinessmodelsredefinedbymarkbridgesmedium-210105161643-thumbnail.jpg?width=640&height=640&fit=bounds)
![[Whitepaper] Business Transformation Success Factors](https://cdn.slidesharecdn.com/ss_thumbnails/5561-210403145933-thumbnail.jpg?width=640&height=640&fit=bounds)
![[Whitepaper] The Definitive Guide to Strategic Planning: Here’s What You Need...](https://cdn.slidesharecdn.com/ss_thumbnails/thedefinitiveguidetostrategic-210214173358-thumbnail.jpg?width=640&height=640&fit=bounds)
![[Whitepaper] Strategy Classics: Value Disciplines Model](https://cdn.slidesharecdn.com/ss_thumbnails/thedefinitiveguidetostrategic-210214191052-thumbnail.jpg?width=640&height=640&fit=bounds)
![[Whitepaper] Key Account Management: Handling Large Global Accounts the Right...](https://cdn.slidesharecdn.com/ss_thumbnails/keyaccountmanagementhandlinglargeglobalaccountstherightwaybymarkbridgesmedium-210116155811-thumbnail.jpg?width=640&height=640&fit=bounds)
![[Whitepaper] Nudge Theory: An Effective Way to Transform Negative Behaviors](https://cdn.slidesharecdn.com/ss_thumbnails/nudgetheoryaneffectivewaytotransformnegativebehaviorsbymarkbridgesmedium-210114161003-thumbnail.jpg?width=640&height=640&fit=bounds)
![[Whitepaper] 5 Dimensions of Employee Engagement Scorecard](https://cdn.slidesharecdn.com/ss_thumbnails/5321-210328193614-thumbnail.jpg?width=640&height=640&fit=bounds)
![[Whitepaper] A Great Leadership Experience: Dr. Rachid Yazami, Inventor of th...](https://cdn.slidesharecdn.com/ss_thumbnails/agreatleadershipexperiencedr-210209191633-thumbnail.jpg?width=640&height=640&fit=bounds)

![[Whitepaper] Finding It Hard to Manage Conflict at the Workplace? Use the Tho...](https://cdn.slidesharecdn.com/ss_thumbnails/findingithardto-210117143721-thumbnail.jpg?width=640&height=640&fit=bounds)
![[Whitepaper] Digital Transformation: Workforce Digitization](https://cdn.slidesharecdn.com/ss_thumbnails/3969-210328125242-thumbnail.jpg?width=640&height=640&fit=bounds)
![[Whitepaper] Transportation Cost Reduction in Supply Chain Management](https://cdn.slidesharecdn.com/ss_thumbnails/transportationcostreductioninsupplychainmanagementbymarkbridgesfeb2021medium-210211190249-thumbnail.jpg?width=640&height=640&fit=bounds)
![[Whitepaper] The Definitive Introduction to Strategy Development and Strategy...](https://cdn.slidesharecdn.com/ss_thumbnails/thedefinitiveintroductiontostrategydevelopmentandstrategyexecutionbymarkbridgesjan2021medium-210213184931-thumbnail.jpg?width=640&height=640&fit=bounds)
![[Whitepaper] Shareholder Value Traps: How to Evade Them and Focus on Value Cr...](https://cdn.slidesharecdn.com/ss_thumbnails/shareholdervaluetrapshowtoevade-210102145039-thumbnail.jpg?width=640&height=640&fit=bounds)
![[Whitepaper] Strategic Human Resources: Evolution of Competition](https://cdn.slidesharecdn.com/ss_thumbnails/5310-210327151644-thumbnail.jpg?width=640&height=640&fit=bounds)


