Geert Driessen (2005) LCC In Dutch? Usage of Dutch regional languages and dialects.
•
0 likes•508 views

In Dutch? Usage of Dutch regional languages and dialects.

Recommended
Recommended
More Related Content
What's hot
What's hot (11)
Viewers also liked
Viewers also liked (15)
Similar to Geert Driessen (2005) LCC In Dutch? Usage of Dutch regional languages and dialects.
Similar to Geert Driessen (2005) LCC In Dutch? Usage of Dutch regional languages and dialects. (20)
More from Driessen Research
More from Driessen Research (20)
Recently uploaded
Recently uploaded (20)
Geert Driessen (2005) LCC In Dutch? Usage of Dutch regional languages and dialects.
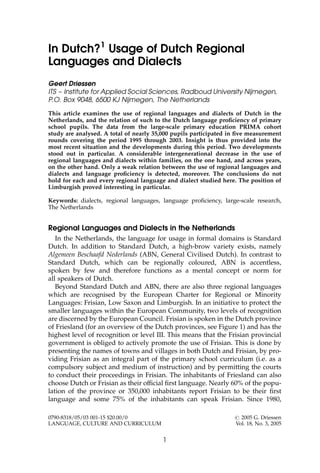
- 1. In Dutch?1 Usage of Dutch Regional Languages and Dialects Geert Driessen ITS – Institute for Applied Social Sciences, Radboud University Nijmegen, P.O. Box 9048, 6500 KJ Nijmegen, The Netherlands This article examines the use of regional languages and dialects of Dutch in the Netherlands, and the relation of such to the Dutch language proficiency of primary school pupils. The data from the large-scale primary education PRIMA cohort study are analysed. A total of nearly 35,000 pupils participated in five measurement rounds covering the period 1995 through 2003. Insight is thus provided into the most recent situation and the developments during this period. Two developments stood out in particular. A considerable intergenerational decrease in the use of regional languages and dialects within families, on the one hand, and across years, on the other hand. Only a weak relation between the use of regional languages and dialects and language proficiency is detected, moreover. The conclusions do not hold for each and every regional language and dialect studied here. The position of Limburgish proved interesting in particular. Keywords: dialects, regional languages, language proficiency, large-scale research, The Netherlands Regional Languages and Dialects in the Netherlands In the Netherlands, the language for usage in formal domains is Standard Dutch. In addition to Standard Dutch, a high-brow variety exists, namely Algemeen Beschaafd Nederlands (ABN, General Civilised Dutch). In contrast to Standard Dutch, which can be regionally coloured, ABN is accentless, spoken by few and therefore functions as a mental concept or norm for all speakers of Dutch. Beyond Standard Dutch and ABN, there are also three regional languages which are recognised by the European Charter for Regional or Minority Languages: Frisian, Low Saxon and Limburgish. In an initiative to protect the smaller languages within the European Community, two levels of recognition are discerned by the European Council. Frisian is spoken in the Dutch province of Friesland (for an overview of the Dutch provinces, see Figure 1) and has the highest level of recognition or level III. This means that the Frisian provincial government is obliged to actively promote the use of Frisian. This is done by presenting the names of towns and villages in both Dutch and Frisian, by pro- viding Frisian as an integral part of the primary school curriculum (i.e. as a compulsory subject and medium of instruction) and by permitting the courts to conduct their proceedings in Frisian. The inhabitants of Friesland can also choose Dutch or Frisian as their official first language. Nearly 60% of the popu- lation of the province or 350,000 inhabitants report Frisian to be their first language and some 75% of the inhabitants can speak Frisian. Since 1980, 1 0790-8318/05/03 001-15 $20.00/0 # 2005 G. Driessen LANGUAGE, CULTURE AND CURRICULUM Vol. 18, No. 3, 2005
- 2. Frisian is taught in all Frisian primary schools and together with Dutch, it is used as a teaching medium in 80% of the schools. In secondary schools, pupils can choose Frisian as a final examination subject but only 5% of the pupils have been found to do so. Low Saxon and Limburgish have level II recognition which means that the government acknowledges the fact that these are not dialects of Dutch. Unlike the Frisians, however, the inhabitants of the relevant regions cannot choose Low Saxon or Limburgish as their official first language. There are no clear regulations with regard to how the government should support the use of these regional languages. Low Saxon is spoken in the provinces of Figure 1 The provinces of the Netherlands 2 Language, Culture and Curriculum
- 3. Groningen, Drenthe, Overijssel and Gelderland. An estimated 60% of the popu- lation of these provinces or 1,800,000 inhabitants speak Low Saxon. In public organisations and services, Low Saxon is spoken to differing degrees with mutual comprehensibility holding as the criterion for use. Low Saxon as a school subject is rare, however. Limburgish is spoken in the province of Limburg. About 75% of the popu- lation of Limburg or 900,000 inhabitants are able to speak Limburgish. In con- trast to the other Dutch regional languages and dialects, Limburgish is not only spoken by the lower classes, but also by the middle and elite classes. Limburgish is also used in both formal and informal situations. Limburgish enjoys high social prestige in the province of Limburg and certainly in the pro- vincial capital, Maastricht. Although Limburgish is not taught as a school subject, it is often used to communicate at school. Many dialects are also spoken in the Netherlands. In the province of Noord Brabant, Brabantish is spoken. However, no figures are available as to the number of speakers of this dialect. Zeelandic is spoken in the province of Zeeland by an estimated 60% of the population or some 250,000 inhabitants. The regional and local governments do not show much interest in the dialect, but the status of Zeelandic is nevertheless open to debate and efforts are currently being made to have Zeelandic recognized as an official regional language. The dialects spoken in the provinces of Noord Holland, Zuid Holland, Utrecht and Flevoland are not considered separate dialects as they hardly differ from Standard Dutch. This group of dialects is called Hollandish, and most speakers of Hollandish do not see themselves as speak- ing a dialect although their use of the language has the characteristics of a dialect. The economic, demographic, political and cultural centre of the Netherlands or the so-called ‘Randstad’ is situated in the provinces of Noord Holland, Zuid Holland and Utrecht. The Randstad is the area delimited by the four biggest cities in the west and mid-west of the Netherlands: Amsterdam, Rotterdam, the Hague and Utrecht. The greater the distance from the west (i.e. the Randstad), the greater the distance from Standard Dutch. Outside the Randstad (i.e. in the north, east and south of the Netherlands), the popu- lation density is much lower but the regional languages and dialects have a relatively strong position (Council of Europe, 1992; de Vries et al., 1993; Hagen, 1989; Hagen & Giesbers, 1988; Landenweb, 2004; Streektaal.net, 2004; Stroop, 1998; U.S. English Foundation, 2004; van Hout, 1984; Wikipedia, 2004). Very little information is available on the number of people who speak a regional language or dialect in the Netherlands and, if such information is available, it is almost always based on local or regional surveys and small samples. There is even less information available with regard to developments in the use of different regional languages and dialects. In general, the loss of regional languages and dialects has been found to occur first in cities and then in the countryside, and first among the upper and middle social classes and then the lower classes in the Netherlands. Degree of urbanisation and social class are clearly interrelated with the use of regional languages and dialects almost always equated with the lower social classes in the cities but Dutch Regional Languages and Dialects 3
- 4. generally associated with all social classes in the country. Rural languages and dialects often have less of a stigma attached to them than urban language var- ieties simply because rural languages and dialects are an expression of local or regional identity and therefore not social status. It is also more often the case in rural areas than in urban areas that people learn Standard Dutch without giving up their language variety. Another factor influencing the use of language variety is age: the number of young people who do not speak (or better, who do not learn) a regional language or dialect is increasing faster than the number of older people who no longer speak the language variety. In addition to smaller numbers of speakers, the number of domains in which a regional language or dialect is spoken may also decline (‘functional loss’). And a clear trend towards regional language or dialect speaking parents increasingly speaking Standard Dutch with their children can be seen in the Netherlands (Belemans, 2002; Boves & Vousten, 1996; Hagen, 1989; Hagen & Giesbers, 1988; Hinskens et al., 1993; Hoppenbrouwers, 1990; Streektaal.net, 2004; U.S. English Foundation, 2004; van Hout, 1998). When Driessen and Withagen (1999) reviewed Dutch research on the relations between the use of regional languages and dialects and educational achievement, they found only a very few studies. In fact, there were no more than six studies across a period of 25 years. In some studies, no negative effects of speaking a regional language or dialect were found for educational achievement. In other studies, those pupils who spoke a regional language or dialect were found to have a poorer command of Standard Dutch and do follow lower forms of secondary education than pupils who did not speak a regional language or dialect. On the basis of their own empirical data from 1995, Driessen and Withagen conclude that parents’ educational level and pro- vince of residence are relevant for the explanation of differences in the Standard Dutch and arithmetic test results for pupils. Most remarkable were the results for the provinces of Limburg and Friesland. The children from both provinces spoke a regional language in about half of the different language domains con- sidered on average. Yet the pupils from Limburg performed best and the pupils from Friesland performed worst on the achievement tests, even after control for social milieu. Within the two provinces, moreover, no differences existed between those pupils who generally spoke Dutch and those pupils who gener- ally spoke Limburgish or Frisian. In two more recent studies by van Langen and Hulsen (2001) and van Ruijven (2003), the achievement of Frisian primary and secondary school chil- dren was examined and – in keeping with the findings of Driessen and Withagen (1999) – found to be much lower than the achievement of children from other provinces, even after control for social milieu. Although the study by van Langen and Hulsen included information on the actual use of Frisian by the pupils and their parents, the effects of this on the children’s Standard Dutch language achievement were not examined. As already noted, van Ruijven also found Frisian primary school children to achieve lower than other primary school children but did not correlate home language with achievement. Van Ruijven nevertheless concludes that differences in the level of secondary education attained cannot be attributed to language choice (i.e. Frisian or Dutch). 4 Language, Culture and Curriculum
- 5. In order to gain greater insight into the current situation and the develop- ments since 1995, a new study of relations between use of a regional languages and dialects and achievement was undertaken. In their previous empirical study, Driessen and Withagen (1999) examined (1) the use of a regional languages and dialects by parents and their children, and (2) the relations between the language or dialect spoken at home, parental background characteristics and the children’s educational achievement. The first – 1995 – measurement round from the Dutch cohort study Primary Education (PRIMA) was used for this purpose. Since then, four more measurement rounds have taken place with the last round conducted in 2003. The present study therefore provides an update on the earlier study with a focus on the situation in 2003 and the developments since 1995. Sample, instruments and variables As part of the PRIMA study, test and questionnaire data have been collected once every two years from primary school pupils, parents, teachers, and school administrators. The present analyses are based on the results of the first five measurement rounds conducted in 1995, 1997, 1999, 2001 and 2003. A total of 60,000 pupils in grades 2, 4, 6 and 8 from 600 schools have been included in each round. For the present analyses use was made of the data from the fourth grade pupils (approximately eight years of age) measured in 1995 and the second grade pupils (approximately six years of age) measured in 1997, 1999, 2001 and 2003. Those children with both parents born in the Netherlands (i.e. the autochthonous children) were selected from the nationally representative PRIMA sample. This restriction left a total of 34,240 pupils or 7000 pupils per measurement round for the analyses. For more extensive descriptions of the PRIMA database, the reader is referred to Driessen and Haanstra (1996), Driessen et al. (2000, 2002, 2004) and Driessen et al. (1998). The parents of the pupils completed an extensive questionnaire with ques- tions regarding – among other things – to socio-economic status (SES), age of the parents and language choice patterns within the family. Socio-economic status was operationalised as the highest level of education completed by the parents. The categories ranged from (1) no more than primary education to (7) university education. Mothers’ age was available for only two measurement rounds, namely 1995 and 1997. The categories distinguished for age were: (1) less than 30 years, (2) 30–34 years, (3) 35–39 years and (4) 40 years or older.2 The following question concerning the choice of language or dialect (hence- forth: language choice) in the home was posed from the perspective of the parents: which language do you generally speak with your partner: (1) Dutch or (2) a Dutch dialect or Frisian?3 Four questions concerning language choice from the child’s perspective for four domains were also posed: which language does the child generally use: (a) with the mother, (b) with the father, (c) with siblings, (d) with friends: (1) Dutch or (2) a Dutch dialect or Frisian? In addition to these data, information was available with regard to the village or city and the province in which a pupil lived. The former provides an indication of the degree of urbanisation using the following categories: (1) the so-called Big 4: Amsterdam, Rotterdam, the Hague and Utrecht, (2) 21 Dutch Regional Languages and Dialects 5
- 6. other big cities, (3) urbanised rural areas and (4) rural areas. The information with regard to province of residence was used to distinguish the six regional language and dialect regions (henceforth: language region): (1) Frisian, (2) Low Saxon, (3) Limburgish, (4) Brabantish, (5) Zeelandic and (6) Hollandish.4 The language tests administered as part of the PRIMA study were developed by the Dutch National Institute for Educational Measurement (CITO). The test administered in 2003 for grade 2 indicated the level of Dutch pre-reading skills, consisted of 60 multiple-choice items and had a reliability of 0.96. The scores for this test were the total number of items answered correctly. Results Language choice of parents and children In Table 1 the percentages of the parents and children reporting speaking a particular regional language or dialect in various domains of functioning are presented according to year and language region. In the bottom part of the table regional language and dialect usage for The Netherlands as a whole is presented. Five domains of functioning were distinguished: mother with father, child with mother, child with father, child with siblings and child with friends. The question here is whether there are any developments in the usage of regional languages and dialects during the period 1995–2003. To sum- marise this development two coefficients are presented. The eta coefficient rep- resents the total correlation between language choice and year. In addition, the Pearson r coefficient is presented to indicate the linear correlation. To interpret these coefficients, the criteria of Cohen (1988) were taken as a guideline: 0.10 ¼ weak; 0.30 ¼ medium; and 0.50 ¼ strong. Eta2 Â 100 indicates the per- centage of the variance in language choice explained by year. The coefficients eta and r both give an indication of the correlation between language choice and the year of measurement. If there is no difference between both coefficients this indicates that the development is a linear or straight-lined process. In addition to the percentages per year the difference between the last and first year of measurement are presented in the form of percent points. It should be noted, however, that the interpretation of this difference is somewhat ambi- guous in case of a non-linear relation. With respect to the parental choice of language, a total of 27% of all the parents in the Netherlands in 1995 spoke a regional language or dialect among themselves. In 2003, this number declined to 18%. Although the accom- panying eta is no more than 0.08 and thus reflects a very weak correlation, a reduction of one third is still apparent. Limburgish is spoken most in each of the years, followed by Frisian, Zeelandic, Low Saxon and Brabantish; Hollandish is hardly spoken. Although the relation between language choice and year is not always perfectly linear, a declining trend is nevertheless appa- rent for each of the regional languages and dialects. In 1995, for instance, Frisian was spoken by 60% of the parents living in Friesland; in 2003, this percentage had dropped to 41%. This is a decline of no less than 19 percentage points or almost one third. The use of Limburgish, however, remained rather stable and only showed a small decrease between 2001 and 2003 with 57% of the parents living in Limburg still speaking Limburgish in 2003. 6 Language, Culture and Curriculum
- 7. Table 1 Percentage of respondents reporting using a regional language or dialect for various domains of functioning, according to language region and year Language region Domains 1995 1997 1999 2001 2003 2003–1995 eta r Frisian Mother-Father 60 51 52 45 41 219 0.14 20.13 Child-Mother 51 41 46 40 32 219 0.13 20.12 Child-Father 53 43 47 42 33 220 0.13 20.12 Child-Siblings 52 41 46 40 34 218 0.13 20.11 Child-Friends 48 33 41 34 23 225 0.18 20.15 Low Saxon Mother-Father 34 28 30 24 28 26 0.07 20.05 Child-Mother 7 6 6 5 5 22 0.04 20.03 Child-Father 8 7 7 6 6 22 0.03 20.03 Child-Siblings 7 6 6 5 4 23 0.03 20.03 Child-Friends 6 5 6 5 4 22 0.04 20.03 Limburgish Mother-Father 63 65 66 64 57 26 0.06 20.03 Child-Mother 50 53 55 49 46 24 0.06 20.03 Child-Father 51 54 56 50 46 25 0.07 20.03 Child-Siblings 50 54 54 51 47 23 0.05 20.02 Child-Friends 42 42 50 40 39 23 0.08 20.01 Brabantish Mother-Father 19 15 14 13 12 27 0.07 20.06 Child-Mother 4 3 4 3 2 22 0.03 20.03 Child-Father 4 3 3 4 3 21 0.02 20.01 Child-Siblings 4 3 3 3 3 21 0.03 20.02 Child-Friends 5 3 3 3 3 22 0.04 20.03 Zeelandic Mother-Father 33 38 36 25 32 21 0.10 20.05 Child-Mother 17 23 17 12 12 25 0.11 20.08 Child-Father 17 25 22 14 13 24 0.12 20.08 Child-Siblings 17 26 22 15 14 23 0.12 20.07 Child-Friends 14 24 20 14 16 þ2 0.10 20.04 Hollandish Mother-Father 4 2 2 1 3 21 0.07 20.03 Child-Mother 2 1 1 0 1 21 0.06 20.02 Child-Father 2 1 1 1 1 21 0.06 20.01 Child-Siblings 2 5 1 0 1 21 0.07 20.01 Child-Friends 2 5 1 0 1 21 0.07 20.01 The Netherlands Mother-Father 27 22 20 18 18 29 0.08 20.08 Child-Mother 13 12 10 8 8 25 0.07 20.07 Child-Father 14 12 10 9 8 26 0.06 20.06 Child-Siblings 13 12 10 9 8 25 0.06 20.06 Child-Friends 12 9 9 7 7 25 0.06 20.06 Dutch Regional Languages and Dialects 7
- 8. The data with respect to the children show a different picture. In general, the children spoke a regional language or dialect much less than their parents did. The differences for the Low Saxon and Brabantish language regions are particu- larly marked. While roughly 30% of the parents in the Low Saxon region spoke this regional language, only 6% of their children did so. For Brabantish, the picture is about the same. In the provinces of Limburg and Friesland, however, the differences between the parents and children are much less pronounced. Principal component analyses were next performed for the four domains of language functioning involving the children. One general factor was found to explain 89% of the variance in the language choice scores with a reliability of 0.97. A new variable was thus constructed by counting the relative number of domains in which the child used a regional language or dialect across the four domains of functioning. The score on this variable could thus range from 0% (Standard Dutch spoken in all four domains) to 100% (regional language or dialect spoken in all four domains). In addition, a variable includ- ing the language choice of the parents was constructed and found to explain 79% of the variance in the parent and child language choice scores considered together with a reliability of 0.94. This variable involved the relative number of domains in which a regional language or dialect was used by the child and his or her parents. The score on this variable could range from 0% (Standard Dutch spoken in all five domains) to 100% (regional language or dialect spoken in all five domains). In Table 2, an overview of the scores (in percentages) for the use of the different regional languages and dialects in the strictly child versus child Table 2 Relative number of times respondents report using a regional language or dialect in strictly child versus child plus parent domains of functioning, according to language region and year Language region Domains 1995 1997 1999 2001 2003 eta r Frisian Child 40 31 35 30 24 0.15 20.14 Child þ parents 52 42 47 40 33 0.15 20.13 Low Saxon Child 5 4 5 4 4 0.03 20.03 Child þ parents 13 11 12 10 10 0.05 20.04 Limburgish Child 38 39 41 36 34 0.07 20.03 Child þ parents 51 54 57 51 47 0.07 20.02 Brabantish Child 3 3 3 2 2 0.03 20.02 Child þ parents 7 6 6 5 5 0.04 20.04 Zeelandic Child 13 19 16 11 11 0.11 20.07 Child þ parents 19 27 24 17 18 0.11 20.06 Hollandish Child 2 0 0 0 1 0.07 20.01 Child þ parents 2 1 1 1 2 0.07 20.02 The Netherlands Child 10 9 8 6 6 0.07 20.06 Child þ parents 16 14 12 11 10 0.07 20.07 8 Language, Culture and Curriculum
- 9. plus parent domains of functioning is presented for the different language regions and years between 1995 and 2003. For the Netherlands as a whole in 1995, a regional language or dialect was used in an average of 16% of the five domains (i.e. in less than one domain). By 2003, this percentage had dropped to 10. The most substantial decrease is apparent for Friesland with usage of Frisian in half of the domains in 1995 and only one third in 2003. The data for the strictly child domains show a com- parable trend. Language choice, SES, parental age and urbanisation To examine the relations between socio-economic status and language choice the data from the most recent PRIMA measurement in 2003 were used. The cor- relations between the children’s use of a regional language or dialect or the chil- dren’s plus the parents’ use of a regional language or dialect and parental educational level were computed. The results for the total sample are shown in Table 3. They show a linear relationship to exist between parental education and use of a regional language or dialect: the higher the level of education, the less the regional language or dialect is used. In families with a university education, the regional language or dialect is rarely spoken. When the relations are examined for each of the six language regions separately, the results show the correlations to be strongest for the Low Saxon region (up to 20.30) and less for the Hollandish region (as weak as 20.07). While the total correlation (eta) for Limburgish was found to be 0.19, the linear correlation (r) was only 20.06. This suggests differences across differently educated families but not that less Limburgish is necessarily spoken by the higher educated families. The discrepancy in the correlations is caused by the fact that the senior general educated families speak Limburgish most (i.e. in 58% of the five domains) while the university educated families speak Limburgish least (i.e. in only 19% of the five domains). Whether a relation possibly exists between maternal age and language choice was next examined using the data from the second PRIMA measurement in 1997. The results for the total sample are presented in Table 4. Only very weak correlations were found for maternal age and language choice and, insofar a relation was found, this was mainly caused by the oldest age category (i.e. over the age of 40). Contrary to our expectation, however, the relation was Table 3 Relative number of times respondents report using a regional language or dialect in strictly child versus child plus parent domains of functioning, according to parental level of education (PRIMA measurement 2003) Parental level of education Domains Primary Junior vocational Junior general Senior vocational Senior general Higher professional University eta r Child 15 10 7 7 7 4 1 0.13 20.12 Child þ parents 22 17 12 12 11 7 2 0.16 20.15 Dutch Regional Languages and Dialects 9
- 10. negative: the older the mothers, the less the regional language or dialect was spoken. But once again, the correlation was very weak. When analysed separ- ately, the results per language region differed only slightly from those for the total sample. In contrast to the other language regions, the correlations for Friesland and Limburg were positive: The older the mothers, the more the regional language or dialect was spoken. But once again, the correlations were very weak at most (0.06). The possibility of a relation between the degree of urbanization and language choice was examined using the data from the fifth PRIMA measurement in 2003. The results for the total sample are presented in Table 5. The correlations are both linear and positive with the regional languages and dialects being mainly spoken in rural areas and rarely spoken in the Big 4 cities. When ana- lysed separately per language region medium correlations are found for the Frisian, Limburgish and Zeelandic regions (up to 0.26) and very weak corre- lations for the Brabantish and Hollandish regions (as weak as 0.01). In contrast to the other regions, the Low Saxon region produced correlations which were nonlinear. This was due to the fact that Low Saxon was spoken most in urba- nized rural areas. Language choice and children’s language proficiency In order to gain insight into the effects of the use of a regional language or dialect on Dutch language proficiency, two sets of analyses of variance were performed. The data used are those from the most recent PRIMA measurement in 2003. The results for the first set of analyses are presented in Table 6. In the first column, the average Dutch language proficiency scores per language region are given. In the second column, the deviations from the total mean score, which was 46.0 with a standard deviation of 6.4, are presented. As Table 4 Relative number of times respondents report using a regional language or dialect in strictly child versus child plus parent domains of functioning, according to maternal age (PRIMA measurement 2003) Maternal age Domains Less than 30 years 30–34 years 35–39 years 40 years and older eta r Child 11 9 9 6 0.04 20.04 Child þ parents 16 14 14 10 0.05 20.04 Table 5 Relative number of times respondents report using a regional language or dialect in strictly child versus child plus parent domains of functioning, according to degree of urbanisation (PRIMA measurement 2003) Degree of urbanisation Domains Big 4 cities Other big cities Urbanised rural areas Rural areas eta r Child 0 5 5 10 0.11 0.10 Child þ Parents 1 7 9 15 0.12 0.12 10 Language, Culture and Curriculum
- 11. there are differences in the social milieu for the different language regions, the possible influence of parental level of education was controlled for next (see the third column). In the final column, the number of domains in which the parents and children used the regional language or dialect was also controlled for. In the bottom row of the table, the correlations (eta) and partial correlations (beta) are further presented. The latter indicates the relation between language region and Dutch language proficiency after parental education and degree of usage for the regional language or dialect have been controlled for. As can be seen, only small differences in Dutch language proficiency are found to occur for the different language regions. The difference between the highest and lowest performing regions, namely Zeeland and Friesland, nevertheless amounts to 2.2 test items – which is one third of a standard devi- ation and therefore considered educationally relevant. The third column also shows the differences to remain almost unchanged after correction for parental education. As can be seen from the last column, moreover, minimal or maximal use of the regional language or dialect also does not change the children’s Dutch language proficiency. In the second set of analyses of variance, a slightly different perspective was adopted. First, the deviation scores for the different language regions and degree of regional language or dialect use were computed. For this purpose, three possible categories of regional language or dialect use were distin- guished: (1) use of the regional language of dialect in 0% or none of the five domains; (2) use in 20–60% of the domains; or (3) use in 61–100% of the domains. The results are presented on the left side of Table 7. The results after control for the possible influence of parental education are presented on the right side of Table 7. Inspection of the results on particularly the right side of the table suggests that one should not consider the Netherlands as a whole when attempting to identify the role of regional language or dialect use in the school performance of Dutch children. While the effect for the Netherlands is extremely small Table 6 Dutch language proficiency, according to language region (PRIMA measurement 2003) Language region Unadjusted mean scores Unadjusted deviation scores Deviation scores adjusted for parental education Deviation scores adjusted for parental education and degree of language variety use Frisian 45.0 21.0 21.1 21.1 Low Saxon 45.5 20.5 20.4 20.4 Limburgish 45.6 20.4 20.1 20.3 Brabantish 46.3 0.3 0.2 0.2 Zeelandic 47.2 1.2 1.2 1.1 Hollandish 46.4 0.4 0.3 0.3 eta ¼ 0.08 beta ¼ 0.07 beta ¼ 0.08 Dutch Regional Languages and Dialects 11
- 12. (beta ¼ 0.02) and clearly not relevant, the effects for some of the language regions are found to be much larger and therefore very relevant. The effects for some of the language regions are positive while the effects for other regions are negative, moreover. The most interesting results are for Limburg and Brabant. For Limburg, the corrected effect is positive and amounts to a beta of 0.17, which means that Dutch language proficiency increases as more Limburgish is also spoken. For Brabant, the opposite is the case: In families where Brabantish is spoken the most, the children’s Dutch language profi- ciency is also lowest. The difference between the children who do not speak Brabantish at all and the children who speak Brabantish in 60% or more of the five functional domains is 3.6 or more than half a standard deviation and thus educationally very relevant. Conclusions In 1999, Driessen and Withagen published an article on the usage of Dutch regional languages and dialects and the relations of such to the Dutch language proficiency of primary school children. The 1995 data from the first measure- ment round of the PRIMA cohort study were analysed in that study. In the present study, the PRIMA data from a total of five measurement rounds were analysed, which provides both an update and overview of any developments for the period 1995–2003. With regard to the use of the PRIMA data, it is important that the following be mentioned. The participants in this study were parents and their children. The children’s age was six to eight years; 42% of their mothers were between the ages of 35 and 39 years; only 15% of the mothers was 40 years or older; 44% of the fathers were between the ages of 35 and 39 years; and 33% of the fathers was 40 years or older. This not only means that people without children were not represented at all, but also that the sample was rather young and underrepresented the older generations. This situation may have implications Table 7 Dutch language proficiency, according to language region and degree of regional language or dialect use (PRIMA measurement 2003) Unadjusted deviation scores per degree of regional language or dialect use Deviation scores per degree of regional language or dialect use adjusted for parental education Language region 0% 20–60% 61–100% eta 0% 20–60% 61–100% beta Frisian 0.4 21.3 20.2 0.08 0.3 21.3 20.1 0.07 Low Saxon 20.1 0.6 21.8 0.07 20.3 1.0 20.3 0.09 Limburgish 21.3 0.3 1.0 0.15 21.2 20.5 1.2 0.17 Brabantish 0.2 0.0 24.4 0.13 0.1 0.4 23.7 0.11 Zeelandic 20.0 20.2 0.4 0.03 20.1 20.1 0.6 0.04 Hollandish 0.0 20.5 21.0 0.02 0.0 20.0 20.3 0.01 The Netherlands 0.1 21.0 21.0 0.03 20.0 0.3 20.2 0.02 12 Language, Culture and Curriculum
- 13. for the representativeness of the results although virtually no relation was observed between parental age and use of a regional language or dialect. The findings of the present study reveal two developments. First, there is a considerable intergenerational decrease in the use of regional languages and dialects within families: Compared to their parents, less than half of the chil- dren studied here spoke a regional language or dialect. Second, a marked decline can be seen to have occurred over the years. In the period studied here, the number of parents and children who spoke a regional language or dialect decreased by more than one third. It should be mentioned, however, that these conclusions do not hold for each and every language region. Two regions stand out in particular. The Limburgish situation is fairly constant and the Frisian situation is very much in decline. With regard to the relation between usage of regional language or dialect and Dutch language proficiency, the results for 2003 show this to be only very weak and to therefore not differ from the results for 1995. Just as in 1995, significant differences between the language regions were also seen in 2003. While use of a regional language or dialect virtually does not affect Dutch language proficiency for the Netherlands as a whole, the effect of speaking Limburgish is found to be edu- cationally relevant and positive, which means that children who speak more Limburgish also have a relatively better Dutch language proficiency. For Brabantish the opposite is found, which means that children in families where Brabantish is spoken show relatively lower Dutch language proficiency. With respect to the process of language shift and the erosion of regional languages and dialects, opinions differ with regard to the pace at which this is happening. The present findings, which cover less than a decade, suggest that things do not look good for most Dutch regional languages and dialects. Limburgish appears to constitute an exception to this general process of decline and dying out (cf. Kroon & Vallen, 2004). There is also debate with regard to whether this development is ‘good’ or ‘bad’. Some feel the need to reverse language shift and see the loss of a language as the destruction of a rooted identity (Fishman, 1991). Others see the loss of linguistic diversity as a threat to our future (Dalby, 2003). And still others are of the opinion that languages do not die but are abandoned by their users for a more widely spoken language and typically for purely practical reasons (Bentahila & Davies, 1990). There are also others who think that the promotion of minority, local and immigrant languages – which are all too often ill-equipped for con- temporary usage – only serves to strengthen the position of the dominant language as the only common idiom: the more languages, the more English (de Swaan, 2003). Just who is right and who is wrong for many is of little rele- vance, however, as the development appears to be irreversible in light of the ongoing and pervasive processes of internationalisation and globalisation. Acknowledgements The Social Sciences Research Council of the Netherlands Organization for Scientific Research (NWO) is gratefully acknowledged for provision of the PRIMA data on which the empirical part of this article is based. Dutch Regional Languages and Dialects 13
- 14. Correspondence Any correspondence should be directed to Dr Geert Driessen, ITS – Institute for Applied Social Sciences, Radboud University Nijmegen, P.O. Box 9048, 6500 KJ Nijmegen, The Netherlands (g.driessen@its.ru.nl; URL: www. geertdriessen.nl). Notes 1. In disgrace, in trouble (The New Shorter Oxford English Dictionary). 2. Note that mothers’ age was chosen for inclusion in the present analyses because mothers are the primary caretakers, particularly with respect to very young children. 3. At the time of the first PRIMA measurement rounds, Low Saxon and Limburgish had not as yet been officially recognized as regional languages. 4. It should be noted that the boundaries of the provinces do not exactly coincide with the boundaries of the areas in which a regional language or dialect is spoken. References Belemans, R. (2002) Eindrapport over de Limburg-Enqueˆte. Leuven: KU Leuven. Bentahila, A. and Davies, E. (1990) On the Evaluation of Arabic Language and Culture Lessons: Another Perspective. Fez: University of Fez. Boves, T. and Vousten, R. (1996) Thuistaal en schoolresultaten. In R. van Hout and J. Kruijsen (eds) Taalvariaties. Toonzettingen en Modulaties op een Thema. Dordrecht: Foris. Cohen, J. (1988) Statistical Power Analysis for the Behavioral Sciences. Hillsdale, NJ: Erlbaum. Council of Europe (1992) European Charter on Regional or Minority Languages. Strasbourg: Council of Europe. Dalby, A. (2003) Language in Danger. The Loss of Linguistic Diversity and the Threat to Our Future. New York: Columbia University Press. De Swaan, A. (2003) Bedreigde talen, sociolinguı¨stiek en taalsentimentalisme. Toegepaste Taalwetenschap in Artikelen 70, 15–26. De Vries, J., Willemyns, R. and Burger, P. (1993) Het Verhaal van een Taal. Negen Eeuwen Nederlands. Amsterdam: Prometheus. Driessen, G. and Haanstra, F. (1996) De Oudervragenlijst Basisonderwijs en Speciaal Onderwijs. Technische Rapportage PRIMA-cohortonderzoek 1994/95. Amsterdam/ Nijmegen: SCO/ITS. Driessen, G. and Withagen, V. (1999) Language varieties and educational achievement of indigenous primary school pupils. Language, Culture and Curriculum 12, 1–22. Driessen, G., van Langen, A., Portengen, R. and Vierke, H. (1998) Basisonderwijs: Veldwerkverslag, Leerlinggegevens en Oudervragenlijsten. Basisrapportage PRIMA- cohortonderzoek. Tweede Meting 1996–1997. Nijmegen: ITS. Driessen, G., van Langen, A. and Vierke, H. (2000) Basisonderwijs: Veldwerkverslag, Leerlinggegevens en Oudervragenlijsten. Basisrapportage PRIMA-cohortonderzoek. Derde Meting 1998/99. Nijmegen: ITS. Driessen, G., van Langen, A. and Vierke, H. (2002) Basisonderwijs: Veldwerkverslag, Leerlinggegevens en Oudervragenlijsten. Basisrapportage PRIMA-cohortonderzoek. Vierde Meting 2000–2001. Nijmegen: ITS. Driessen, G., van Langen, A. and Vierke, H. (2004) Basisonderwijs: Veldwerkverslag, Leerlinggegevens en Oudervragenlijsten. Basisrapportage PRIMA-cohortonderzoek. Vijfde Meting 2002–2003. Nijmegen: ITS. Fishman, J. (1991) Reversing Language Shift. Theoretical and Empirical Foundations of Assistance to Threatened Languages. Clevedon: Multilingual Matters. Hagen, A. (1989) The Netherlands. In U. Ammon, K. Mattheier and P. Nelde (eds) Sociolinguistica. Volume 3 (pp. 61–74). Tu¨bingen: Max Niemeyer Verlag. Hagen, A. and Giesbers, H. (1988) Dutch sociolinguistic studies. International Journal of the Sociology of Language 73, 29–44. 14 Language, Culture and Curriculum
- 15. Hinskens, F., Hoppenbrouwers, C. and Taeldeman, J. (1993) Dialectverlies en regiolect- vorming, een inleiding. Taal en Tongval, 6, 5–10. Hoppenbrouwers, C. (1990) Het Regiolect. Van Dialect tot Algemeen Nederlands. Muiderberg: Coutinho. Kroon, S. and Vallen, T. (eds) (2004) Dialect en School in Limburg. Amsterdam: Aksant Academic Publishers. Landenweb (2004) Nederland. Taal. On WWW at www.landenweb.com. Accessed 07/12/04. Streektaal.net (2004) Language in the Netherlands. on WWW at http://taal.phileon.nl. Accessed 16/1/04. Stroop, J. (1998) Poldernederlands. Waardoor het ABN Verdwijnt. Amsterdam: Bert Bakker. U.S. English Foundation (2004) Official Language Research. On WWW at http://www. usefoundation.org/foundation/research/olp/, Accessed 16/11/04. Van Els, T. (2001) The European Union, its institutions and its languages: Some language political observations. Current Issues in Language Planning 2, 311–360. Van Hout, R. (1984) Sociolinguistics in the Netherlandic language area. In K. Deprez (ed.) Sociolinguistics in the Low Countries (pp. 1–41). Amsterdam/Philadelphia: Benjamins. Van Hout, R. (1998) Het sociolinguı¨stisch onderzoek van taalvariatie in stadsdialecten. Taal en Tongval, 5, 48–65. Van Langen, A. and Hulsen, M. (2001) Prestaties van Leerlingen en het Gebruik van Fries als Voertaal op Basisscholen in Friesland. Nijmegen: ITS. Van Ruijven, E. (2003) Voorsprong of Achterstand. Onderzoek naar het Onderwijsniveau van de Friese Leerlingen in het Basisonderwijs en Voortgezet Onderwijs. Ljouwert: Fryske Akademy. Wikipedia (2004) Dutch Language. On WWW at http://en.wikipedia.org/wiki/ Dutch_language. Accessed 16/12/04. Dutch Regional Languages and Dialects 15