This document provides an overview and introduction to AutoCAD® Land Desktop 2009:
- AutoCAD Land Desktop 2009 is Autodesk's software for land development, civil engineering, and surveying projects.
- The document lists copyright information and trademarks related to the software.
- It also acknowledges the various third party software programs and libraries that the product may include or be based on.


![.
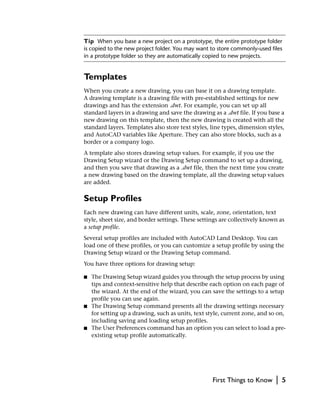
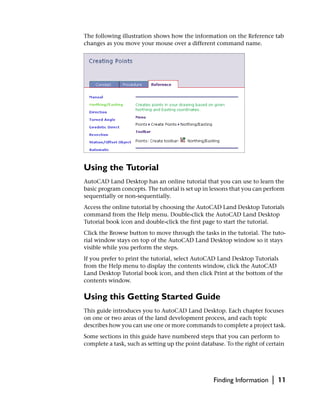
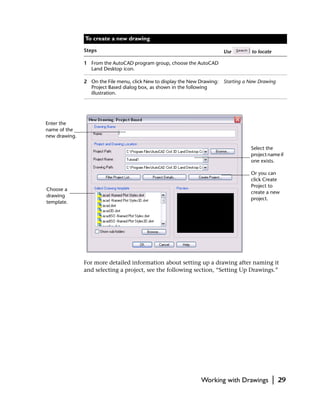
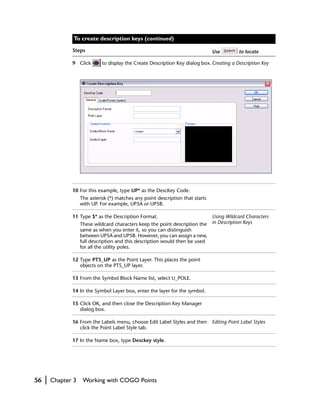
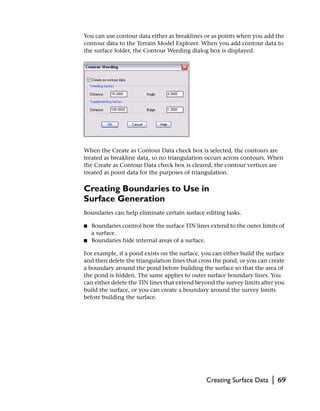
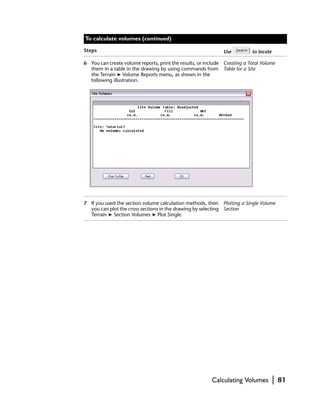
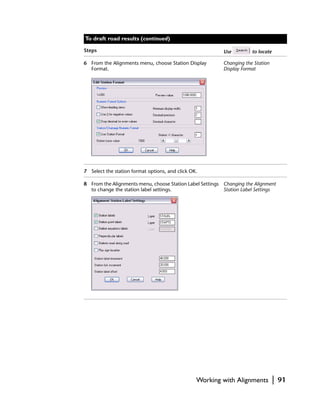
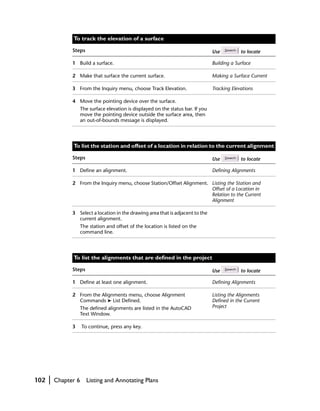
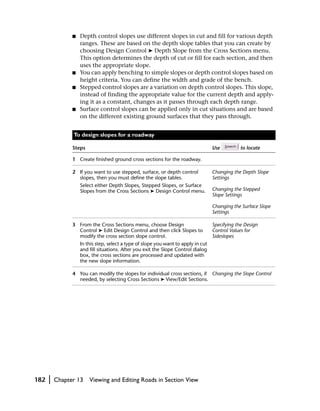
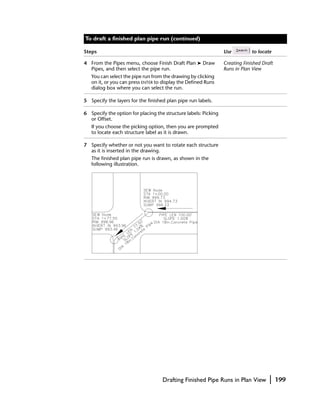
To define a baseline using menu commands
Steps Use to locate
1 From the Data Collection/Input menu, choose Using Baseline Commands
Baseline ➤ Define Baseline.
2 On the Survey Command Line you are prompted to
enter the baseline origin point number.
Using the Survey Command Line
To enter data by typing command names, use the Survey Command Line
method by choosing Data Collection/Input ➤ Survey Command Line. The
command line prompt changes to SURVEY>, and you can enter commands
using the Survey Command Language. Once you become proficient with the
Survey Command Language, you may find that this is the most efficient way
to enter and query data.
The Survey Command Language has commands that you can use to
■ Establish equipment settings.
■ Create, edit, and list points.
■ Create figures, intersections, and centerlines.
■ Enter traverse and side shot observations.
To quickly access the Survey Command Language when the Survey
Command Line is active, type help to display a list of commands that you
can use to enter your information. This file lists the following command
syntax you must use to complete the command:
■ Anything in ( ) parentheses is optional.
■ Anything in [ ] brackets is required.
■ You must separate each item with a space.
For example, the Angle Distance command syntax is:
AD VA (point) [angle] [distance] [vert angle] (descript)
If you type AD VA, then a point number (optional), you must include the
angle, distance, and vertical angle. You can also enter an optional description
for the point.
228 | Chapter 18 Entering Observations](https://image.slidesharecdn.com/lan200999999-120901173334-phpapp02/85/Lan-200999999-238-320.jpg)
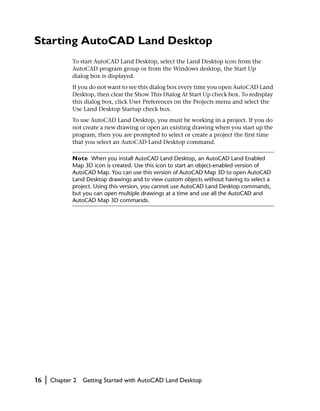
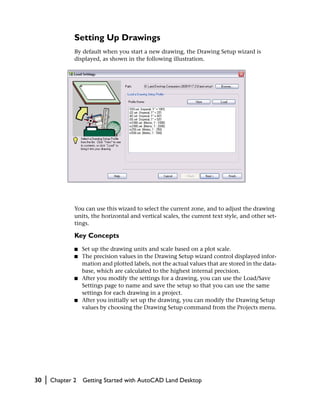
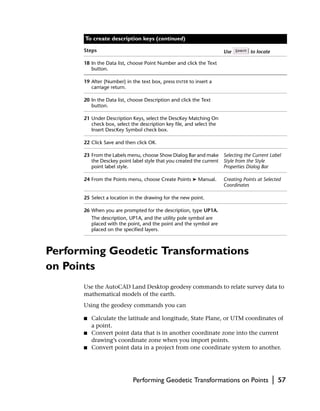
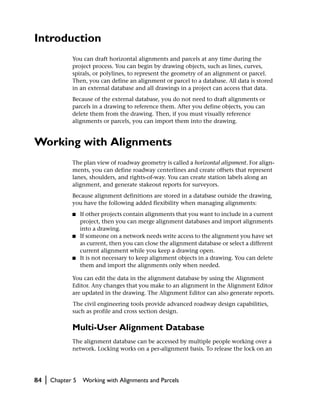
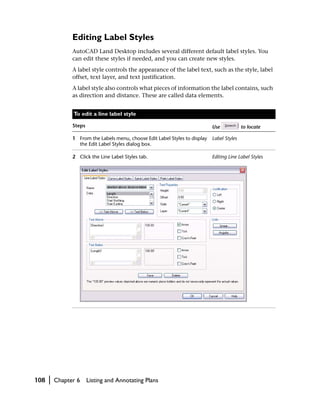
![Key Concepts
■ When you enter observations using the Survey Command Language, you
can start by setting up your station and backsight points on existing
points in your drawing. If the points do not exist, then you are prompted
to enter known northing/easting/elevation coordinates.
■ You can enter observation data directly into a text file. Type the infor-
mation into a text editor, such as Microsoft® Notepad, using the Survey
Command Language. From the Data Collection/Input menu, choose
the Import Field Book File command to place the observations into
your drawing.
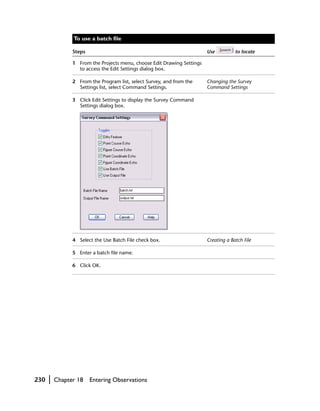
■ To record each entry you make at the Survey Command Line, select the
Use Batch File check box in the Survey Command Settings dialog box
(available from the Edit Settings dialog box). This creates a file that you
can edit if you make mistakes. You can then “run” the batch file to update
the drawing with the correct information.
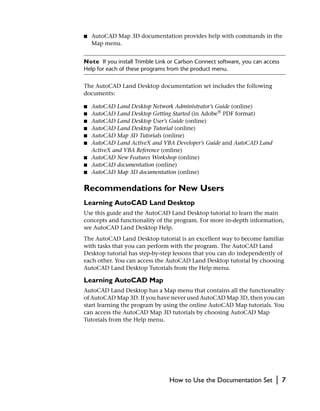
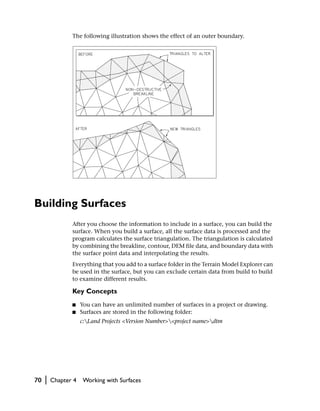
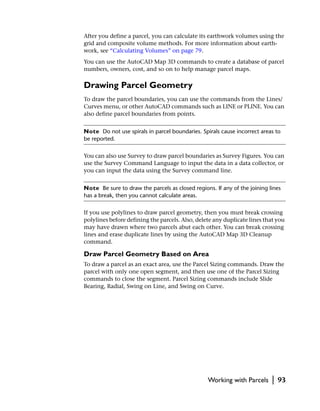
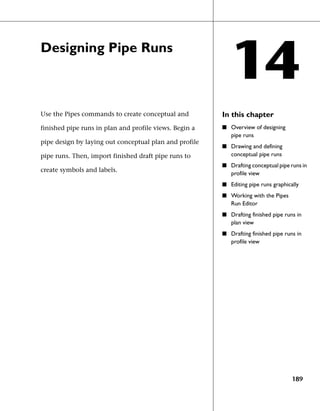
To use the Survey command line
Steps Use to locate
1 From the Data Collection/Input menu, choose Observation Input at the Survey
Survey Command Line to begin using the Survey Command Line
Command Language.
The command line prompt changes to SURVEY>.
2 Type NE, and then type the point number, northing, Using the Survey Command Line
easting, and description to place a beginning point Syntax
using coordinates. The syntax for this command is
NE (point) [northing] [easting] (descript). Place
spaces between each item that you type.
3 Type BD, and then type the point number, bearing, Creating a Point Using a Bearing
quadrant, distance, and description to place a point and a Distance
using a bearing and a distance.
The syntax for this command is BD (point) [bearing]
[quadrant] [distance] (description).
4 Continue to use the Survey Command Language to
place points, or type exit to return to the AutoCAD
command line prompt.
Entering Observed Data | 229](https://image.slidesharecdn.com/lan200999999-120901173334-phpapp02/85/Lan-200999999-239-320.jpg)