1. Abstract
The mechanical function of ligament is primarily supported by a network of collagen fibers. The distribution and orientation of these fiber networks are predictive of the functional behavior of the tissue, and
therefore these structural features serve as an important outcome measure for clinical treatments. The purpose of this study is to develop an application to find fiber orientation and distribution in ligaments
from confocal images. A MATLAB program has been created to automatically and accurately process confocal images to acquire these parameters using Fast Fourier Transform (FFT) method. It also
calculates kӨ and Өp where kӨ is the fiber distribution coefficient and Өp is the preferred or average fiber angle. The program is successful in determining the known kӨ and Өp values from a manufactured test
pattern. This MATLAB program is being ported into a user-friendly Java application to disseminate this technology to other research groups. The application will be helpful in understanding the structural
features that influence the ligament’s strength and stability, and will aid efforts to develop effective treatment strategies that restore the function of injured ligament.
References
Methods
Acknowledgement
Background
Injuries to joint ligaments account for over seven million
hospital visits per year, and incur an annual societal cost of
three billion.
Ligament tears heal slowly, and the healing process results
in fibrous tissue with altered structure and inferior
mechanical strength.
Future works and Conclusion
The current application makes use of MATLAB and Java
both. The future works include making a complete Java
application and further testing.
The application will be helpful in understanding structure-
function relationship of ligaments and other biological tissue.
It will serve as an useful tool in other numerous research that
involves quantification of the fiber microstructure.
Chen, L.H.,Warner, M,,Fingerhut, and Makuc, D., “Injury Episodes and Circumstances”,
National Health Interview Survey, 1997-2007. Vital Health Stat 10, (241): 1-55, 2009
Enomae, T., Han, Y.-H. and Isogai, A., "Nondestructive determination of fiber orientation
distribution of fiber surface by image analysis", Nordic Pulp and Paper Research Journal
21(2): 253-259(2006).
Frank, C.B., Ligament Structure, Physiology and function. J Musculoskelet neuronal
Interact, 4(2): 199-201,2004.
J. Pablo Marquez, Fourier analysis and automated measurement of cell and fiber angular
orientation distributions, International Journal of Solids and Structures, Volume 43, Issue
21, October 2006, Pages 6413-6423, ISSN 0020-7683
P. Berens, CircStat: A Matlab Toolbox for Circular Statistics, Journal of Statistical Software,
Volume 31, Issue 10, 2009
Christina Sundgren and Rici Morrill, NTM Lab
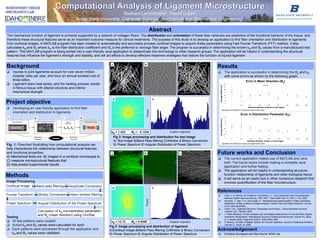
Results
-5
0
5
10
15
20
25
30
AverageDifference*
Samples (Number of fibers in test image)
Error in Mean Direction (Өp)
Error
5 10 20 30 40 50 80 100 150
*represents the difference in actual and experimental value
-1
-0.5
0
0.5
1
1.5
2
2.5
AverageDifference*
Samples (Number of fibers in test image)
Error in Distribution Parameter (kӨ)
Error
5 10 20 30 40 50 80 100 150
*represents the difference in actual and experimental value
The application is successful in determining the Өp and kӨ
with some errors as shown by the following graph.
Fig 3: Image processing and distribution for test image
A) Test Image B)Band Pass filtering C)Window & Binary Conversion
D) Power Spectrum E) Angular Distribution of Power Spectrum
kӨ = 1.542 Өp = - 0.1259
A B C
D E
Fig 2: Image processing and distribution of ligament
A)Confocal Image B)Band Pass filtering C)Window & Binary Conversion
D) Power Spectrum E) Angular Distribution of Power Spectrum
kӨ = 12.72 Өp = 0.5599
A B C
D E
Project objective
Developing an user friendly application to find fiber
orientation and distribution in ligaments.
Fig. 1: Flowchart illustrating how computational analysis can
help characterize the relationship between structural features
and functional properties.
A) Mechanical tests are B) imaged in a confocal microscope to
C) measure microstructural features that
D) help predict experimental results
A B C D
Testing
35 test patterns were created
Actual kӨ and Өp values were calculated for each
Each patterns were processed through the application and
kӨ and Өp values were validated
Band pass filtering
Hann window filteringBinary ConversionFourier Transform
Power Spectrum Angular Distribution of the Power Spectrum
Calculation of kӨ (concentration parameter)
and Өp (mean direction) using CircStat
Confocal Image GrayScale Conversion
Image Processing