Historic home prices in the United States increased by about 0.5% per year on average from 1890 to 2008 when adjusted for inflation. However, after 2008 many economic factors caused median home prices to decline, settling back to 2003 levels by 2010. Real estate is highly local, and understanding the specific market conditions where a home is being bought or sold is important.
Greater Princeton NJ Real Estate Market UpdateAnn Harwood
The document discusses historic and current home prices in the United States, noting that home prices increased by about half a percentage point per year from 1890 to 2008 but have since settled back to 2003 levels. It also provides data on housing absorption rates and inventory in various towns in New Jersey, with absorption rates of 5-6 months indicating a normal housing market. Finally, it mentions that current mortgage interest rates have dropped to their lowest levels since tracking began.
- The National Association of Realtors reported that existing home sales rose 21% in July over July 2010 and that affordability conditions this year have been the most favorable on record dating back to 1970.
- Historic home prices in the U.S. increased by an average of about half a percentage point per year from 1890 through 2008 when adjusted for inflation.
- The document provides data on active listings, pending sales, absorption rates and other housing market metrics for many towns in central New Jersey in August 2011.
Greater Princeton Area Real Estate Market Ann Harwood
- Housing market data from September 2011 showed existing home sales up 11.3% year-over-year and housing starts increasing 15% from the previous month, indicating an improving housing market.
- Unemployment claims fell for the fourth straight week, suggesting continued labor market recovery.
- Real estate markets are assessed by measuring absorption rates, with rates over 6-7 months indicating price depreciation. Absorption rates from local New Jersey markets in October 2011 showed mixed strength across areas.
Princeton Area Real Estata Data July 8 11Ann Harwood
The document reports on housing market statistics from various towns in central New Jersey, including pending home sales data, home price indices, and absorption rates which indicate the strength of the local real estate market. Tables show the number of active listings, pending sales, and absorption rates for areas like Princeton, West Windsor, Plainsboro and others from June and July 2011.
Historic home prices in the US increased by about 0.5% per year from 1890 to 2008 when adjusted for inflation, but have since settled back to 2003 levels due to economic factors after 2008. Several New Jersey towns are listed with current housing inventory statistics like active listings, pending sales, absorption rates, new listings, and price reductions. Absorption rates above 6 months generally lead to annual home price depreciation.
Greater Princeton NJ Area Real Estate MarketsAnn Harwood
The document provides real estate market data for various towns in New Jersey, including active listings, pending sales, absorption rates, new listings, and price reductions. It finds that absorption rates, or the number of months it would take to sell all active listings, are highest in Princeton Borough at 14.5 months and lowest in Hamilton at 22 months. Real estate is described as local, and absorption rate is identified as the most accurate measure of current market strength.
Greater Princeton NJ Real Estate Market UpdateAnn Harwood
Historic home prices in the US increased by about 0.5% per year on average from 1890 to 2008 after adjusting for inflation. However, since 2008 median home prices have declined and settled back to 2003 levels due to various economic factors. The document then provides data on current and historical housing market conditions in various New Jersey towns, including active listings, pending sales, absorption rates and other metrics.
The document provides real estate market data for various towns in New Jersey, including active listings, pending sales, absorption rates, new listings, and closed sales over the past 30 days. Absorption rates indicate market strength, with rates below 5 months considered a strong seller's market and rates above 6 months a weaker market. Most of the towns listed have absorption rates between 5-6 months, suggesting a normal balanced market currently.
Greater Princeton NJ Real Estate Market UpdateAnn Harwood
The document discusses historic and current home prices in the United States, noting that home prices increased by about half a percentage point per year from 1890 to 2008 but have since settled back to 2003 levels. It also provides data on housing absorption rates and inventory in various towns in New Jersey, with absorption rates of 5-6 months indicating a normal housing market. Finally, it mentions that current mortgage interest rates have dropped to their lowest levels since tracking began.
- The National Association of Realtors reported that existing home sales rose 21% in July over July 2010 and that affordability conditions this year have been the most favorable on record dating back to 1970.
- Historic home prices in the U.S. increased by an average of about half a percentage point per year from 1890 through 2008 when adjusted for inflation.
- The document provides data on active listings, pending sales, absorption rates and other housing market metrics for many towns in central New Jersey in August 2011.
Greater Princeton Area Real Estate Market Ann Harwood
- Housing market data from September 2011 showed existing home sales up 11.3% year-over-year and housing starts increasing 15% from the previous month, indicating an improving housing market.
- Unemployment claims fell for the fourth straight week, suggesting continued labor market recovery.
- Real estate markets are assessed by measuring absorption rates, with rates over 6-7 months indicating price depreciation. Absorption rates from local New Jersey markets in October 2011 showed mixed strength across areas.
Princeton Area Real Estata Data July 8 11Ann Harwood
The document reports on housing market statistics from various towns in central New Jersey, including pending home sales data, home price indices, and absorption rates which indicate the strength of the local real estate market. Tables show the number of active listings, pending sales, and absorption rates for areas like Princeton, West Windsor, Plainsboro and others from June and July 2011.
Historic home prices in the US increased by about 0.5% per year from 1890 to 2008 when adjusted for inflation, but have since settled back to 2003 levels due to economic factors after 2008. Several New Jersey towns are listed with current housing inventory statistics like active listings, pending sales, absorption rates, new listings, and price reductions. Absorption rates above 6 months generally lead to annual home price depreciation.
Greater Princeton NJ Area Real Estate MarketsAnn Harwood
The document provides real estate market data for various towns in New Jersey, including active listings, pending sales, absorption rates, new listings, and price reductions. It finds that absorption rates, or the number of months it would take to sell all active listings, are highest in Princeton Borough at 14.5 months and lowest in Hamilton at 22 months. Real estate is described as local, and absorption rate is identified as the most accurate measure of current market strength.
Greater Princeton NJ Real Estate Market UpdateAnn Harwood
Historic home prices in the US increased by about 0.5% per year on average from 1890 to 2008 after adjusting for inflation. However, since 2008 median home prices have declined and settled back to 2003 levels due to various economic factors. The document then provides data on current and historical housing market conditions in various New Jersey towns, including active listings, pending sales, absorption rates and other metrics.
The document provides real estate market data for various towns in New Jersey, including active listings, pending sales, absorption rates, new listings, and closed sales over the past 30 days. Absorption rates indicate market strength, with rates below 5 months considered a strong seller's market and rates above 6 months a weaker market. Most of the towns listed have absorption rates between 5-6 months, suggesting a normal balanced market currently.
The document discusses real estate market conditions in various towns in central New Jersey. It provides data on the number of active listings, pending sales, and absorption rates for different areas in April 2010. Absorption rates between 5-6 months indicate a normal real estate market. The document also discusses strategies for understanding local real estate markets and factors to consider when buying a home.
# of homes sold, active listings on the market in Cranbury, East Windsor, Ewing, Hamilton, Hopewell, Monroe, Plainsboro, South Brunswick, Princeton, West Windsor
Princeton Area Real Estate Stats October 25thLinda Twining
The document provides real estate data for multiple towns, including active listings, pending sales in the last 30 days, absorption rates in months, new listings in 30 days, net changes to listings, listings reduced, percentages of inventory reduced, expired listings, withdrawn listings, and closed listings. The data is shown broken down by housing type and area for each town.
Princeton Area Real Estate Update5 1 14Ann Harwood
- The document provides market data on housing in various New Jersey towns, including active listings, pending sales, absorption rates, new listings, and price changes. It shows that most towns have absorption rates between 3-12 months, indicating normal or stable housing markets, though a few towns have stronger or weaker rates. Overall, the data suggests that housing markets in New Jersey are stable or improving in many areas.
The document provides real estate data for multiple towns, including active listings, pending sales in the last 30 days, absorption rates, new listings, changes in inventory, expired and withdrawn listings, and closed sales. For most towns, inventory decreased from the beginning to the end of the reported month, with closed sales exceeding new listings. Absorption rates varied widely between property types and towns.
The document provides real estate data for multiple towns, including active listings, pending sales in the last 30 days, absorption rates, new listings, changes in inventory, expired and withdrawn listings, and closed sales. It shows figures for all property styles, condos/townhouses, properties for 55+, and single family homes. Absorption rates varied across areas from less than a month to over 2 years on average. New listings, reductions in inventory, and closed sales shifted markets up or down month-to-month in each town.
The document provides statistics on active listings, pending sales, absorption rates, new listings, and closed sales for various towns over the last 30 days. It shows data for all property styles as well as breakdowns by property type (condo/townhomes, 55+, single family). Absorption rates ranged from under 5 months to over 18 months depending on the town and property type. Most areas saw a net gain in active listings from new listings exceeding closed sales over the period.
The facts are in the data. Know the market and get information that you can't find anywhere else on the web.
Check out my market update and let me know how I can help you with your real estate needs.
The following stats on West Windsor, Lawrence, East Windsor, Ewing, Hopewell, Cranbury, Plainsboro, South Brunswick, Montgomery, Hamilton, Franklin, Princeton Township, Princeton Boro, Robbinsville, Hightstown, Penningtion, and Monroe are provided:
Active Listings
NJ Pending in Last 30 Days
Absorption Rate
New Listings
Net Gain (Loss) to Market
Listings Reduced in 30 Days
% of Inventory Reduced
Expired Listings
Withdrawn Listings
Closed Listings
Greater Princeton NJ Real Estate Markets April 27, 2011Ann Harwood
This document contains market data and analysis for real estate markets in central New Jersey towns from April 2011. It provides information on housing inventory levels, absorption rates (number of months to sell all listings), new and withdrawn listings, price reductions, and closed sales for various housing segments in each town, indicating housing market conditions and trends at that time. Key metrics are compared to normal market thresholds to assess relative market strength. The data aims to help real estate professionals and homeowners understand local real estate market dynamics.
The document provides data on active listings, pending sales, absorption rates, new listings, reductions in listings, expired listings, withdrawn listings, and closed listings for various towns over the last 30 days. It includes breakdowns by property type (all styles, condo/townhomes, 55+, single family). Absorption rates ranged from 1 to 29 months depending on the town and property type. Most towns saw a net gain in active listings from new listings exceeding closed sales.
The document provides real estate data for multiple towns, including active listings, pending sales, absorption rates, new listings, reductions in inventory, expired listings, withdrawn listings, and closed sales over the past 30 days. For most towns, absorption rates ranged from 4 to 30 months, new listings were added while some inventory was reduced, and closed sales typically numbered in the teens to high forties. Absorption rates and percentages of reduced inventory varied more widely across property types within each town.
The facts are in the data. Know the market and get information that you can't find anywhere else on the web. Check out my market update and let me know how I can help you with your real estate needs.
The following stats on West Windsor, Lawrence, East Windsor, Ewing, Hopewell, Cranbury, Plainsboro, South Brunswick, Montgomery, Hamilton, Franklin, Princeton Township, Princeton Boro, Robbinsville, Hightstown, Penningtion, and Monroe are provided:
The document provides real estate data for multiple towns, including active listings, pending sales in the last 30 days, absorption rates in months, new listings, changes in inventory, expired listings, withdrawn listings, and closed listings. For each town, the data is broken down by property type such as single family homes, condos, and homes for those aged 55 and up. Overall, the document contains a detailed snapshot of housing market statistics for various municipalities.
Greater Princeton Area Market Data May 21 10Ann Harwood
According to a survey by Fannie Mae:
- Most consumers still see homeownership as desirable for non-financial reasons like quality of life, though they are more cautious than before.
- While many renters plan to buy, most think it is now harder to get a mortgage than for previous generations.
- The vast majority see strategically defaulting on an underwater mortgage as unacceptable.
Created to give clarity as to the overall market trends, show how 'local' real estate really is and to give strategies for buyers and sellers to make good decisions in a tough market.
The document provides an analysis of the real estate market in 2009, including:
1. It summarizes housing indicators and economic data showing declines in home sales, construction, and rising foreclosure rates.
2. It analyzes real estate market conditions in multiple towns in Mercer County, providing data on inventory levels, sales rates, and forecasts that prices may continue to decline another 5-8% before bottoming out.
3. It emphasizes that the real estate market is local and conditions can vary significantly between different towns.
The document summarizes a real estate market update seminar presented by a Weichert Realtors broker. The seminar covered current market conditions in Princeton and surrounding areas of NJ, including inventory levels, absorption rates, and strategies for buyers and sellers. Recent housing data showed a slowdown in sales and rising inventory due to the expiration of federal tax credits. Absorption rates varied by price range, with higher-priced homes taking longer to sell.
The document summarizes a real estate market update seminar presented by Joshua Wilton of Weichert Realtors Princeton. It provides analysis of the local real estate markets through metrics like inventory levels, absorption rates, pending sales and price ranges. Town-by-town statistics on listings, pending sales and absorption rates are presented to give a picture of current market conditions locally.
The document contains statistical data on real estate listings, pending sales, absorption rates, new listings, price reductions and closed sales for various towns in central New Jersey over the last 30 days. The towns reported include West Windsor, Lawrence, Plainsboro, Cranbury, Ewing, East Windsor, Hopewell Township, Hamilton, Robbinsville, Hightstown, Pennington, Princeton Borough, Princeton Township, South Brunswick, Monroe, Montgomery and Hillsborough.
The document summarizes a real estate market update seminar presented by Joshua Wilton of Weichert Realtors. It analyzes real estate market trends in Princeton and surrounding towns in Mercer County, NJ from 2007-2009. Key points discussed include inventory levels, absorption rates, pending sales, and price ranges showing signs of recovery in more affordable homes.
The document summarizes a real estate market update seminar presented by a Weichert Realtors broker. The seminar covered current market conditions in Princeton and surrounding areas of NJ, including inventory levels, absorption rates, and strategies for buyers and sellers. Recent housing data showed a slowdown in sales and rising inventory due to the expiration of federal tax credits. Absorption rates varied by price range, with higher-priced homes taking longer to sell.
The document provides market activity data for various towns and cities in New Jersey, including active listings, listings under contract, absorption rates (months of inventory), new listings, price reductions, expired/withdrawn listings, and closed sales for the period. Absorption rates ranged from under 1 month to over 18 months depending on the location. Several areas saw gains in active listings while others saw declines. Price reductions occurred in many markets. Overall the data suggests some markets remain tighter than others.
This document summarizes a real estate market update and forecast seminar presented by Joshua Wilton of Weichert Realtors Princeton. The seminar agenda included a history of the local real estate market, a 2012 market forecast, and strategies for buying and selling. Key points from the market history included an increase in home listings from 2010 to 2009 across several NJ/PA counties and historically low interest rates in 2011-2012. The forecast predicted continued low supply and high demand driving the market.
This document summarizes a real estate market update and forecast seminar presented by Joshua D Wilton of Weichert Realtors Princeton, NJ. The summary includes:
1. A brief history of the local real estate market over the past 4 years showing an increase in homes for sale.
2. Current market conditions including historically low interest rates and a housing affordability index over 100, indicating buyers have more than enough money for a median home.
3. A forecast that supply will continue to exceed demand in the long term due to a decline in housing permits since 2000 and steady population growth in Mercer County.
The document summarizes a real estate market update and forecast seminar for the Princeton and Greater Princeton, NJ area. It discusses the state of the local housing market in 2010, forecasts modest growth for 2011, and provides strategies for buying and selling real estate based on current supply and demand trends in local towns.
The document analyzes housing market trends in Princeton Township, NJ as of July 19, 2009. It provides data on active listings, pending sales, absorption rates, new listings, price reductions, and closed sales for Princeton Township overall and for condo/townhouses and single family homes separately. Absorption rates above 6 months are said to negatively impact property values. Absorption rates varied by price point, with higher prices having fewer pending sales and longer absorption rates.
This document contains real estate data for multiple towns in Lawrenceville, West Windsor, and Ewing for the week of May 16, 2011. It provides information on active listings, pending sales, absorption rates, new listings, changes to inventory, price reductions, expired listings, withdrawn listings, and closed sales broken down by property type and town.
The document provides real estate data for the towns of Lawrenceville, West Windsor, and Ewing for the week of June 20, 2011. It includes information on active listings, pending sales in the last 30 days, months of inventory, new and closed listings, as well as other metrics for all property styles and subsets of condos, townhomes, and single family homes in each town.
Similar to Greater Princeton Market Update June 29 2010 (11)
Home prices rose 4.6% in 2012 and are forecasted to rise 3% in 2013. The jobs report showed gains of 1.86 million new jobs in 2012 while the unemployment rate remained unchanged at 7.8%. Residential construction spending rose 13.6% in the last four quarters, the most rapid rise since 1994, indicating increased confidence in the housing market. Several New Jersey counties saw increases in home sales and average sale prices in 2012 compared to 2011, with inventory levels decreasing. Absorption rates, a key measure of market strength, were within a normal range of 5-6 months for most areas analyzed.
Greater Princeton NJ Real Estate Market October 2012Ann Harwood
The document discusses signs that the housing market is improving with home prices and sales up in many areas along with declining inventory and interest rates near historic lows. It also provides statistics on housing market absorption rates in various towns to assess the strength and balance of supply and demand. The Federal Reserve is continuing efforts to boost the recovery through mortgage-backed security purchases and keeping interest rates low.
Greater Princeton NJ Real Estate UpdateAnn Harwood
1) Housing market confidence is increasing as home sales, prices, and construction are up across most major cities in the US.
2) Inventory levels are decreasing, indicating a balanced market that favors both buyers and sellers.
3) Economic indicators point to an ongoing recovery in the housing market in 2012.
- Home prices increased for the first time since 2007 and housing starts were up 23.4% from a year ago, showing signs the housing market is improving.
- Unemployment claims were down and the four-week moving average decreased, indicating strength in the labor market.
- Real estate professionals report an increase in home contract signings for the 13th consecutive month, with total sales expected to be up 9-10% for 2012.
Princeton Area Sold homes July thru Dec 2010Ann Harwood
The document provides a list of home sales that took place between July 1, 2010 and December 31, 2010 in Mercer County, New Jersey municipalities including Princeton Borough, Princeton Township, Pennington Borough, and Hopewell Borough. Over 100 individual home sales are listed with the address, original list price, and sold price for each property.
This document provides a list of homes sold in West Windsor, NJ between January 1, 2010 and June 30, 2010. It includes the address, list price, sold price, and number of days each home was on the market. There are over 150 properties listed with prices ranging from $210,000 to over $1 million. Most homes sold for close to the list price and were on the market for less than 100 days.
Storytelling is an incredibly valuable tool to share data and information. To get the most impact from stories there are a number of key ingredients. These are based on science and human nature. Using these elements in a story you can deliver information impactfully, ensure action and drive change.
Best Competitive Marble Pricing in Dubai - ☎ 9928909666Stone Art Hub
Stone Art Hub offers the best competitive Marble Pricing in Dubai, ensuring affordability without compromising quality. With a wide range of exquisite marble options to choose from, you can enhance your spaces with elegance and sophistication. For inquiries or orders, contact us at ☎ 9928909666. Experience luxury at unbeatable prices.
Digital Marketing with a Focus on Sustainabilitysssourabhsharma
Digital Marketing best practices including influencer marketing, content creators, and omnichannel marketing for Sustainable Brands at the Sustainable Cosmetics Summit 2024 in New York
Best practices for project execution and deliveryCLIVE MINCHIN
A select set of project management best practices to keep your project on-track, on-cost and aligned to scope. Many firms have don't have the necessary skills, diligence, methods and oversight of their projects; this leads to slippage, higher costs and longer timeframes. Often firms have a history of projects that simply failed to move the needle. These best practices will help your firm avoid these pitfalls but they require fortitude to apply.
❼❷⓿❺❻❷❽❷❼❽ Dpboss Matka Result Satta Matka Guessing Satta Fix jodi Kalyan Final ank Satta Matka Dpbos Final ank Satta Matta Matka 143 Kalyan Matka Guessing Final Matka Final ank Today Matka 420 Satta Batta Satta 143 Kalyan Chart Main Bazar Chart vip Matka Guessing Dpboss 143 Guessing Kalyan night
The 10 Most Influential Leaders Guiding Corporate Evolution, 2024.pdfthesiliconleaders
In the recent edition, The 10 Most Influential Leaders Guiding Corporate Evolution, 2024, The Silicon Leaders magazine gladly features Dejan Štancer, President of the Global Chamber of Business Leaders (GCBL), along with other leaders.
3 Simple Steps To Buy Verified Payoneer Account In 2024SEOSMMEARTH
Buy Verified Payoneer Account: Quick and Secure Way to Receive Payments
Buy Verified Payoneer Account With 100% secure documents, [ USA, UK, CA ]. Are you looking for a reliable and safe way to receive payments online? Then you need buy verified Payoneer account ! Payoneer is a global payment platform that allows businesses and individuals to send and receive money in over 200 countries.
If You Want To More Information just Contact Now:
Skype: SEOSMMEARTH
Telegram: @seosmmearth
Gmail: seosmmearth@gmail.com
𝐔𝐧𝐯𝐞𝐢𝐥 𝐭𝐡𝐞 𝐅𝐮𝐭𝐮𝐫𝐞 𝐨𝐟 𝐄𝐧𝐞𝐫𝐠𝐲 𝐄𝐟𝐟𝐢𝐜𝐢𝐞𝐧𝐜𝐲 𝐰𝐢𝐭𝐡 𝐍𝐄𝐖𝐍𝐓𝐈𝐃𝐄’𝐬 𝐋𝐚𝐭𝐞𝐬𝐭 𝐎𝐟𝐟𝐞𝐫𝐢𝐧𝐠𝐬
Explore the details in our newly released product manual, which showcases NEWNTIDE's advanced heat pump technologies. Delve into our energy-efficient and eco-friendly solutions tailored for diverse global markets.
Top mailing list providers in the USA.pptxJeremyPeirce1
Discover the top mailing list providers in the USA, offering targeted lists, segmentation, and analytics to optimize your marketing campaigns and drive engagement.
IMPACT Silver is a pure silver zinc producer with over $260 million in revenue since 2008 and a large 100% owned 210km Mexico land package - 2024 catalysts includes new 14% grade zinc Plomosas mine and 20,000m of fully funded exploration drilling.
Zodiac Signs and Food Preferences_ What Your Sign Says About Your Tastemy Pandit
Know what your zodiac sign says about your taste in food! Explore how the 12 zodiac signs influence your culinary preferences with insights from MyPandit. Dive into astrology and flavors!
At Techbox Square, in Singapore, we're not just creative web designers and developers, we're the driving force behind your brand identity. Contact us today.
Part 2 Deep Dive: Navigating the 2024 Slowdownjeffkluth1
Introduction
The global retail industry has weathered numerous storms, with the financial crisis of 2008 serving as a poignant reminder of the sector's resilience and adaptability. However, as we navigate the complex landscape of 2024, retailers face a unique set of challenges that demand innovative strategies and a fundamental shift in mindset. This white paper contrasts the impact of the 2008 recession on the retail sector with the current headwinds retailers are grappling with, while offering a comprehensive roadmap for success in this new paradigm.
How MJ Global Leads the Packaging Industry.pdfMJ Global
MJ Global's success in staying ahead of the curve in the packaging industry is a testament to its dedication to innovation, sustainability, and customer-centricity. By embracing technological advancements, leading in eco-friendly solutions, collaborating with industry leaders, and adapting to evolving consumer preferences, MJ Global continues to set new standards in the packaging sector.
The APCO Geopolitical Radar - Q3 2024 The Global Operating Environment for Bu...APCO
The Radar reflects input from APCO’s teams located around the world. It distils a host of interconnected events and trends into insights to inform operational and strategic decisions. Issues covered in this edition include:
The APCO Geopolitical Radar - Q3 2024 The Global Operating Environment for Bu...
Greater Princeton Market Update June 29 2010
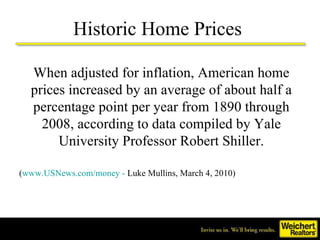
1. Historic Home Prices When adjusted for inflation, American home prices increased by an average of about half a percentage point per year from 1890 through 2008, according to data compiled by Yale University Professor Robert Shiller. ( www.USNews.com/money - Luke Mullins, March 4, 2010)
2. Home Prices Now Now, however, as a result of many economic factors since 2008, the median American home prices have settled back to 2003 levels. Source: Case Schiller Non-Seasonally Adjusted Composite 20 U.S. Home Price Index as of March 2010
3. 1. Real Estate is Local Top Five Rules for Understanding the Real Estate Market: 2. Real Estate is Local 3. Real Estate is Local 4. Real Estate is Local 5. Real Estate is Local
5. Market Absorption Scale (Absorption Rate in Months) 5-6 months absorption rate indicates a normal market.
6. Sample Market Absorption Rate 100 current active listings 4 reported sales in last 30 days = 25 Months’ absorption rate Anytown., NJ 5-6 Months Market Absorption Rate indicates a normal market.
7. Market Scale for Supply & Demand High Supply/Low Demand Low Supply/High Demand Normal Weichert has been studying market conditions for more than 3 decades and has found a direct correlation between market absorption and property values. As absorption rates increase beyond a normal market level of 5-6 months, property values depreciate annually. Market Absorption in Months 1 2 3 4 5 6 7 8 9 10 11 12 Normal
8. 6/21/10 Towns Active Listings Pending in Last 30 Days Absorption Rate in Months New Listings in 30 Days Net Gain (Loss) to Market Listings Reduced in 30 Days % of Invent. Reduced Expired Listings W/drawn Listings Closed Listings Princeton Boro: All Styles 55 1 55 9 5 11 20% 1 2 6 Pton -Boro Condo/ Thouses 19 0 99 3 1 7 36.8% 1 1 3 Pton-Boro Single Family 36 1 36 6 4 4 11.1% 0 1 3 Pton Twp: All Styles 142 11 12.9 23 4 24 16.9% 3 5 20 Pton Twp: Condo/ Thouses 11 2 5.5 3 1 2 18.2% 0 0 6 Pton Twp: Single Family 131 9 14.6 20 5 22 16.8% 3 5 14
9. 6/21/10 Towns Active Listings Pending in Last 30 Days Absorption Rate in Months New Listings in 30 Days Net Gain (Loss) to Market Li1stings Reduced in 30 Days % of Invent. Reduced Expired Listings W/drawn Listings Closed Listings West Windsor: All Styles 160 15 10.7 42 18 44 27.5% 4 5 33 West Windsor Condo/ T.Houses 26 3 8.7 6 1 14 53.8% 2 0 15 West Windsor 55+ 12 3 4 2 -1 - -- 0 0 2 West Windsor Single Family 122 9 13.6 34 18 30 24.5% 2 5 16 Lawrence: All Styles 254 13 19.5 52 24 50 19.7% 5 10 36 Lawrence: Condo/ THouses 72 6 12 17 6 21 29.2% 2 3 11 Lawrence: 55+ 27 0 99 5 4 - -- 0 1 3 Lawrence: Single Family 155 7 22.1 30 14 29 18.7% 3 6 22
10. 6/21/10 Towns Active Listings Pending in Last 30 Days Absorption Rate in Months New Listings in 30 Days Net Gain (Loss) to Market Listings Reduced in 30 Days % of Invent. Reduced Expired Listings W/drawn Listings Closed Listings PlainsboroAll Styles 84 11 7.3 31 20 10 12% 6 1 19 Plainsboro Condo/ THouses 40 5 8 10 5 4 10% 5 0 11 Plainsboro 55+ 18 0 99 5 5 1 5% 0 0 0 Plainsboro Single Family 26 6 4.3 13 7 5 19% 1 1 8 Cranbury: All Styles 23 4 5.75 2 -2 6 26% 3 0 5 Cranbury: 55+ 1 2 .5 0 2 1 100% 0 0 0 Cranbury: Single Family 22 2 11 2 0 5 23% 3 0 5
11. 6/21/10 Towns Active Listings Pending in Last 30 Days Absorption Rate in Months New Listings in 30 Days Net Gain (Loss) to Market Listings Reduced in 30 Days % of Invent. Reduced Expired Listings W/drawn Listings Closed Listings Ewing: All Styles 284 15 18.9 49 12 58 20.4 15 7 35 Ewing : Condo/ T.Houses 43 2 22.5 6 1 5 11.6 2 1 9 Ewing 55+: 9 0 99 2 2 - -- 0 0 0 Ewing: Single Family 232 13 17.8 41 9 53 22.8 13 6 26 East Windsor: All Styles 210 5 42 43 20 42 20% 9 9 19 East Windsor: Condo/ THouses 117 1 117 26 13 21 17.9% 8 4 6 East Windsor: 55+ 20 2 10 2 -2 - -- 0 2 0 East Windsor: Single Family 73 2 36.5 15 9 21 28.8% 1 3 13
12. 6/21/10 Towns Active Listings Pending in Last 30 Days Absorption Rate in Months New Listings in 30 Days Net Gain (Loss) to Market Listings Reduced in 30 Days % of Invent. Reduced Expired Listings W/drawn Listings Closed Listings Hopewell Twp. All Styles 186 27 7 31 4 57 31% 11 8 24 Hopewell Twp. Condo/ T.Houses 18 5 3.6 3 (2) 5 28% 1 0 7 Hopewell Twp.: 55+ 9 3 3 - - - - - - - Hopewell Twp Single Family 159 19 8 28 9 52 33% 10 8 17 Hamilton: All Styles 638 51 13 120 69 170 27% 40 18 81 Hamilton: Condo/ THouses 110 15 7 24 9 32 29% 13 5 24 Hamilton: Single Family 483 35 14 96 61 138 29% 27 13 57 Hamilton: 55+ 45 1 45 - - - - - -
13. 6/21/10 Towns Active Listings Pending in Last 30 Days Absorption Rate in Months New Listings in 30 Days Net Gain (Loss) to Market Listings Reduced in 30 Days % of Invent. Reduced Expired Listings W/drawn Listings Closed Listings Robbinsville All Styles 146 18 8 35 17 32 22% 4 9 19 Robbinsville Condo/ T.Houses 78 10 7.8 20 10 14 18% 2 4 14 Single Family 68 8 8.5 15 7 18 26% 2 5 5 Hightstown Boro: All Styles 79 6 13 13 7 14 18% 5 5 5 Pennington 27 2 13.5 2 0 10 37% 0 2 3 Hopewell Boro 24 1 24 5 4 5 21% 1 1 2
14. 6/21/10 Towns Active Listings Pending in Last 30 Days Absorption Rate in Months New Listings in 30 Days Net Gain (Loss) to Market Listings Reduced in 30 Days % of Invent. Reduced Expired Listings W/drawn Listings Closed Listings South Brunswick All Styles 222 20 11.1 43 23 25 11% 17 4 30 South BrunswickCondo/ T.Houses 68 11 6.2 20 9 19 28% 7 1 13 South Brunswick 55+ 30 0 99 6 6 1 3% 1 2 0 South Brunswick Single Family 124 15 8.3 17 2 15 12% 9 1 17 Monroe: All Styles 479 50 9.6 116 66 114 24% 40 2 52 Monroe: 55+ 307 30 10.2 82 52 59 19% 23 0 38 Monroe: Single Family 172 20 8.6 34 14 55 32% 17 2 14
15. 6/21/10 Towns Active Listings Pending in Last 30 Days Absorption Rate in Months New Listings in 30 Days Net Gain (Loss) to Market Listings Reduced in 30 Days % of Invent. Reduced Expired Listings W/drawn Listings Closed Listings Montgomery All Styles 158 17 9 37 (10) 48 30% 6 11 30 Montgomery Condo/Twnhms 24 2 12 7 (6) 5 21% 1 4 8 Single Family 134 15 9 30 (4) 43 32% 5 7 22 Hillsborough All Styles 248 23 11 55 13 39 16% 5 7 30 Hillsborough Condo/Twnhms 95 6 16 20 6 15 16% 0 3 11 Hillsborough Single Family 153 17 9 35 7 24 23% 5 4 19
16. Fed Drives Rates to Record Lows! Source: Weichert, Realtors Financial Services Over the past few weeks, interest rates have hit the lowest point since official tracking began in 1969—hitting 4.75% for 30-year fixed rate mortgages with no points, and 3.875% for 15-year fixed rate mortgages with 1 point.
17. What happens now? These historically low mortgage interest rates, lower home prices, and a good number of homes to choose from, combined with recovering labor markets should revive sales and housing starts once the recent dip owing to the expiration of the Federal homebuyer tax credit is behind us.
18. Strategies to Buy: Understand the complete financial picture—the mortgage-interest tax deduction, the real estate tax deduction, appreciating home value over time— when buying a home.
Editor's Notes
(elicit responses)
Review the generic sample calculation and/or a customized calculation you prepared for your office market area. Follow the instructions below to update this slide with customized information for your office. Save the Sales Meeting Guide presentation to your C drive. Open the Sales Meeting Guide presentation from your C drive. Scroll down to the “Sample Market Absorption Rate” slide in the weekly training section of the presentation. Double-click on the slide to be able to make edits. Click in each section of the formula to edit text. Save the document to save edits.
Populate this table to show the local absorption rate in the various price ranges that are appropriate for your market area. Please add or delete rows as necessary to adequately reflect local conditions.
Create your own table to approach the aspects of the marketplace that you consider most relevant and valuable to your associates. For ideas on what to cover, refer to the tables in the Planning Day Presentation on your Planning Day 2005 CD. For example, you might discuss the market conditions of different communities or price ranges each week.