Download to read offline


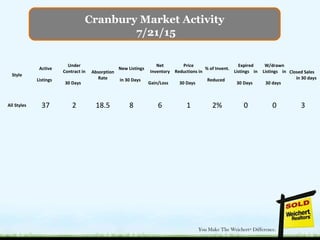


The document provides market activity data for various towns and cities in New Jersey, including active listings, listings under contract, absorption rates (months of inventory), new listings, price reductions, expired/withdrawn listings, and closed sales for the period. Absorption rates ranged from under 1 month to over 18 months depending on the location. Several areas saw gains in active listings while others saw declines. Price reductions occurred in many markets. Overall the data suggests some markets remain tighter than others.


