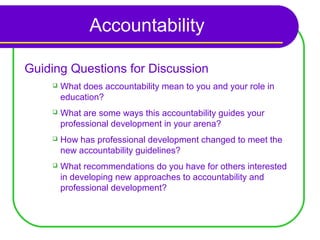
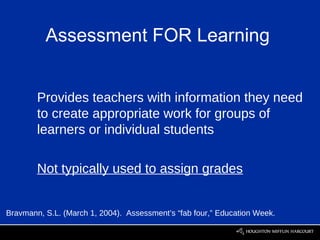
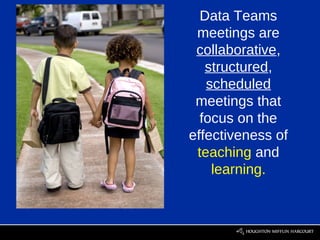
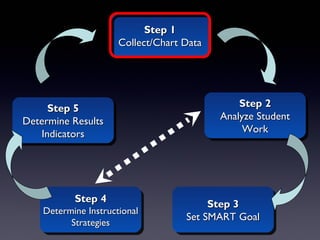
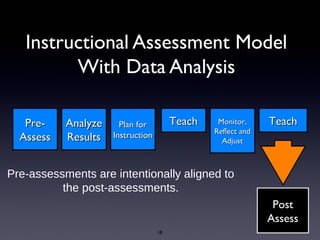
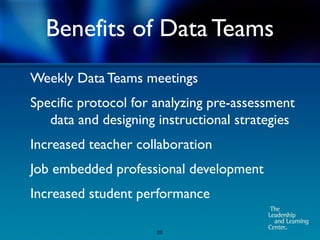
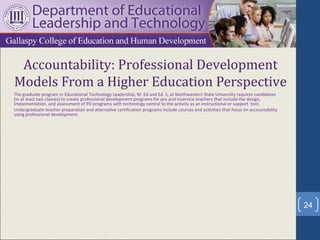
Teaching and Leading in a
Globally Connected Learning
Environment
Backchannel

 Participation

 http://todaysmeet.com/LACUE-SITE-2013
Accountability


Moderator: Colleen Charles
  LACUE   President
  Director of Instructional Technology St.

  Charles Parish Public Schools, LA
Accountability


Panelist: Ajit Pethe
   PrincipalLuling Elementary School
    St. Charles Parish Public Schools, LA
   Data Teams
Accountability

Panelist: Dr. Ron McBride
    SITE Conference Program Chair
    SITE VP C

    Co-Chair of the Information Technology

     Council
    Northwestern State University, Retired
Accountability


Panelist: Dr. Jason Mixon
    Directorof Online Doctoral Studies,
     Lamar University, TX
    Consultant, Texas Education Agency
Accountability

Guiding Questions for Discussion
       What does accountability mean to you and your role in
        education?
       What are some ways this accountability guides your
        professional development in your arena?
       How has professional development changed to meet the
        new accountability guidelines?
       What recommendations do you have for others interested
        in developing new approaches to accountability and
        professional development?
Data Teams

The Key to Quality School Improvement
Data Teams are small, grade-level,
department, course-alike, or organizational
teams that examine work generated from a
     common formative assessment.
Data Team Example            Elementary
                              Elementary
                               Grade 3
                               Grade 3

                         Common standard:
                         Common standard:
                            Reading
                             Reading
  Grade 3 Teacher
  Grade 3 Teacher
                         Common assessment:
                         Common assessment:
                          Literary response,
                           Literary response,
                          written response,
                           written response,
  Grade 3 Teacher
  Grade 3 Teacher      written prompt that asks
                       written prompt that asks
                       readers to take aacritical
                        readers to take critical
                                stance
                                 stance
  Grade 3 Teacher
  Grade 3 Teacher            Scoring guide:
                              Scoring guide:
                       Literary response rubric
                        Literary response rubric


  Special Education
   Special Education
Data Teams focus only on Power Standards.
Guiding Questions for Identifying
        Power Standards
What do my students need for success in
life? (L)

What do my students need for success in
school? (S)

What do my students need for success on
the state test (or other appropriate
assessments?) (ST)
                    12
Assessments
Assessment FOR Learning


        Provides teachers with information they need
        to create appropriate work for groups of
        learners or individual students

        Not typically used to assign grades


Bravmann, S.L. (March 1, 2004). Assessment’s “fab four,” Education Week.
Data Teams
 meetings are
 collaborative,
   structured,
   scheduled
 meetings that
  focus on the
effectiveness of
 teaching and
    learning.
The Data Teams
    Process
Step 1
                           Step 1
                     Collect/Chart Data
                     Collect/Chart Data


     Step 5                                   Step 2
                                              Step 2
      Step 5
Determine Results                         Analyze Student
                                          Analyze Student
Determine Results
   Indicators                                  Work
                                               Work
    Indicators


           Step 4
           Step 4                       Step 3
                                         Step 3
    Determine Instructional
    Determine Instructional        Set SMART Goal
                                    Set SMART Goal
          Strategies
           Strategies
Instructional Assessment Model
         With Data Analysis

   Pre-    Analyze     Plan for         Teach    Monitor,     Teach
                                                Reflect and
  Assess   Results   Instruction
                                                  Adjust


Pre-assessments are intentionally aligned to
          the post-assessments.
                                                               Post
                                                              Assess
                                   18
Luling’s Implementation of Data
                 Teams
2010-2011 – Pilot program in 3rd grade math
2011-2012 – Full implementation for K-5 math
   - Modified Data Teams process for math facts
2012-2013 – Pilot program in 3rd-5th grade ELA
   - Modified Data Teams process for sight words
   in K-2


                        19
Benefits of Data Teams
Weekly Data Teams meetings
Specific protocol for analyzing pre-assessment
   data and designing instructional strategies
Increased teacher collaboration
Job embedded professional development
Increased student performance

                      20
Increased Student Performance on
            Math Facts
Over 85% of 4th and 5th graders proficient on math
   facts (four operations mixed)
Over 80% of 1st and 2nd graders proficient on mixed
   addition/subtraction math facts
61% of kindergarten students currently proficient on
   mixed addition/subtraction math facts
52% of 3rd graders currently proficient on mixed
   multiplication/division math facts
                         21
Increased Student Performance on
        Standardized Tests
Increased retention of math skills from one year to the next
Year 1 increase of math NPR scores for 2nd, 3rd, 5th grades from
    previous year
Students in math pilot program from 2010-2011 for 3rd grade
    iLEAP

-   6 percentage point increase for Basic and above from
    previous year

-   8 percentage point increase for Mastery and above from
    previous year
                              22
Increased Student Performance on
        Standardized Tests
Students in math pilot program from 2010-2011 for 4th grade
    LEAP

-   10 percentage point increase for Basic and above from
    previous year

-   7 percentage point increase for Mastery and above from
    previous year

-   7 percentage point increase for Advanced from previous
    year

-   Longitudinal score increase from 3rd grade iLEAP to 4th
    grade LEAP
                             23
Accountability: Professional Development
Models From a Higher Education Perspective
The graduate program in Educational Technology Leadership, M. Ed and Ed. S, at Northwestern State University requires candidates
(in at least two classes) to create professional development programs for pre and inservice teachers that include the design,
implementation, and assessment of PD programs with technology central to the activity as an instructional or support tool.
Undergraduate teacher preparation and alternative certification programs include courses and activities that focus on accountability
using professional development.


                                                                                                                                       24
Professional Development Models
The research is flush with professional development models.
Many are based upon the structure of delivery rather than
outcome. Some include online delivery, blended learning,
mobile delivery (cell technology and social networks), and
the use of theoretical frameworks where teachers are placed
in an environment that seeks specific outcomes rather than
measures affective data such as attitude. PD models should
foster a paradigm shift where teachers “choose” to use
technology rather than to “just oblige” district requirements.

                                                                 25
Accountability for Professional Development
   Programs Using the Relevance Factor


                                              26
A Model for Accountability In Professional
Development                           Observed
                                                 benefits via test
       Perceived value                           scores/student
       of professional                           achievement
       development
                          Teacher
                          accountability:
                          evaluating
    Willingness to        effectiveness
                                            Perceived level
    participate as a
                                            of support using
    volunteer
                                            technology

                         Self-efficacy
                         using technology
                         in teaching                                 27
Lessons learned by administrators and teacher
      mentors promoting professional development
1.    Promote an attitude of acceptance, ownership and collaboration
2.    Promote a “collective vision” where teachers endorse professional
      development and support its use as a tool for teacher accountability
3.    Include authentic activities that are relevant
4.    Foster self-efficacy by supporting teachers who are reluctant to
      embrace technology
5.    Develop and use a system-wide evaluation tool that is fair and equitable
6.    Provide teachers with the opportunity to evaluate peers and conduct
      self-evaluation of their PD experience
7.    Constantly revise…no system is perfect and accountability procedures       28
      will change
Professional Learning Communities:
An Evolution to Continuous Inquiry
           for Teachers


   Dr. Jason R. Mixon-Director of Doctoral Programs in
        Educational Leadership at Lamar University
   Consultant for Texas Education Agency and United
             States Department of Education
Professional Learning Communities
 Although there is no universal definition of a PLC (Stoll et al., 2006; Williams, Brien, Sprague,
 & Sullivan, 2008), the following definitions offer a range of ways to describe a PLC:
 An ongoing process through which teachers and administrators work collaboratively to seek
 and share learning and to act on their learning, their goal being to enhance their
 effectiveness as professionals for students’ benefit (Hord, 1997)


 A school culture that recognizes and capitalizes on the collective strengths and talents of the
 staff (Protheroe, 2008).


 A strategy to increase student achievement by creating a collaborative school culture
 focused on learning (Feger & Arruda, 2008).

 Team members who regularly collaborate toward continued improvement in meeting learner
 needs through a shared curricular-focused vision (Reichstetter, 2006).
A group of people sharing and critically interrogating their practice in an ongoing, reflective,
   collaborative, inclusive learning-oriented and growth-promoting way (McREL, 2003).


   Educators committed to working collaboratively in ongoing processes of collective inquiry
   and action research to achieve better results for the students they serve (DuFour, DuFour,
   Eaker, & Many, 2006).


   An inclusive group of people, motivated by a shared learning vision, who support and work
   with each other to inquire on their practice and together learn new and better approaches to
   enhance student learning (Stoll, Bolam, McMahon, Thomas, Wallace, Greenwood et al.,
   2005).

As you can see from the definitions and the red words that are highlighted the work of
    Professional Learning Communities should be more about process and not as
    much about product. This fact contradicts how teachers are evaluated in many
    districts.
Characteristics of PLC
• Shared Values and Vision
• Collaborative Culture
• Focus on examining outcomes to improve
   student learning
• Supportive and shared leadership
• Shared personal practice
-The Center for Comprehensive School Reform and Improvement
Process versus Product
Staff development is often viewed so much from the product end and not the
   process end. They are not continuums but instead are embedded
   together in personal growth.

Process- a continuous action, operation, or series of changes taking place in a
   definite manner.

Product-a person or thing produced by or resulting from a process, as a
   natural, social, or historical one; result.

A focus is needed for organizations to examine both product and process in a
   more critical manner and one way to do that is through Professional
   Learning Communities.
Accountability in the Continuous
              Inquiry Process
•   Value-added assessments need to be implemented within the evaluation
    process for teachers (We have them for students).
•   Virtual Professional Learning Communities as an option of sharing
    personal practices to complement the on campus meetings.
•   Eportfolios for teachers to garner artifacts of the process versus the
    product.
•   Self-evaluations done by the teachers and Staff Development Plans
    developed from the teacher to the principal.
•   Staff development plans for the campus generated from the self-
    evaluations done throughout the year.
•   Electronic journals to capture continuous inquiry throughout the year and
    turn these in as part of the evaluation process for teachers.
Contact Information
• Dr. Jason R. Mixon
  Director of Doctoral Programs in Ed.
  Leadership
  jason.mixon@lamar.edu
  903-353-5504 (cell)
  409-880-7362 (office)

Lacuesite 2013 accountability

  • 1.
    Teaching and Leadingin a Globally Connected Learning Environment
  • 2.
  • 3.
    Accountability Moderator: Colleen Charles LACUE President Director of Instructional Technology St. Charles Parish Public Schools, LA
  • 4.
    Accountability Panelist: Ajit Pethe  PrincipalLuling Elementary School St. Charles Parish Public Schools, LA  Data Teams
  • 5.
    Accountability Panelist: Dr. RonMcBride  SITE Conference Program Chair  SITE VP C  Co-Chair of the Information Technology Council  Northwestern State University, Retired
  • 6.
    Accountability Panelist: Dr. JasonMixon  Directorof Online Doctoral Studies, Lamar University, TX  Consultant, Texas Education Agency
  • 7.
    Accountability Guiding Questions forDiscussion  What does accountability mean to you and your role in education?  What are some ways this accountability guides your professional development in your arena?  How has professional development changed to meet the new accountability guidelines?  What recommendations do you have for others interested in developing new approaches to accountability and professional development?
  • 8.
    Data Teams The Keyto Quality School Improvement
  • 9.
    Data Teams aresmall, grade-level, department, course-alike, or organizational teams that examine work generated from a common formative assessment.
  • 10.
    Data Team Example Elementary Elementary Grade 3 Grade 3 Common standard: Common standard: Reading Reading Grade 3 Teacher Grade 3 Teacher Common assessment: Common assessment: Literary response, Literary response, written response, written response, Grade 3 Teacher Grade 3 Teacher written prompt that asks written prompt that asks readers to take aacritical readers to take critical stance stance Grade 3 Teacher Grade 3 Teacher Scoring guide: Scoring guide: Literary response rubric Literary response rubric Special Education Special Education
  • 11.
    Data Teams focusonly on Power Standards.
  • 12.
    Guiding Questions forIdentifying Power Standards What do my students need for success in life? (L) What do my students need for success in school? (S) What do my students need for success on the state test (or other appropriate assessments?) (ST) 12
  • 13.
  • 14.
    Assessment FOR Learning Provides teachers with information they need to create appropriate work for groups of learners or individual students Not typically used to assign grades Bravmann, S.L. (March 1, 2004). Assessment’s “fab four,” Education Week.
  • 15.
    Data Teams meetingsare collaborative, structured, scheduled meetings that focus on the effectiveness of teaching and learning.
  • 16.
  • 17.
    Step 1 Step 1 Collect/Chart Data Collect/Chart Data Step 5 Step 2 Step 2 Step 5 Determine Results Analyze Student Analyze Student Determine Results Indicators Work Work Indicators Step 4 Step 4 Step 3 Step 3 Determine Instructional Determine Instructional Set SMART Goal Set SMART Goal Strategies Strategies
  • 18.
    Instructional Assessment Model With Data Analysis Pre- Analyze Plan for Teach Monitor, Teach Reflect and Assess Results Instruction Adjust Pre-assessments are intentionally aligned to the post-assessments. Post Assess 18
  • 19.
    Luling’s Implementation ofData Teams 2010-2011 – Pilot program in 3rd grade math 2011-2012 – Full implementation for K-5 math - Modified Data Teams process for math facts 2012-2013 – Pilot program in 3rd-5th grade ELA - Modified Data Teams process for sight words in K-2 19
  • 20.
    Benefits of DataTeams Weekly Data Teams meetings Specific protocol for analyzing pre-assessment data and designing instructional strategies Increased teacher collaboration Job embedded professional development Increased student performance 20
  • 21.
    Increased Student Performanceon Math Facts Over 85% of 4th and 5th graders proficient on math facts (four operations mixed) Over 80% of 1st and 2nd graders proficient on mixed addition/subtraction math facts 61% of kindergarten students currently proficient on mixed addition/subtraction math facts 52% of 3rd graders currently proficient on mixed multiplication/division math facts 21
  • 22.
    Increased Student Performanceon Standardized Tests Increased retention of math skills from one year to the next Year 1 increase of math NPR scores for 2nd, 3rd, 5th grades from previous year Students in math pilot program from 2010-2011 for 3rd grade iLEAP - 6 percentage point increase for Basic and above from previous year - 8 percentage point increase for Mastery and above from previous year 22
  • 23.
    Increased Student Performanceon Standardized Tests Students in math pilot program from 2010-2011 for 4th grade LEAP - 10 percentage point increase for Basic and above from previous year - 7 percentage point increase for Mastery and above from previous year - 7 percentage point increase for Advanced from previous year - Longitudinal score increase from 3rd grade iLEAP to 4th grade LEAP 23
  • 24.
    Accountability: Professional Development ModelsFrom a Higher Education Perspective The graduate program in Educational Technology Leadership, M. Ed and Ed. S, at Northwestern State University requires candidates (in at least two classes) to create professional development programs for pre and inservice teachers that include the design, implementation, and assessment of PD programs with technology central to the activity as an instructional or support tool. Undergraduate teacher preparation and alternative certification programs include courses and activities that focus on accountability using professional development. 24
  • 25.
    Professional Development Models Theresearch is flush with professional development models. Many are based upon the structure of delivery rather than outcome. Some include online delivery, blended learning, mobile delivery (cell technology and social networks), and the use of theoretical frameworks where teachers are placed in an environment that seeks specific outcomes rather than measures affective data such as attitude. PD models should foster a paradigm shift where teachers “choose” to use technology rather than to “just oblige” district requirements. 25
  • 26.
    Accountability for ProfessionalDevelopment Programs Using the Relevance Factor 26
  • 27.
    A Model forAccountability In Professional Development Observed benefits via test Perceived value scores/student of professional achievement development Teacher accountability: evaluating Willingness to effectiveness Perceived level participate as a of support using volunteer technology Self-efficacy using technology in teaching 27
  • 28.
    Lessons learned byadministrators and teacher mentors promoting professional development 1. Promote an attitude of acceptance, ownership and collaboration 2. Promote a “collective vision” where teachers endorse professional development and support its use as a tool for teacher accountability 3. Include authentic activities that are relevant 4. Foster self-efficacy by supporting teachers who are reluctant to embrace technology 5. Develop and use a system-wide evaluation tool that is fair and equitable 6. Provide teachers with the opportunity to evaluate peers and conduct self-evaluation of their PD experience 7. Constantly revise…no system is perfect and accountability procedures 28 will change
  • 29.
    Professional Learning Communities: AnEvolution to Continuous Inquiry for Teachers Dr. Jason R. Mixon-Director of Doctoral Programs in Educational Leadership at Lamar University Consultant for Texas Education Agency and United States Department of Education
  • 30.
    Professional Learning Communities Although there is no universal definition of a PLC (Stoll et al., 2006; Williams, Brien, Sprague, & Sullivan, 2008), the following definitions offer a range of ways to describe a PLC: An ongoing process through which teachers and administrators work collaboratively to seek and share learning and to act on their learning, their goal being to enhance their effectiveness as professionals for students’ benefit (Hord, 1997) A school culture that recognizes and capitalizes on the collective strengths and talents of the staff (Protheroe, 2008). A strategy to increase student achievement by creating a collaborative school culture focused on learning (Feger & Arruda, 2008). Team members who regularly collaborate toward continued improvement in meeting learner needs through a shared curricular-focused vision (Reichstetter, 2006).
  • 31.
    A group ofpeople sharing and critically interrogating their practice in an ongoing, reflective, collaborative, inclusive learning-oriented and growth-promoting way (McREL, 2003). Educators committed to working collaboratively in ongoing processes of collective inquiry and action research to achieve better results for the students they serve (DuFour, DuFour, Eaker, & Many, 2006). An inclusive group of people, motivated by a shared learning vision, who support and work with each other to inquire on their practice and together learn new and better approaches to enhance student learning (Stoll, Bolam, McMahon, Thomas, Wallace, Greenwood et al., 2005). As you can see from the definitions and the red words that are highlighted the work of Professional Learning Communities should be more about process and not as much about product. This fact contradicts how teachers are evaluated in many districts.
  • 32.
    Characteristics of PLC •Shared Values and Vision • Collaborative Culture • Focus on examining outcomes to improve student learning • Supportive and shared leadership • Shared personal practice -The Center for Comprehensive School Reform and Improvement
  • 33.
    Process versus Product Staffdevelopment is often viewed so much from the product end and not the process end. They are not continuums but instead are embedded together in personal growth. Process- a continuous action, operation, or series of changes taking place in a definite manner. Product-a person or thing produced by or resulting from a process, as a natural, social, or historical one; result. A focus is needed for organizations to examine both product and process in a more critical manner and one way to do that is through Professional Learning Communities.
  • 34.
    Accountability in theContinuous Inquiry Process • Value-added assessments need to be implemented within the evaluation process for teachers (We have them for students). • Virtual Professional Learning Communities as an option of sharing personal practices to complement the on campus meetings. • Eportfolios for teachers to garner artifacts of the process versus the product. • Self-evaluations done by the teachers and Staff Development Plans developed from the teacher to the principal. • Staff development plans for the campus generated from the self- evaluations done throughout the year. • Electronic journals to capture continuous inquiry throughout the year and turn these in as part of the evaluation process for teachers.
  • 35.
    Contact Information • Dr.Jason R. Mixon Director of Doctoral Programs in Ed. Leadership jason.mixon@lamar.edu 903-353-5504 (cell) 409-880-7362 (office)

Editor's Notes

  • #10 Instructional Data Team Information TM p. 4. The descriptions of District, School Data Teams, and Student led Data Teams will change slightly. This seminar is focused on instructional Data Teams. Instruct: give another description to enhance understanding. Guide – give examples. TM (speakers notes): Elementary – 3 rd grade team of 4 people, focused on reading comprehension-inferences, uses a rubric to measure the forming of inferences, meet every 2 weeks using 5-step process. Middle school – 6 th – 8 th grade math team of 6 people, focused on problem solving, measured with a series of 5 algorithms with a problem solving prompt, uses a problem solving rubric to measure focus, meet every 3 weeks using the 5-step process. High School – 10 th grade science team of 7 people, focused on the scientific process, uses scientific process to measure performance, meets every Tuesday using 5-step process. Additional examples – not necessary to share Principals – North zone principals focus on the monitoring of DT, use a monitoring rubric to measure performance, meet every 4 th Thursday. Human Resources- department of 8 focus on customer service, uses a checklist to assess performance and a customer service rubric to measure performance. Board of Education – group of 7 focuses on the effectiveness of meetings; use a meeting feedback reflection tool to assess performance and a rubric to measure performance. Meet monthly. Students-- 9 th grade English AP students, focus on persuasive writing/debate, persuasive argument/debate rubric, meet as the teacher decides. Application - can continue to use reflection on TM p. 4 or wait to reflect after the next slide.   FAILED INITIATIVE IF PEOPLE CAN OPT OUT.
  • #12 Priority standards, TM p. 17-18 are explained on the next slide and in the manual. It is important for teams to realize that they do not focus on all academic standards, Data Teams should only use priority standards – or the standards that are most important, in the Data Teams process. Supplemental resource: Power Standards, Ainsworth, Advanced Learning Press, Englewood, Colorado
  • #14 Assessment, TM p. 21-27 Data Teams cannot function if they don’t have common formative assessments. Teams must have a strong understanding of assessment literacy, however it may not happen when they begin the process. Often times it is developed as they use the process and refine their practice in assessment. This section is designed to show the alignment and expose people to Data Teams assessments. Key Points: -Data Teams assessments are diagnostic, continuous, and aligned with priority standards and instruction. -These assessments allow for ongoing, timely, descriptive feedback that transcends sorting of students through numerical scores or letter grades.
  • #20 Have the evaluations