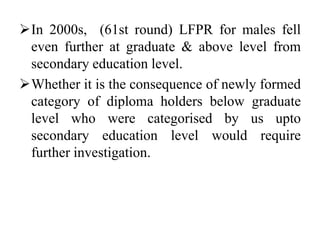
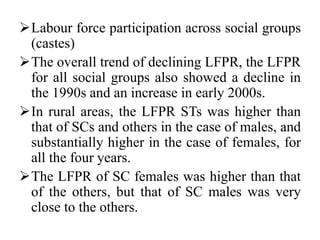
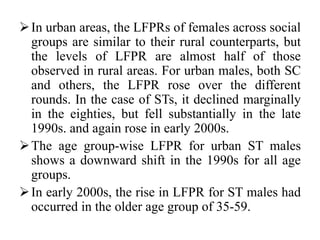
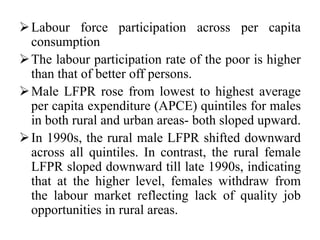
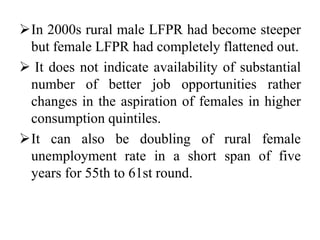
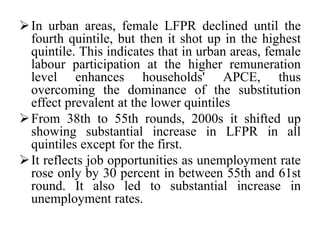
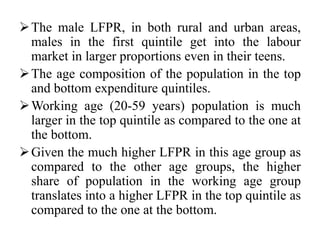
Labour Market and
Composition of Labour
by
K. Murugan
Assistant Professor
Dept. of Economics
Guru Nanak College
Chennai-42.
Labour Market
A labour market is a mechanism that
matches potential employers of people
(the demand for labour) with people who
are available for work (the labour
supply).
Labour markets operate at local, regional,
national and, increasingly, at international
levels, reflecting how economies operate.
Factors affect Labour Market
Changes in the external business environment like
increases in consumer demand for the goods or
services provided by an industry, or cheaper
competition from abroad leading to job losses
Changes in the internal business environment,
such as changes in production processes, new
technologies or business structures resulting in
job losses, or changes in the level of occupations
available (for example, more technical jobs, fewer
unskilled jobs)
Government interventions, such as regeneration
programmes supporting education, training and
investment in particular skills or geographical
areas.
 New laws which affect jobs (banning hunting, or
restricting the number of hours a lorry driver can
drive)
 National and international policies like the
introduction of National Minimum Wages, or free
movement of labour .
 Legislation affecting employment rights -
 Equal Pay Act, Sex Discrimination Act, Race
Relations Act, Asylum and Immigration Act, and the
Disability Discrimination Act- placing restrictions on
how employers recruit.
 Labour market economics involves analysing the
determinants of the various dimensions of labour
supply and demand, all of which interact to determine
wages, employment and unemployment.
 There are many dimensions to labour supply, including
demographics (the effects of a population boom or
quick decline in population growth, leading to a
substantial increase in the working age population),
immigration and emigration policies (e.g., brain drain),
the labour force participation decision, the hours of
work decision (including overtime and additional jobs),
education and training (human capital decisions) and
the disincentive effects of income maintenance and
unemployment insurance policies.
Various Approaches of Labour Markets
The neoclassical approach is makes behavioural
assumptions about how buyers and sellers of
labour respond to wage rates, prices and other
factors, and it assumes that the labour market is in
equilibrium (the labour market where supply
equals demand).
Two competitive labour market are:
Homogenous quality of labour is paid the same
wage rate in different sectors.
There is no involuntary unemployment - all
individuals who want to work at an equilibrium
wage will have jobs.
The second is the institutional approach, which
emphasizes the role of institutions, customs
and socio-political factors. This approach
stresses the descriptive realism of the labour
market.
The third approach, the dual labour market
approach, views the labour market as a
segmented formal market with good, high
paying, stable jobs, and a large informal
market with bad, low wages and high turnover
of jobs.
There are life-cycle phenomena which affect
labour supply. These are:
The retirement decision - when to withdraw
from the labour force.
The school-work decision - whether to acquire
additional education, which delays entry into
the labour force. These are also analysed in
terms of human capital decisions;
The fertility decision - having children affects
the labour force participation of women.
Composition of Labour Force
The labour force is various compositions and to
ascertain any interesting changes in the last two
decades.
The increasing rate of urbanization, the share of
urban areas in the total labour force was going up
till late 90s.
Share of urban workers is less than the
urbanization rate.
The reason lies in the relatively smaller LFPR
among urban females as compared to rural
females, which had led to a much lower share of
females in the urban labour supply.
The gender composition of the labour force had
been slowly moving against females from 1983 to
1999-2000.
Share of females in labour force fell by 2.5 per
cent during this period and it reached 30.6 per
cent in 1999-2000
It is only in 2004-05, this defeminisation process
got reversed and the share of females in total
labour force reached the level of early eighties.
In the 1980s, a 'defeminization' of the labour force
was observed in rural areas; in the 1990s, the
share of the female labour force declined in equal
proportion in both rural and urban areas. The
reason lies in the pattern of female labour
withdrawal.
In 1980, most of the withdrawal in rural areas in
the younger age group for reasons of educational
participation.
In 1990, most of the withdrawal from adult
subsidiary employment, which is more dominated
by the demand side factor.
In 2000s, feminisation of labour force in both
rural and urban areas.
 Share of female labour vs male had increased
considerably.
Female employment which can be considered as
demand side factor.
 The age group (20-44 years) in both rural and urban areas
and across both genders. But in urban areas, the share of
this age group is higher than in rural areas, and the share of
females is comparatively higher than that of males.
 The share of the younger 10-19 years group in labour force
fell over the years in all cases.
 The share of 59+ years group rose or remained the same in
all cases in the 1990s and fell thereafter, thus leading to
increase in the mean age of the Indian labour force till
1990s.
 In urban areas, in the 1990s, the share of the prime age
group (20-44 years) fell and that of the 45-59 years group
rose, which has further aged the principal labour force of
urban India during that period. In early 2000s, the share of
prime age group in urban areas actually went up.
There is increase in the education participation
rate was the main factor responsible for
decline in the work participation rate. There is
a difference between 1983-84 1993-94 and
1993-94-1999-2000.
Social, institutional, economic, demographic
and regional variations in labour supply
Regional variation in female labour supply
The adult able-bodied male has to work, it is
unlikely that there would be substantial
variation in the adult male labour supply in its
various social and institutional setups.
There are variation in the adult male labour
participation rate across NSS regions. They
also found that even with much lower LFPRs,
the variations in the female labour
participation rate were considerably more.
 The female LFPR has shown substantial variations.
The female subsidiary labour supply, examine the
regional variations in the female labour supply, The
LFPRs and the changes in them.
 Labour force participation across various educational
level
 The rural female LFPR declined from a high level at
the illiterate to middle education level, went up
somewhat at the secondary level and then rose
substantially at the graduate and above level in the
38th and 50th NSS rounds In the 55th round.
 In urban areas, from 38th to 55th round, the female
LFPR across educational levels showed much less
shift over the different rounds as compared with their
rural counterparts and they were more stable.
 However, the shape of the LFPR in the urban areas
was much more pronouncedly U-shaped with the
LFPR of the graduate and above group being
substantially higher.
 This shows greater inclination to work or more job
opportunities for highly educated females.
 But, 2000s, the female LFPR had become flatter with
upward shift in LFPR from literate to middle level
and shift downward at graduate level.
In 2000s, (61st round) LFPR for males fell
even further at graduate & above level from
secondary education level.
Whether it is the consequence of newly formed
category of diploma holders below graduate
level who were categorised by us upto
secondary education level would require
further investigation.
Labour force participation across social groups
(castes)
The overall trend of declining LFPR, the LFPR
for all social groups also showed a decline in
the 1990s and an increase in early 2000s.
In rural areas, the LFPR STs was higher than
that of SCs and others in the case of males, and
substantially higher in the case of females, for
all the four years.
The LFPR of SC females was higher than that
of the others, but that of SC males was very
close to the others.
In urban areas, the LFPRs of females across social
groups are similar to their rural counterparts, but
the levels of LFPR are almost half of those
observed in rural areas. For urban males, both SC
and others, the LFPR rose over the different
rounds. In the case of STs, it declined marginally
in the eighties, but fell substantially in the late
1990s. and again rose in early 2000s.
The age group-wise LFPR for urban ST males
shows a downward shift in the 1990s for all age
groups.
In early 2000s, the rise in LFPR for ST males had
occurred in the older age group of 35-59.
Labour force participation across per capita
consumption
The labour participation rate of the poor is higher
than that of better off persons.
Male LFPR rose from lowest to highest average
per capita expenditure (APCE) quintiles for males
in both rural and urban areas- both sloped upward.
In 1990s, the rural male LFPR shifted downward
across all quintiles. In contrast, the rural female
LFPR sloped downward till late 1990s, indicating
that at the higher level, females withdraw from
the labour market reflecting lack of quality job
opportunities in rural areas.
In 2000s rural male LFPR had become steeper
but female LFPR had completely flattened out.
 It does not indicate availability of substantial
number of better job opportunities rather
changes in the aspiration of females in higher
consumption quintiles.
It can also be doubling of rural female
unemployment rate in a short span of five
years for 55th to 61st round.
In urban areas, female LFPR declined until the
fourth quintile, but then it shot up in the highest
quintile. This indicates that in urban areas, female
labour participation at the higher remuneration
level enhances households' APCE, thus
overcoming the dominance of the substitution
effect prevalent at the lower quintiles
From 38th to 55th rounds, 2000s it shifted up
showing substantial increase in LFPR in all
quintiles except for the first.
It reflects job opportunities as unemployment rate
rose only by 30 percent in between 55th and 61st
round. It also led to substantial increase in
unemployment rates.
The male LFPR, in both rural and urban areas,
males in the first quintile get into the labour
market in larger proportions even in their teens.
The age composition of the population in the top
and bottom expenditure quintiles.
Working age (20-59 years) population is much
larger in the top quintile as compared to the one at
the bottom.
Given the much higher LFPR in this age group as
compared to the other age groups, the higher
share of population in the working age group
translates into a higher LFPR in the top quintile as
compared to the one at the bottom.

Labour

  • 1.
    Labour Market and Compositionof Labour by K. Murugan Assistant Professor Dept. of Economics Guru Nanak College Chennai-42.
  • 2.
    Labour Market A labourmarket is a mechanism that matches potential employers of people (the demand for labour) with people who are available for work (the labour supply). Labour markets operate at local, regional, national and, increasingly, at international levels, reflecting how economies operate.
  • 3.
    Factors affect LabourMarket Changes in the external business environment like increases in consumer demand for the goods or services provided by an industry, or cheaper competition from abroad leading to job losses Changes in the internal business environment, such as changes in production processes, new technologies or business structures resulting in job losses, or changes in the level of occupations available (for example, more technical jobs, fewer unskilled jobs) Government interventions, such as regeneration programmes supporting education, training and investment in particular skills or geographical areas.
  • 4.
     New lawswhich affect jobs (banning hunting, or restricting the number of hours a lorry driver can drive)  National and international policies like the introduction of National Minimum Wages, or free movement of labour .  Legislation affecting employment rights -  Equal Pay Act, Sex Discrimination Act, Race Relations Act, Asylum and Immigration Act, and the Disability Discrimination Act- placing restrictions on how employers recruit.
  • 5.
     Labour marketeconomics involves analysing the determinants of the various dimensions of labour supply and demand, all of which interact to determine wages, employment and unemployment.  There are many dimensions to labour supply, including demographics (the effects of a population boom or quick decline in population growth, leading to a substantial increase in the working age population), immigration and emigration policies (e.g., brain drain), the labour force participation decision, the hours of work decision (including overtime and additional jobs), education and training (human capital decisions) and the disincentive effects of income maintenance and unemployment insurance policies.
  • 6.
    Various Approaches ofLabour Markets The neoclassical approach is makes behavioural assumptions about how buyers and sellers of labour respond to wage rates, prices and other factors, and it assumes that the labour market is in equilibrium (the labour market where supply equals demand). Two competitive labour market are: Homogenous quality of labour is paid the same wage rate in different sectors. There is no involuntary unemployment - all individuals who want to work at an equilibrium wage will have jobs.
  • 7.
    The second isthe institutional approach, which emphasizes the role of institutions, customs and socio-political factors. This approach stresses the descriptive realism of the labour market. The third approach, the dual labour market approach, views the labour market as a segmented formal market with good, high paying, stable jobs, and a large informal market with bad, low wages and high turnover of jobs.
  • 8.
    There are life-cyclephenomena which affect labour supply. These are: The retirement decision - when to withdraw from the labour force. The school-work decision - whether to acquire additional education, which delays entry into the labour force. These are also analysed in terms of human capital decisions; The fertility decision - having children affects the labour force participation of women.
  • 9.
    Composition of LabourForce The labour force is various compositions and to ascertain any interesting changes in the last two decades. The increasing rate of urbanization, the share of urban areas in the total labour force was going up till late 90s. Share of urban workers is less than the urbanization rate. The reason lies in the relatively smaller LFPR among urban females as compared to rural females, which had led to a much lower share of females in the urban labour supply.
  • 10.
    The gender compositionof the labour force had been slowly moving against females from 1983 to 1999-2000. Share of females in labour force fell by 2.5 per cent during this period and it reached 30.6 per cent in 1999-2000 It is only in 2004-05, this defeminisation process got reversed and the share of females in total labour force reached the level of early eighties. In the 1980s, a 'defeminization' of the labour force was observed in rural areas; in the 1990s, the share of the female labour force declined in equal proportion in both rural and urban areas. The reason lies in the pattern of female labour withdrawal.
  • 11.
    In 1980, mostof the withdrawal in rural areas in the younger age group for reasons of educational participation. In 1990, most of the withdrawal from adult subsidiary employment, which is more dominated by the demand side factor. In 2000s, feminisation of labour force in both rural and urban areas.  Share of female labour vs male had increased considerably. Female employment which can be considered as demand side factor.
  • 12.
     The agegroup (20-44 years) in both rural and urban areas and across both genders. But in urban areas, the share of this age group is higher than in rural areas, and the share of females is comparatively higher than that of males.  The share of the younger 10-19 years group in labour force fell over the years in all cases.  The share of 59+ years group rose or remained the same in all cases in the 1990s and fell thereafter, thus leading to increase in the mean age of the Indian labour force till 1990s.  In urban areas, in the 1990s, the share of the prime age group (20-44 years) fell and that of the 45-59 years group rose, which has further aged the principal labour force of urban India during that period. In early 2000s, the share of prime age group in urban areas actually went up.
  • 13.
    There is increasein the education participation rate was the main factor responsible for decline in the work participation rate. There is a difference between 1983-84 1993-94 and 1993-94-1999-2000.
  • 14.
    Social, institutional, economic,demographic and regional variations in labour supply Regional variation in female labour supply The adult able-bodied male has to work, it is unlikely that there would be substantial variation in the adult male labour supply in its various social and institutional setups. There are variation in the adult male labour participation rate across NSS regions. They also found that even with much lower LFPRs, the variations in the female labour participation rate were considerably more.
  • 15.
     The femaleLFPR has shown substantial variations. The female subsidiary labour supply, examine the regional variations in the female labour supply, The LFPRs and the changes in them.  Labour force participation across various educational level  The rural female LFPR declined from a high level at the illiterate to middle education level, went up somewhat at the secondary level and then rose substantially at the graduate and above level in the 38th and 50th NSS rounds In the 55th round.
  • 16.
     In urbanareas, from 38th to 55th round, the female LFPR across educational levels showed much less shift over the different rounds as compared with their rural counterparts and they were more stable.  However, the shape of the LFPR in the urban areas was much more pronouncedly U-shaped with the LFPR of the graduate and above group being substantially higher.  This shows greater inclination to work or more job opportunities for highly educated females.  But, 2000s, the female LFPR had become flatter with upward shift in LFPR from literate to middle level and shift downward at graduate level.
  • 17.
    In 2000s, (61stround) LFPR for males fell even further at graduate & above level from secondary education level. Whether it is the consequence of newly formed category of diploma holders below graduate level who were categorised by us upto secondary education level would require further investigation.
  • 18.
    Labour force participationacross social groups (castes) The overall trend of declining LFPR, the LFPR for all social groups also showed a decline in the 1990s and an increase in early 2000s. In rural areas, the LFPR STs was higher than that of SCs and others in the case of males, and substantially higher in the case of females, for all the four years. The LFPR of SC females was higher than that of the others, but that of SC males was very close to the others.
  • 19.
    In urban areas,the LFPRs of females across social groups are similar to their rural counterparts, but the levels of LFPR are almost half of those observed in rural areas. For urban males, both SC and others, the LFPR rose over the different rounds. In the case of STs, it declined marginally in the eighties, but fell substantially in the late 1990s. and again rose in early 2000s. The age group-wise LFPR for urban ST males shows a downward shift in the 1990s for all age groups. In early 2000s, the rise in LFPR for ST males had occurred in the older age group of 35-59.
  • 20.
    Labour force participationacross per capita consumption The labour participation rate of the poor is higher than that of better off persons. Male LFPR rose from lowest to highest average per capita expenditure (APCE) quintiles for males in both rural and urban areas- both sloped upward. In 1990s, the rural male LFPR shifted downward across all quintiles. In contrast, the rural female LFPR sloped downward till late 1990s, indicating that at the higher level, females withdraw from the labour market reflecting lack of quality job opportunities in rural areas.
  • 21.
    In 2000s ruralmale LFPR had become steeper but female LFPR had completely flattened out.  It does not indicate availability of substantial number of better job opportunities rather changes in the aspiration of females in higher consumption quintiles. It can also be doubling of rural female unemployment rate in a short span of five years for 55th to 61st round.
  • 22.
    In urban areas,female LFPR declined until the fourth quintile, but then it shot up in the highest quintile. This indicates that in urban areas, female labour participation at the higher remuneration level enhances households' APCE, thus overcoming the dominance of the substitution effect prevalent at the lower quintiles From 38th to 55th rounds, 2000s it shifted up showing substantial increase in LFPR in all quintiles except for the first. It reflects job opportunities as unemployment rate rose only by 30 percent in between 55th and 61st round. It also led to substantial increase in unemployment rates.
  • 23.
    The male LFPR,in both rural and urban areas, males in the first quintile get into the labour market in larger proportions even in their teens. The age composition of the population in the top and bottom expenditure quintiles. Working age (20-59 years) population is much larger in the top quintile as compared to the one at the bottom. Given the much higher LFPR in this age group as compared to the other age groups, the higher share of population in the working age group translates into a higher LFPR in the top quintile as compared to the one at the bottom.