The document analyzes reasons for optimism in the US labor market beyond the unemployment rate. It finds that declines in long-term unemployment, a stable participation rate, and low layoffs/claims indicate continued recovery. While the participation rate decline partly reflects demographic shifts like aging, projections show it stabilizing. Steady job growth and increasing job openings also point to strength, as do reductions in structural unemployment over time. Overall, the analysis finds that while frictions from the recession persist, factors examined provide optimism that the labor market is recovering and its challenges do not appear permanent.
The document analyzes potential unemployment scenarios in the United States over the next decade. It first examines current unemployment data and trends, finding the unemployment rate at 10% with 17.3% underemployment. It then presents three scenarios: 1) unemployment peaking in late 2010 and returning to pre-recession levels by 2013, based on historical patterns; 2) unemployment declining more slowly due to factors like declining consumer credit, part-time work, and low labor participation; 3) unemployment remaining elevated for years due to challenges across many industries in creating sufficient new jobs.
1) The document discusses factors that influence economic growth rates, including population size and age distribution, labor force participation, unemployment, and productivity.
2) It argues that the most effective way to improve and accelerate economic growth is by increasing productivity through education, research, developing new technologies, and efficiently allocating resources.
3) Political and social factors can also impact economic growth by blocking improvements to productivity.
This document discusses unemployment and inflation. It defines unemployment and how it is measured. High unemployment results in lost economic output and lower individual well-being. Factors like age, location, and occupation impact unemployment rates. Sources of unemployment include frictional, seasonal, structural, and cyclical factors. Full employment occurs when cyclical unemployment is low.
The document also defines inflation as a sustained increase in the overall price level. Inflation can be caused by demand-pull factors like increased spending or cost-push factors like higher supply costs. Anticipated inflation is less harmful than unanticipated inflation. High inflation decreases real wages and interest rates, slowing economic growth.
This document summarizes key aspects of the Phillips curve and debates around inflation theories. It discusses how Samuelson and Solow popularized the Phillips curve as a policy tool showing a tradeoff between inflation and unemployment. However, their interpretation led policymakers in the 1960s-1970s to pursue expansionary policies, fueling the Great Inflation. Later analysis found Samuelson and Solow did not actually estimate the Phillips curve relationship but drew it by hand, and a proper estimation shows a different relationship with implications for economic policy.
This document summarizes a report on the effects of minimum wage in developing countries. Key points include:
1) Evidence suggests minimum wages tend to have a small negative effect on unemployment but a positive effect on wages, especially for low-wage workers in covered sectors.
2) Effects in uncovered sectors are unclear due to limited data. Minimum wages may positively or negatively impact wages and employment in these sectors.
3) Overall, the evidence is inconclusive on whether minimum wages improve outcomes for low-paid workers across covered and uncovered sectors. More research is needed, especially on indirect effects in uncovered sectors.
1) There is a disparity between recent US economic statistics showing weak GDP growth but robust job growth. However, this disparity is misleading because the two statistics are reported differently - GDP as a percentage change and jobs as an absolute number.
2) When the jobs numbers are also expressed as a percentage change annually, the pace of recent job growth is actually slower than in previous economic recoveries and trails six consecutive years of subpar economic growth as measured by both GDP and jobs.
3) Declining labor force participation cannot explain the slower jobs growth because the decline is driven more by disability programs than retirement, and the number of young workers entering the labor force has not been fully absorbed.
This document summarizes trends in US labor force participation rates since the 1960s. It finds that while the overall rate increased steadily until the late 1990s, this masked different trends among demographic groups. Women's participation rose dramatically until leveling off in the 1990s, while prime-age men's participation declined. This decline was largest for less educated men and correlated with changes in manufacturing jobs. Youth participation also fell as more remained in education. The aging of the population also contributed to slowing overall growth in labor force participation.
The document discusses differing views on the amount of slack in the Euro area economy. It argues that official institutions like the ECB and EC believe the output gap is modest, despite high unemployment and lower GDP, because they see much of the rise in unemployment as structural. However, the document disagrees, believing there is likely much more slack than assumed. It provides estimates suggesting the output gap could be around 8%, compared to official estimates around -3%. The larger gap implies monetary and fiscal policy are tighter than needed, which could condemn the region to weak growth and inflation below targets for years.
This document provides an introduction to a dissertation that examines the relationship between trade liberalization, government debt, human capital, and income inequality using panel data econometrics. It aims to understand the determinants of global income inequality and account for rising inequality in developed countries. The analysis uses the consistent EHII index to measure household income inequality across 136 countries from 1968-2008. Static and dynamic panel techniques are employed to explore how macroeconomic variables like human capital, trade openness, government debt, inflation, and growth impact inequality. It also considers whether effects differ between developed and developing countries. The results seek to inform policy to reduce inequality and its associated social and economic issues.
This document discusses macroeconomic concepts including GDP, business cycles, economic growth, and technological progress. It explains that GDP measures the value of final goods and services produced, and economists use GDP and real GDP per capita to analyze economic performance and standards of living. The business cycle consists of expansion, peak, contraction and trough phases influenced by investment, interest rates, expectations and external shocks. Economic growth results from capital deepening, savings, population changes, government policies, and technological advances driven by factors like research, innovation, and education.
- The National Minimum Wage was introduced in 1999 and has since been progressively increased, raising the wages of over 1 million low-paid workers by around 15% on average. While it was initially feared that the minimum wage would significantly reduce employment, research has found little to no evidence of job losses, though some reduction in hours worked.
- The minimum wage has primarily benefited women, who make up a higher proportion of low-paid workers. However, there is no evidence the minimum wage has caused "spillover" effects of higher wages among better paid workers.
- While the minimum wage has reduced wage inequality slightly among the lowest paid workers, it has been a limited tool for reducing overall wage inequality or
Degroof Petercam Asset Management's chief economist and asset allocator look into whether the reflation trade is for real and inflation is back in the cards.
This document summarizes a study analyzing the effects of increasing the Canada Pension Plan (CPP) contribution rate on the labor market. The study uses a macroeconomic model called FOCUS to forecast the response. The model predicts that a 1% increase in the CPP rate would lead to:
1) A decrease in real GDP, consumption, and investment over the next 5 years as workers' take-home pay is reduced.
2) Higher unemployment and lower real wages as employers adjust by hiring fewer workers and raising prices.
3) Potential inflation as employers pass costs to consumers, though monetary policy responses could dampen this effect.
The document discusses several challenges facing the US economy that contradict the view that it can decouple from global economic trends. It argues that the Federal Reserve's quantitative easing policies had less impact on interest rates than commonly believed, and that interest rates were destined to fall due to a global capital glut. It also argues that the US employment situation indicates long-term problems like declining labor force participation and increasing low-wage jobs. Additionally, it states that household debt remains high and deflation is a global issue impacting the US through factors like a strong dollar.
The document summarizes trends in top income shares in the United States from 1917 to 2007. It finds that the top 1% income share has increased dramatically over the last 25 years, reaching levels not seen since before the Great Depression. Within the top 1%, the gains are extremely concentrated, with the top 0.01% share increasing substantially. The growth is largely due to rising wages and salaries at the top rather than capital income. Recent tax data is available with a 2-year lag, but preliminary estimates could be produced faster using tax filing data.
The document summarizes insights into the 2016 US economy and issues surrounding the Federal Reserve. It argues that while unemployment has decreased and GDP grown moderately, inflation has remained stagnant. This implies the Fed has boosted asset prices and confidence but not tangible economic growth. One indicator of economic growth not discussed is the skills gap between what employers require and what college graduates possess, leaving the workforce saturated and unable to drive wages and inflation. The Fed has instilled market confidence but failed to address issues in the labor force crucial to economic growth. Investors may eventually realize the Fed's limitations as an economic growth instigator.
The document discusses the possibility of a global recession in 2009-2010. It defines a recession as two consecutive quarters of negative economic growth. While some countries like India are experiencing a slowdown, factors like falling stock markets, rising unemployment, and cuts to jobs and salaries indicate many economies have entered a recession. The IMF predicts global growth will slow to just over 2% in 2009, meeting the definition of a global recession. Macroeconomic models are used to understand how recessions occur on a national or regional scale.
This document discusses income inequality, providing data and analysis on rising inequality levels, especially in developed countries like the US. It notes that while inequality is a natural feature of free markets, levels have increased substantially in recent decades. Data shows the top 1% in the US now earn a similar share of income as in the 1920s. For most Americans, incomes have stagnated or grown slowly compared to high earners. The document aims to explore investment implications of rising inequality through tools to help assess corporate strategies and socioeconomic impacts.
Unemployment refers to individuals who are employable and seeking work but unable to find a job. It is measured by the unemployment rate, which indicates the percentage of the workforce that is unemployed. There are several types of unemployment, including demand deficient unemployment which occurs during recessions when companies cut jobs, frictional unemployment which refers to those between jobs, and structural unemployment when workers' skills do not match available jobs. Unemployment can be caused by factors from both the demand side like recessions and the supply side like mismatches between workers and jobs. It negatively impacts both workers through financial difficulties and the economy through reduced consumer spending. In the Philippines, the unemployment rate dropped to 5.1% in mid-2019 from 5
Can Changes in Age Structure have an impact on the Inflation Rate?The Case o...WilliamTWang1
Demographics in different parts of the world are facing an aging population and a diminishing growth in population, particularly high-income countries. This paper estimates the relationship between the growth of age composition and the inflation rate while including other macroeconomic variables as explanatory variables to ensure the model has a good fit to the true model. This paper estimates the case in the United States of America from 1960 to 2016, studying the relationship between the inflation rate and the growth rate of the proportion in different age cohorts. The results show a consistent and significant relationship between the growth in the proportion of different age cohort and inflation rate,
in which the increase in the proportion of net savers (age between 30 – 64 years old) and retirees
(age between 65 and above) in the economy encourages higher inflation rate. This can be explained by the Life Cycle Hypothesis combined with other economic theories. In any case, the results suggest that demographic has an association with the inflation rate in which the projection of age composition in the future can be used as a tool to better forecast the inflation rate. This could open the possibility for monetary authorities to better implement monetary policy to sustain their mandate.
This document discusses research on the relationship between poverty, inequality, and economic growth in India. It provides a literature review on studies of poverty in India and the relationship between income levels and welfare indicators like health and education. The document then examines the evolution of poverty reduction policies in India since independence, including a shift from trickle-down to direct anti-poverty programs. It aims to reconcile high economic growth rates in India with persistent poverty and inequality by analyzing panel data on growth, poverty, and inequality across Indian states.
The document discusses economic challenges facing rural counties in Utah. It finds that while some urban counties are prospering, many rural counties continue to struggle with issues like declining jobs and population, low economic diversity, and high unemployment rates. It identifies several counties - Carbon, Duchesne, Emery, Garfield, Piute, and San Juan - as qualifying as rural, having low economic diversity, and economic setbacks in key measures. It proposes a "Rural Utah State Income Tax Incentive" to help address these challenges by giving tax credits to businesses and individuals who stay and relocate to rural Utah counties.
This document summarizes theories of unemployment and inflation, and analyzes the relationship between unemployment and inflation in OECD countries from 1990 to 2014. It finds:
1) Phillips curves and relationships between unemployment and inflation still exist in 28 of the 35 OECD countries studied, both individually and as a panel.
2) There is bidirectional causality and cointegrating relationships between unemployment and inflation in these countries.
3) Estimates from country-specific regressions, panel data models, and a panel VAR model provide evidence for unemployment-inflation trade-offs.
4) However, the Phillips curve relationship appears to be thinner than in the past, and some countries show no relationship or even counterint
This document discusses challenges women face when re-entering the workforce after taking time off for family reasons. It covers the topic from multiple perspectives, including the woman's perspective on career continuity, the project manager perspective on project continuity, and economics of diversity in the workplace. The document also presents 5 case studies of women in different situations dealing with re-entering the workforce. It concludes with lessons for working women and project managers, such as resetting expectations, re-skilling, flexibility, matching demand and supply, and leveraging loyalty. The overall message is that facilitating women's re-entry into the workforce has social and economic benefits but also presents challenges that require consideration from multiple viewpoints.
Disparity in growth rates among countriesSparsh Banga
The document analyzes convergence between countries using GDP data from 1995-2014 for 30 countries grouped into developed, developing, and least developed. Section 1 finds the growth rates for each country over time. Section 2 calculates the coefficient of variation to measure sigma convergence, regressing it on time. Section 3 measures beta convergence by regressing countries' growth rates on their initial GDP, testing if poorer countries grew faster. The results show developing countries like India and China grew around 10-15%, least developed countries around 8-17%, and developed countries around 3-5%, indicating some degree of conditional convergence between income groups.
The digestive system breaks down food into nutrients that can be absorbed into the bloodstream. There are four stages: ingestion, digestion, absorption, and egestion. The major organs include the mouth, esophagus, stomach, pancreas, liver, gallbladder, small intestine, large intestine, rectum, and anal sphincter. The stomach secretes acid to break down food into chyme, while the pancreas, liver, and gallbladder produce enzymes and bile to further break down nutrients for absorption in the small intestine. Wastes are then stored and removed from the body through the large intestine, rectum, and anal sphincter.
Un artefacto digital es cualquier dispositivo electrónico que almacena y procesa datos digitales, como computadoras, teléfonos inteligentes y tabletas. Estos artefactos se crean mediante el diseño de hardware y software, y luego se prueban y mejoran antes de su lanzamiento comercial.
1) El documento describe cómo realizar cálculos en Excel, incluyendo referencias a celdas, hojas y rangos, fórmulas y operadores matemáticos, y funciones.
2) Explica los cuatro tipos de referencias a celdas y cómo afectan a la copia de fórmulas.
3) Detalla cómo hacer referencia a hojas, rangos individuales, múltiples rangos y rangos tridimensionales.
Pesquisa - Equipamentos para condicionamento de energia e grupos geradores [R...atitudeeditorial
1) A onda de sustentabilidade e alta das tarifas de energia estimulam empresas a investirem em autoprodução de energia a partir do gás natural. 2) As indústrias buscam alternativas como locação de geradores para reduzir custos com energia no horário de pico. 3) Apesar da procura por geradores a diesel, a preocupação com sustentabilidade aumenta o interesse por sistemas de geração a gás natural.
The document analyzes the rise of far-right extremism and populism in Hungary, as represented by the political party Jobbik. It identifies several key reasons for Jobbik's growth, including tensions between Roma and non-Roma populations, widespread disappointment in the political establishment, and an economic crisis since 2008 that increased poverty. The document also examines Jobbik's organizational strength, ideological stances, voter base, and influence on mainstream right-wing parties like Fidesz adopting some of its positions. It concludes by considering different strategies for countering the rise of extremism.
Ronald Lucardie is a Dutch social and cultural anthropologist born in 1948 in Indonesia. He has worked as a policy advisor for Cordaid Netherlands and the Dutch Consortium of Migrant Organizations (DCMO). EUNOMAD is a European network that Lucardie helped establish in 2007. It aims to be a public arena for dialogue on practices linking migration, citizenship, integration and development. EUNOMAD recognizes migrants' contributions and believes cultural diversity enriches societies. It advocates for rational debate on immigration in Europe.
This document provides an overview of research conducted on the employee engagement strategies of Edward Jones, an investment firm. The research included surveys of branch employees and human resources staff, interviews with managers, and focus groups. Key findings were that employees are motivated by accomplishing tasks rather than money, branches have limited employee bonding, and employees value corporate social responsibility. A proposed strategic plan aims to enhance social responsibility, increase younger employees, and empower relationships. The plan's goals are to increase productivity, reduce turnover, and decrease defects over three years with a total investment of $72 million.
Back-end technologies which you can use to create a scalable solution for your startup. Create wonderful solutions easily without spending fortune over software and tools.
Debt, Deficits, and Demographics: Why We Can Afford the Social ContractJesse Budlong
The emphasis on budget deficits in national policy debates over the last three decades has badly distorted national priorities. There has been an enormous amount of fundamentally confused thinking on budget deficits that has made its way into mainstream political debates. This paper shows that the potential harm from budget deficits has been seriously misrepresented and it is implausible that future generations of workers will see a decline in living standards due to the effects of an aging population. It also shows that the long-term deficit horror stories that appear frequently in public discussions are driven almost entirely by projections of exploding health care costs.
This report was originally published by the New America Foundation.
This document discusses unemployment, including its definition, measurement, types, causes, and rates in Pakistan. It defines unemployment as people who are without work but actively seeking employment. There are four main types of unemployment discussed - frictional, seasonal, cyclical, and structural. Frictional unemployment results from transitions between jobs, seasonal from industries that vary by season, cyclical from insufficient aggregate demand in the economy, and structural from mismatch between worker skills and job requirements. Causes and measures to address unemployment are also reviewed.
This document discusses the relationship between economic growth and unemployment rates. It finds that a persistently high unemployment rate remains a concern for Congress. While the unemployment rate has declined since peaking in 2009 and 2010, it remains elevated by historical standards. The key driver of unemployment over the long run is the rate of economic growth compared to potential growth. For unemployment to significantly decline, growth needs to outpace the combined growth of the labor force and productivity. Recent recoveries, including from the 2007-2009 recession, have seen slow declines in unemployment, described as "jobless recoveries."
Unemployment refers to willing workers without jobs who are physically fit, mentally sound, well-qualified, and willing to work at the prevailing wage rate. There are several types of unemployment including frictional unemployment from the time needed to find a job, structural unemployment due to skills mismatches, and cyclical unemployment caused by economic downturns. High unemployment is costly as it results in lost output and income for individuals and the overall economy. Governments aim to reduce unemployment through monetary and fiscal policies that seek to balance inflation and employment levels.
Causes And Effects Of Unemployment
Essay On Unemployment
Essay on Literature Review on Unemployment
Unemployment And Its Effects On Society
Trade Liberation Of India Reduce Unemployment
Unemployment in India
Inflation And Unemployment Essay
Essay on Causes of Unemployment
Essay On Unemployment
Essay on Unemployment
Essay on Unemployment in India
Creating Employment Opportunities in India
Women Employment in India
The document discusses increasing unemployment rates and reasons for unemployment. It notes private sector employment has been negative for 10 years, with 8 million jobs lost during the recession. Unemployment duration and rates are at record highs. Reducing unemployment will require stimulating all three engines of the economy - consumers, businesses, and government - as each are currently struggling. The document proposes a non-profit jobs program as a potential "fourth engine" to reduce unemployment.
This document discusses unemployment and its impact on the economy. It defines unemployment as people who are able and willing to work but cannot find employment. There are two main types of unemployment discussed: frictional unemployment which occurs due to imperfect information in the job market, and demand-deficient unemployment which occurs when there is a fall in aggregate demand. The document also examines unemployment rates among youth aged 15-24 and older workers aged 55-64 from 1995-2005 in Australia, finding that youth unemployment fell significantly while older worker unemployment also declined in 2005.
This document discusses different theories of unemployment, including:
1) It describes different types of unemployment including frictional, structural, and cyclical unemployment.
2) It explains the classical view that full employment is always achieved through flexible wages adjusting to clear the labor market.
3) It outlines Keynes' view that unemployment can persist if aggregate demand is insufficient, with the aggregate supply curve being horizontal in the short-run so that unemployment, not prices, adjust. Fiscal policy can be used to increase aggregate demand.
4) Wages are downwardly rigid in the short-run in the Keynesian model, so that real wages rise when prices fall during recessions even as nominal wages remain
Are the Long-Term Unemployed on the Margins of the Labor Market?Luis Taveras EMBA, MS
The hypothesis we seek to test is that the longer workers are
unemployed the less they become tied to the job market, either because, on the supply side, they
grow discouraged and search for a job less intensively (e.g., Krueger and Mueller, 2011) or
because, on the demand side, employers discriminate against the long-term unemployed, based
on the (rational or irrational) expectation that there is a productivity-related reason that accounts
for their long jobless spell (e.g., Kroft, Lange and Notowidigdo, 2013 and Ghayad, 2013).
Unemployment can be categorized into different types:
- Frictional unemployment occurs during the period taken for job vacancies and job seekers to match appropriately.
- Structural unemployment results when job seekers lack the right skills or live in areas with few opportunities, creating a mismatch.
- Seasonal unemployment occurs in industries affected by weather or calendar cycles like construction or tourism.
This document discusses minimum wage increases and their implications. It notes that while raising the minimum wage seems to help the working poor, there are also complex issues involved that must be considered. Both positive and negative consequences of increases are discussed from different perspectives in the research. The document examines factors like minimum wage indexing, effects on poverty levels, differing impacts based on the size of increases, and potential job losses or stimulus to the economy. Concerns are raised about long-term impacts on young workers' education and skills levels. Overall it aims to provide an informed analysis of this complex issue.
Cyclical Changes
In a temporary layoff, an employer “suspends” an employee’s job, generally because of slack demand. Both the employer and the employee expect their relationship to resume when economic conditions improve. The employer may even help the employee apply for unemployment insurance benefits so that he or she is more likely to wait out the layoff instead of taking another job.When layoffs are temporary, subsequent recalls can take place quickly, fueling fast payroll growth.
Structural Changes
By contrast, a permanent layoff severs the relationship
between the employer and the employee. The employer
eliminates the job for any of a variety of reasons, including a
permanent fall in demand, technological change, reorganization of production, and local or international outsourcing. Even an employer that ultimately decides to fill the job again will need to search for a new employee.
Together with our findings on temporary layoffs, it suggests that the two most recent recessions were more strongly structural than recessions past.
A Report on Unemployment - A basic studyDhanya Pravin
This document discusses unemployment, including definitions, types, causes, and measurements. It defines unemployment as people without a job who are actively looking for work. Unemployment is measured through surveys and government records. The main types of unemployment are demand-deficient, structural, real wage, frictional, and voluntary. Causes of unemployment include economic downturns, technological changes, minimum wages, and union policies. High unemployment can harm the economy through reduced consumer spending. The document also discusses other unemployment concepts and how governments use unemployment statistics.
This document discusses different types of unemployment including frictional, seasonal, cyclical, structural, and disguised unemployment. It also discusses underemployment and defines unemployment rate, labor force participation rate, and discouraged workers. Additionally, it covers the relationship between unemployment and inflation including the short-run and long-run Phillips curves. Expected inflation rate is identified as a key factor that can shift the short-run Phillips curve. The natural rate hypothesis and need for disinflation policies if unemployment is kept below the natural rate for too long are also summarized.
This document discusses the nature and measurement of unemployment. It defines unemployment as people who are actively looking for work but are currently without a job. The unemployment rate is defined as the number of unemployed people expressed as a percentage of the labor force. There are inflows and outflows into and out of unemployment as people transition between jobs and leaving the labor force. Disequilibrium unemployment can occur when real wages are above the equilibrium level or due to a reduction in aggregate demand. There are also types of equilibrium unemployment including frictional unemployment from job searching and structural unemployment from changes in industry demand.
Unemployment is measured as the number of people willing and able to work but unable to find employment. There are different types of unemployment including cyclical, frictional, and structural. Theories of unemployment include the Keynesian and classical theories. Keynesian theory states that aggregate demand determines employment while classical theory says real wages impact employment. Unemployment has costs like reduced income and increased dependence. The NAIRU is the lowest unemployment rate that avoids inflation increases. Factors like productivity and benefits influence the NAIRU, which is important for policymakers to consider.
The document analyzes the current state of the US economy and argues that while GDP and unemployment rates show recovery, income inequality has increased. It summarizes that GDP and unemployment have improved significantly since the recession but wages have grown slowly, many workers are underemployed or dropped from the labor force, and gains have disproportionately benefited the wealthy while median income has declined.
Similar to Andrew Tulumello - Reasons for Labor Market Optimism (20)
Andrew Tulumello - Reasons for Labor Market Optimism
1. December 10, 2015
Reasons for Labor Market Optimism beyond the Unemployment Rate
By Andrew Tulumello
Abstract
The U.S. has experienced a substantial increase in labor market frictions since the onset of the Great
Recession. The effect of the recession on long-term unemployment and labor force participation was
particularly devastating. Despite the severity of these labor market frictions, this is only a temporary trend
in the ongoing cycle of the labor market; these frictions will not become permanent characteristics.
The dubiousness of the unemployment rate’s accuracy as an indicator of labor market strength has often
been noted in the aftermath of the Great Recession. While the unemployment rate remains a vital
measure, this paper’s assessment of labor market recovery is primarily derived from a study of other
factors.
Declines in long-term unemployment have coincided with a moderately stable labor force participation
rate over the past two years, and recent evidence points to the labor force attachment of the long-term
unemployed being higher than generally believed. Also, the existence of an aging population has been
more detrimental to the labor force participation rate than the recessionary effects on the labor market.
Finally, low levels of layoffs and discharges, as well as low initial jobless claims, provide further
indication of labor market recovery.
Positive developments in long-term unemployment
The long-term share of unemployment, the percentage of unemployed persons who have been
unemployed for at least 27 weeks, had reached uncharted territory at its 2010 peak of 45 percent. Since
then, that number has steadily fallen to its current level of 25.7 percent (BLS). Since 2011, about two-
thirds of the decline in the overall unemployment rate can be attributed to a reduction in the long-term
unemployment rate (Cajner 2014). The unemployment rate on its own can be an ambiguous indicator of
overall labor market strength, but it is given additional perspective when analyzed in combination with
factors such as the long-term share of unemployment. With two-thirds of the decline in the overall
unemployment rate since 2011 being attributable to decreases in the long-term unemployment rate, this is
a sure sign that progress is being made.
2. Figure 1
Declines in long-term unemployment driving reduction in overall unemployment
There are more reasons to be enthusiastic about the downturn in the long-term share of unemployment.
Over the past two years, this decline has corresponded with a mostly stable labor force participation rate.
The long-term share of unemployment fell from 37.7 percent in November 2013 to 28.6 percent in May
2015, while the labor force participation rate remained effectively unchanged over this period (BLS). This
provides evidence that the drop in long-term unemployment is not being driven by a drop in labor force
participation. It also suggests a lack of discrepancy between the labor force attachments of the long-term
and the short-term unemployed. These developments point to a renewed optimism for the plight of the
long-term unemployed and the labor market as a whole.
The enormous upshot in the numbers of the long-term unemployed was uniquely characteristic of the
Great Recession. Because it tends to become increasingly difficult to find work the longer one has been
unemployed, long-term unemployment is a dilemma without a simple solution. These people’s recent
ability to find jobs is evidence that lingering effects of the recession are fading, and the labor market is
indeed strengthening. This reduction in long-term unemployment also supports the credibility of the
declining unemployment rate as a true indicator of labor market recovery.
Progressions in cyclical and structural unemployment
The civilian unemployment rate, currently at 5.0%, has completed its descent back to pre-recession levels.
This rate of 5.0% notably coincides with the Congressional Budget Office’s estimate of the natural rate of
3. unemployment in the long-term. The fact that these numbers match indicates an absence of cyclical
unemployment in the economy; the current composition of unemployment is almost entirely frictional and
structural. This absence of cyclical unemployment suggests there is currently a healthy demand for labor
in the U.S. economy.
As firms face increased competition over a smaller pool of unemployed workers, this will eventually
place upward pressure on wages. This growth in compensation will provide additional incentive for
workers, especially those on the participation margin, to enter or remain in the labor force. These effects,
along with the unemployment rate already hovering around the natural rate of unemployment, will likely
prevent further acceleration in the decline of the unemployment rate. However, the upward pressure on
wage growth and labor force participation that should result from these developments are encouraging
sings for the labor market going forward.
Much of the structural unemployment resulting from the Great Recession will decrease in the long-run, as
worker mobility increases over time. In response to new technologies and labor market trends, workers
can learn new trades or go back to school, allowing them to perform work in new or different sectors.
With time, workers also have the ability to relocate across regions to areas with better job prospects. As
workers adapt to the post-recession structure of the labor market, structural unemployment will decrease
and the condition of the labor market will continue to improve.
Several factors influencing labor force participation
The underwhelming rate of labor force participation, currently at 62.5%, is quite concerning for the future
of the labor market and the economy as a whole. However, this is not a permanent development resulting
from the onset of the Great Recession. Rather, it is the result of a confluence of cyclical and secular
factors.
During a recession, the relative attachment of the unemployed to the labor market is generally higher than
would be under normal conditions. According to Elsby, Hobijn, and Sahin (2013), during periods of
recovery following a recession this effect unwinds and the unemployment pool is increasingly composed
of workers with a lower labor market attachment. During a recovery it is to be expected that workers on
the participation margin are more likely to exit the labor force than they would be under normal
conditions.
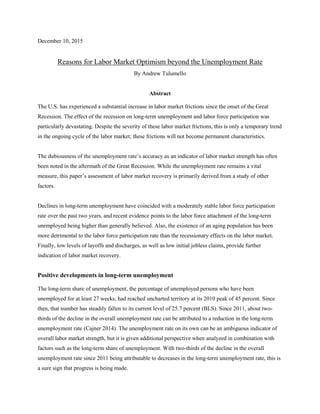
4. The recent decline in labor force participation is most significantly due to a demographic shift owed more
to secular forces rather than changes in the business cycle. According to a 2014 White House Council of
Economic Advisers report, slightly over half of the 3.1 percent drop in labor force participation from the
final quarter of 2007 through the second quarter of 2014 was due to the aging population. The baby
boomer generation was an anomalistic cohort whose aggregated retirement has sent the labor force
participation rate into a tailspin. This tailspin, however, is not expected to persist. According to the BLS,
by 2024 the labor force participation rate will have only dropped by one-and-a-half percentage points
from its current level.
Figure 2
The effects of an aging population will be largely offset by an increase in the labor force participation of
these older cohorts. Between 2014 and 2024 the age group of 65 to 69 is expected to see an increase in
labor force participation of over four-and-a-half percentage points (BLS). Increasing life expectancies
will also correspond with an increased physical ability of the elderly to perform work. A longer lifespan
also means financial obligations which may necessitate the elderly to remain in the labor force past the
traditional retirement age. For these reasons it can be deduced that the labor market has the ability to
adapt to demographic shifts; it will not be permanently characterized by a declining labor force
participation rate.
It is also worth noting that a declining labor force participation rate was a trend which began several years
before the onset of the Great Recession. In January of 2000 the labor force participation rate was 67.3%.
0.0
10.0
20.0
30.0
40.0
50.0
60.0
70.0
80.0
90.0
16 to 19 20 to 24 25 to 54 55 to 64 65 to 74 65 to 69 70 to 74
PERCENT
Labor Force Participation Rate by Age
1994 2004 2014 2024
5. By January 2005 it had fallen to 65.8%. Perhaps this decrease was due to the makeup of the
unemployment pool adjusting towards workers with lesser labor market attachment in the aftermath of the
2001 recession. Perhaps it was due to changing demographics and other outside social and economic
influences. (Due to length constraints, the early 2000s downturn in labor force participation will have to
be addressed further in a subsequent study.) It is nonetheless plausible to conceive that the declining labor
force participation observed post-Great Recession is at least partly a result of factors which precede the
recession. In other words, had the Great Recession not occurred, there would have likely still been an
underlying trend of declining labor force participation, albeit at a slower rate.
Steady gains in payroll employment and job openings
In the aftermath of the Great Recession, job growth has made a solid recovery. This is another sign that
the toll this recession took on the labor market is not permanent. Steady job gains over the past five years
point to a recovering labor market that is likely to observe continued job growth going forward. Such
significant job growth puts downward pressure on the unemployment rate, and could potentially have a
positive impact on labor force participation. Over the past year, the U.S. has averaged a monthly gain of
237,000 jobs. Since January 2010 there has been a 9.68% increase in the total nonfarm payroll
employment (BLS). More people working is representative of a stronger demand for labor, and continued
job growth at this pace will ultimately lead to a renewed strength of the labor market.
The number of job openings has also been steadily on the rise since recession’s end. As of September
2015 there were 5.53 million job openings in the U.S., a 94.6% increase from the number of job openings
in July 2009 (BLS). At the very least this means that workers have more options when it comes to finding
a job, and at best it is an indication of a strong labor market.
Similar to the unemployment rate, job gains and job openings are not infallible measures of labor market
strength. These measures do not account for the quality or compensation level of the jobs in question. The
data on job openings also does not factor in the intensity with which a firm is trying to fill the position.
This recruitment intensity varies along with the true strength of the labor market – more intensity
(characterized by higher compensation offerings, less required qualifications) when the labor market is
strong, and less intensity when it is weak (Davis 2012). So it is possible that the increasing number of job
openings indeed reflects the increasing strength of the labor market, but it is also possible that job
openings are simply going unfilled as firms hold out for better qualified candidates willing to accept
lesser compensation.
6. Significant reductions in layoffs and initial claims
Since the end of the Great Recession, the U.S. has seen substantial decreases in levels of worker layoffs
and discharges. Such low levels of layoffs and discharges are indicative of an improving labor market. As
noted by Janet Yellen in a speech at the 2013 National Association for Business Economics Policy
Conference, “Layoffs and discharges as a share of total employment have already returned to their pre-
recession level.” The number of workers laid off or discharged in September 2015 was 40.3% less than
the corresponding number during the recessionary peak month of April 2009 (BLS). These developments
reflect the continuing improvement of the labor market, and provide yet another source of optimism going
forward.
Table 1
Noteworthy declines in Initial Claims, Layoffs since peak of Great Recession
Apr-09 Apr-10 Apr-11 Apr-12 Apr-13 Apr-14 Apr-15 Oct-15
Initial
Unemployment
Claims (1st
week of
month)
653,000 479,000 395,000 389,000 358,000 310,000 282,000 262,000
Layoffs and
Discharges
(Total nonfarm
in thousands)
2,592 1,660 1,669 1,841 1,720 1,703 1,784 1,670
Initial unemployment insurance claims serve as an effective leading indicator of the unemployment rate
and general labor market conditions. The number of initial claims has already descended to pre-recession
levels, and continues to decline further. In October 2015 the 4-week moving average of initial claims fell
below 260,000 for the first time since 1973 (DOLETA). Decreasing levels of initial jobless claims usually
signal future decreases in the unemployment rate. Based on recent measures of initial claims, it can be
expected that an unemployment rate at or below its current level will be observed into the near future.
The importance of worker perceptions of the labor market should not be underestimated. A lesser
mentioned indicator of labor market strength is the quits rate (the monthly number of job quits as a
percentage of total employment). A higher quits rate reflects workers’ increased confidence in their
ability to land a better job. While the quits rate has not made as quick of a recovery as layoffs and
discharges or initial claims, it is rising ever closer to its pre-recession rate. It has risen from 1.3% in
January 2000 to 1.9% in September 2015 (BLS). Worker confidence in the aftermath of the Great
7. Recession is slowly, but steadily rising. As this confidence continues to strengthen, so too will the labor
market.
Conclusion
Looking over the horizon, there are many rays of light illuminating the landscape of recovery. The freefall
of the labor force participation rate seems to be in its final stages, the plight of the long-term unemployed
does not seem a bleak as it once did, and many other useful measures have shown considerable and
consistent improvement. Although the process has been deliberate, even painful, the labor market is
showing signs of strength and recovery.
Like a living creature, the labor market is also evolving, developing new characteristics. Despite
indications of future stability of the labor force participation rate, it is not reasonable to expect any
significant increases in this rate anytime soon. And even though there appears to be a healthier demand
for labor, it has not been accompanied by higher wages. Improvements in real wage growth are vital to
the condition of the labor market and its potential for future strength.
The labor market outlook remains partly dependent on demographic developments and other external
economic variables. The existence of an aging population is not going to permanently weaken the labor
market, but adaptations must take place, most likely in the form of delayed retirement and continued
employment into old age. Finally, future increases in interdependent measures such as real GDP growth
and personal consumption expenditures would be greatly beneficial to labor market strength.
The U.S. labor market was ravaged by the Great Recession. Some of its effects still endure today, yet
these frictions do not appear to be permanent. A thorough analysis of the data yields reasons for optimism
in the labor market outlook.
8. References
Bureau of Labor Statistics. U.S. Department of Labor. "Civilian Labor Force Participation Rate by Age,
Gender, Race, and Ethnicity." Dec. 2015 Monthly Labor Review.
<http://www.bls.gov/emp/ep_table_303.htm>.
Bureau of Labor Statistics. U.S. Department of Labor. Employment Situation Summary. 4 Dec. 2015.
<http://www.bls.gov/news.release/empsit.nr0.htm>.
Bureau of Labor Statistics. U.S. Department of Labor. Job Openings and Labor Turnover. 12 Nov. 2015.
<http://www.bls.gov/news.release/pdf/jolts.pdf>.
Bureau of Labor Statistics. U.S. Department of Labor. “Labor Force Statistics from the Current
Population Survey: Of Total Unemployed, Percent Unemployed 27 Weeks & Over.” Dec. 2015.
<http://data.bls.gov/timeseries/LNS13025703>.
Cajner, Tomaz and David Ratner. “The Recent Decline in Long-Term Unemployment.” 21 Jul. 2014.
FEDS Notes. Board of Governors of the Federal Reserve System.
<http://www.federalreserve.gov/econresdata/notes/feds-notes/2014/the-recent-decline-in-long-term-
unemployment-20140721.html#fn2>.
Davis, Stephen J., et. al. “The Establishment-Level Behavior of Vacancies and Hiring.” 30 Dec. 2012.
<http://faculty.chicagobooth.edu/steven.davis/pdf/w16265.pdf>.
Elsby, Michael W.L., Bart Hobijn, and Aysegül Sahin. "On the Importance of the Participation Margin
for Labor Market Fluctuations," Feb. 2013. FRBSF Working Paper.
Employment and Training Administration. U.S. Department of Labor. 4-Week Moving Average of Initial
Claims. Nov. 2015. <https://research.stlouisfed.org/fred2/series/IC4WSA>.
White House Council of Economic Advisers. “The Labor Force Participation Rate since 2007: Causes
and Policy Implications." Jul. 2014.
<https://www.whitehouse.gov/sites/default/files/docs/labor_force_participation_report.pdf>.
Yellen, Janet L. "Challenges Confronting Monetary Policy." National Association for Business
Economics Policy Conference. Washington, D.C. 4 Mar. 2013.
<http://www.federalreserve.gov/newsevents/speech/yellen20130302a.htm>.