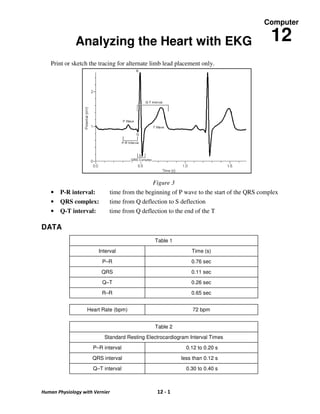
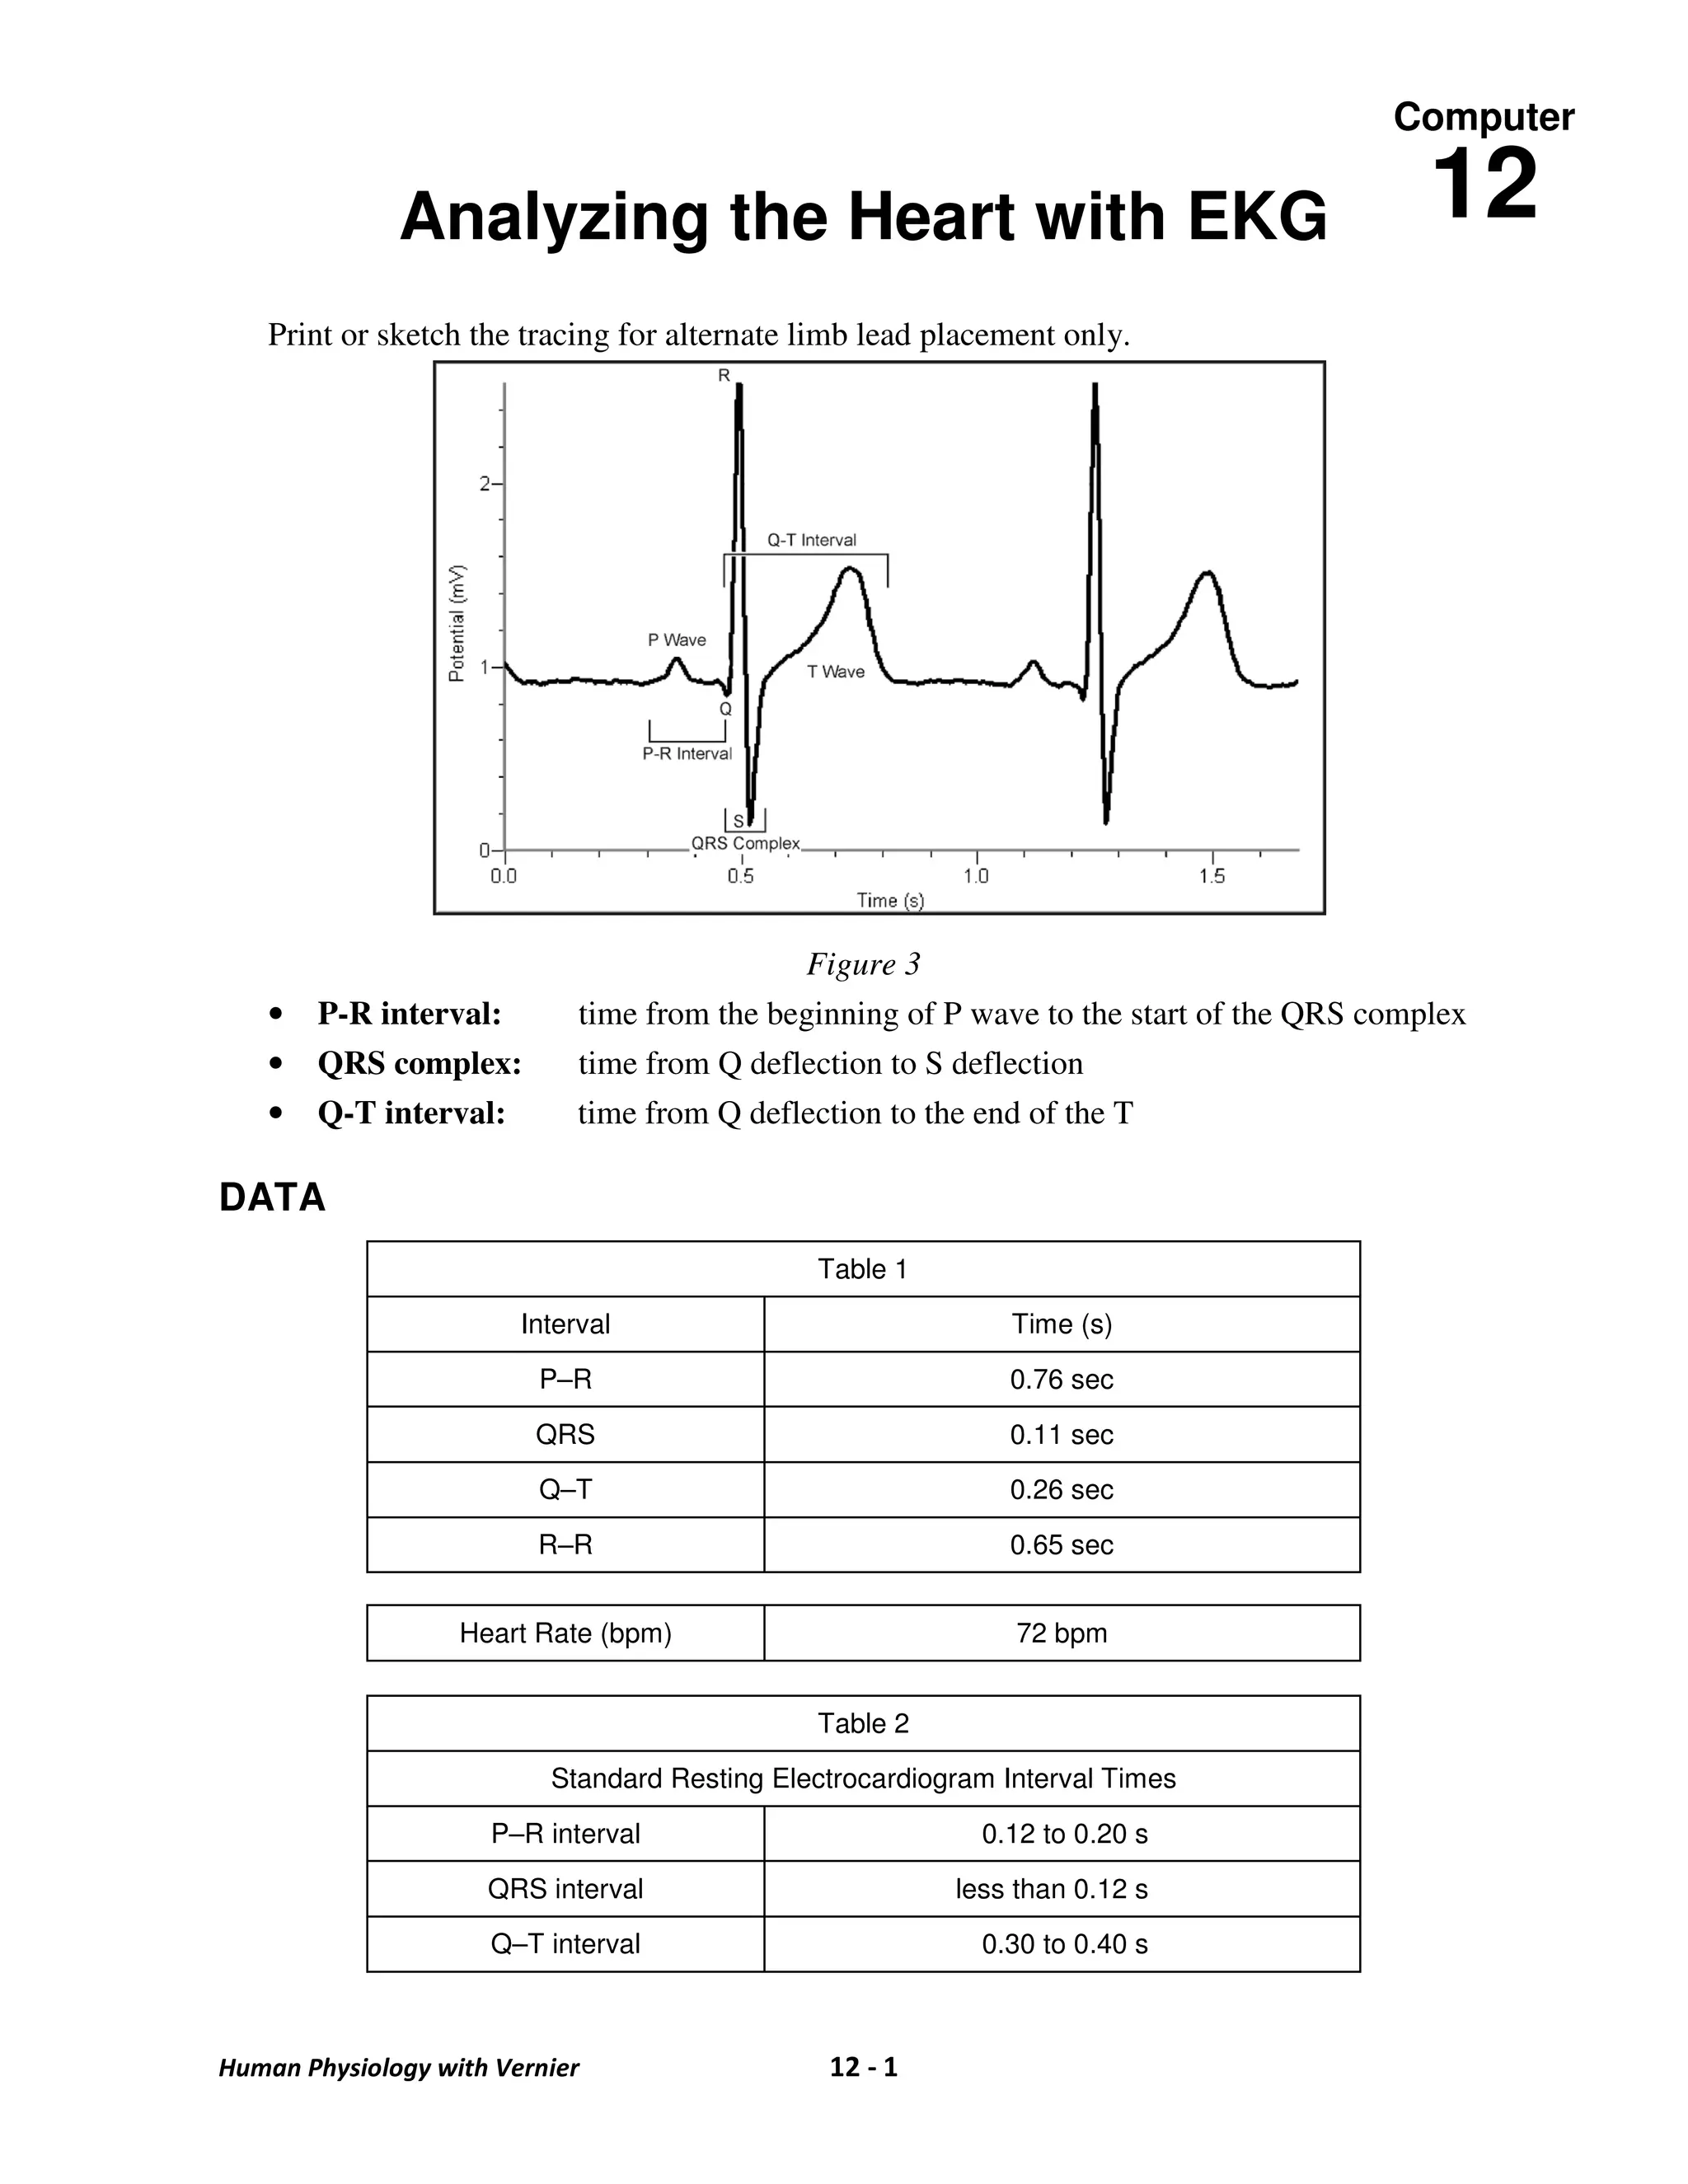
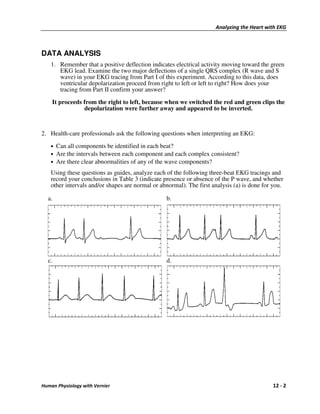
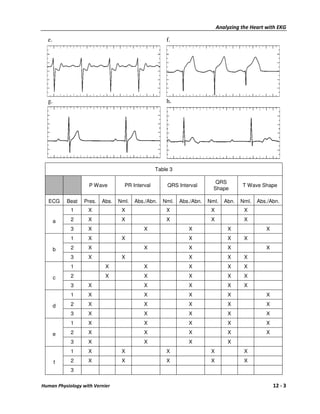
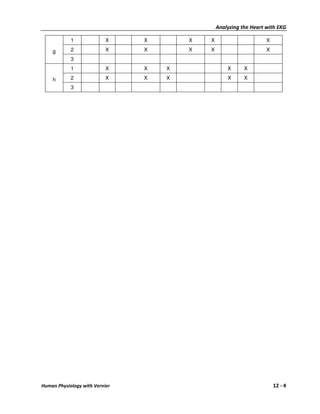
Computer

              Analyzing the Heart with EKG                                                 12
   Print or sketch the tracing for alternate limb lead placement only.


                                             Figure 3
   •   P-R interval:         time from the beginning of P wave to the start of the QRS complex
   •   QRS complex:          time from Q deflection to S deflection
   •   Q-T interval:         time from Q deflection to the end of the T

DATA
                                              Table 1

                        Interval                              Time (s)

                         P–R                                 0.76 sec

                         QRS                                 0.11 sec
                         Q–T                                 0.26 sec

                         R–R                                 0.65 sec


                   Heart Rate (bpm)                           72 bpm


                                              Table 2
                          Standard Resting Electrocardiogram Interval Times

                     P–R interval                          0.12 to 0.20 s

                     QRS interval                        less than 0.12 s
                     Q–T interval                          0.30 to 0.40 s


Human Physiology with Vernier                  12 - 1
Analyzing the Heart with EKG


DATA ANALYSIS
   1. Remember that a positive deflection indicates electrical activity moving toward the green
      EKG lead. Examine the two major deflections of a single QRS complex (R wave and S
      wave) in your EKG tracing from Part I of this experiment. According to this data, does
      ventricular depolarization proceed from right to left or left to right? How does your
      tracing from Part II confirm your answer?

    It proceeds from the right to left, because when we switched the red and green clips the
                depolarization were further away and appeared to be inverted.


2. Health-care professionals ask the following questions when interpreting an EKG:

   • Can all components be identified in each beat?
   • Are the intervals between each component and each complex consistent?
   • Are there clear abnormalities of any of the wave components?

   Using these questions as guides, analyze each of the following three-beat EKG tracings and
   record your conclusions in Table 3 (indicate presence or absence of the P wave, and whether
   other intervals and/or shapes are normal or abnormal). The first analysis (a) is done for you.

  a.                                             b.


  c.                                             d.


Human Physiology with Vernier                                                               12 - 2
Analyzing the Heart with EKG

  e.                                                 f.


  g.                                                 h.


                                                 Table 3

                                                                          QRS
                    P Wave         PR Interval       QRS Interval                     T Wave Shape
                                                                         Shape

   ECG     Beat   Pres.   Abs.   Nml.   Abs./Abn.   Nml.   Abs./Abn.   Nml.    Abn.   Nml.   Abs./Abn.
            1      X              X                  X                  X              X

       a    2      X              X                  X                  X              X
            3      X                       X                  X                 X               X
            1      X              X                           X                 X      X

       b    2      X                       X                  X                 X               X
            3      X              X                           X                 X      X
            1              X               X                  X                 X      X

       c    2              X               X                  X                 X      X
            3      X                       X                  X                 X      X
            1      X                       X                  X                 X               X

       d    2      X                       X                  X                 X               X
            3      X                       X                  X                 X               X
            1      X                       X                  X                 X               X

       e    2      X                       X                  X                 X               X
            3      X                       X                  X                 X
            1      X              X                  X                  X              X

       f    2      X              X                  X                  X              X
            3


Human Physiology with Vernier                                                                       12 - 3
Analyzing the Heart with EKG

            1              X    X       X   X                       X

    g       2              X    X       X   X                       X
            3
            1              X    X   X               X      X

    h       2              X    X   X               X      X
            3


Human Physiology with Vernier                                           12 - 4

Lab 3 final

  • 1.
    Computer Analyzing the Heart with EKG 12 Print or sketch the tracing for alternate limb lead placement only. Figure 3 • P-R interval: time from the beginning of P wave to the start of the QRS complex • QRS complex: time from Q deflection to S deflection • Q-T interval: time from Q deflection to the end of the T DATA Table 1 Interval Time (s) P–R 0.76 sec QRS 0.11 sec Q–T 0.26 sec R–R 0.65 sec Heart Rate (bpm) 72 bpm Table 2 Standard Resting Electrocardiogram Interval Times P–R interval 0.12 to 0.20 s QRS interval less than 0.12 s Q–T interval 0.30 to 0.40 s Human Physiology with Vernier 12 - 1
  • 2.
    Analyzing the Heartwith EKG DATA ANALYSIS 1. Remember that a positive deflection indicates electrical activity moving toward the green EKG lead. Examine the two major deflections of a single QRS complex (R wave and S wave) in your EKG tracing from Part I of this experiment. According to this data, does ventricular depolarization proceed from right to left or left to right? How does your tracing from Part II confirm your answer? It proceeds from the right to left, because when we switched the red and green clips the depolarization were further away and appeared to be inverted. 2. Health-care professionals ask the following questions when interpreting an EKG: • Can all components be identified in each beat? • Are the intervals between each component and each complex consistent? • Are there clear abnormalities of any of the wave components? Using these questions as guides, analyze each of the following three-beat EKG tracings and record your conclusions in Table 3 (indicate presence or absence of the P wave, and whether other intervals and/or shapes are normal or abnormal). The first analysis (a) is done for you. a. b. c. d. Human Physiology with Vernier 12 - 2
  • 3.
    Analyzing the Heartwith EKG e. f. g. h. Table 3 QRS P Wave PR Interval QRS Interval T Wave Shape Shape ECG Beat Pres. Abs. Nml. Abs./Abn. Nml. Abs./Abn. Nml. Abn. Nml. Abs./Abn. 1 X X X X X a 2 X X X X X 3 X X X X X 1 X X X X X b 2 X X X X X 3 X X X X X 1 X X X X X c 2 X X X X X 3 X X X X X 1 X X X X X d 2 X X X X X 3 X X X X X 1 X X X X X e 2 X X X X X 3 X X X X 1 X X X X X f 2 X X X X X 3 Human Physiology with Vernier 12 - 3
  • 4.
    Analyzing the Heartwith EKG 1 X X X X X g 2 X X X X X 3 1 X X X X X h 2 X X X X X 3 Human Physiology with Vernier 12 - 4