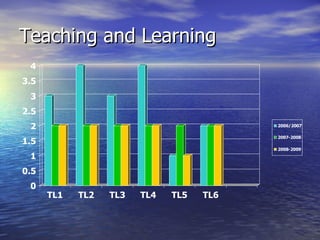
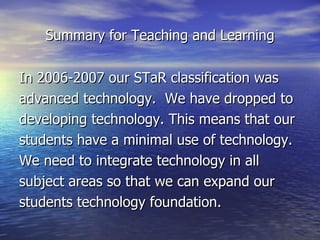
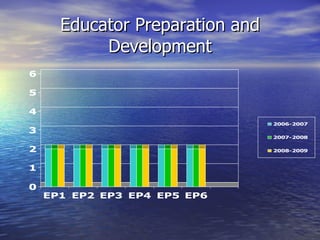
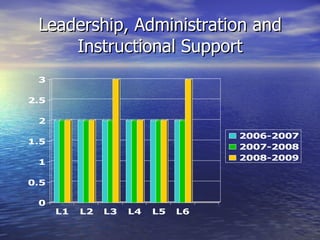
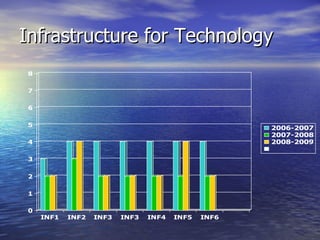
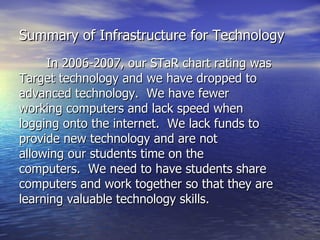
Kujawa STaR Chart Information Presented by Lisa Memmelaar
What is a STaR Chart? STaR Chart is a tool used to  help districts plan and  implement long range  technology goals.
Data The following slides will show you data from 2006-2007, 2007-2008, and 2008-2009 school years.  Each year we should be improving our rating.  Let’s take a look at and see how we are using technology in our school.
The 4 components of  STaR Chart Teaching and Learning Educator Preparation Administration and Support Infrastructure
Key Area Ratings 6 to 8 = Early Technology 9 to 14 = Developing Technology 15 to 20 = Advanced Technology 21 to 24 = Target Technology
Teaching and Learning
Summary for Teaching and Learning In 2006-2007 our STaR classification was advanced technology.  We have dropped to developing technology. This means that our students have a minimal use of technology. We need to integrate technology in all subject areas so that we can expand our students technology foundation.
Educator Preparation and Development
Summary of Educator Preparation We were Developing technology in 2006 2007 and we have not increased or decreased.  We must integrate technology into teaching and learning.  We need to get familiar with the TEKS and attend professional development so that we are familiar teaching technology to our students.
Leadership, Administration and Instructional Support
Summary of Administration and Support In 2006-2007, we were developing technology and now are advanced technology.  We are communicating more through email and collaborating with others through TRIAND.  We need to continue to ask our support tech for help and continue online learning.
Infrastructure for Technology
Summary of Infrastructure for Technology In 2006-2007, our STaR chart rating was Target technology and we have dropped to advanced technology.  We have fewer working computers and lack speed when  logging onto the internet.  We lack funds to provide new technology and are not allowing our students time on the computers.  We need to have students share computers and work together so that they are learning valuable technology skills.
Further Information about STaR Chart http://starchart.esc12.net/

Kujawa S Ta R Chart Information

  • 1.
    Kujawa STaR ChartInformation Presented by Lisa Memmelaar
  • 2.
    What is aSTaR Chart? STaR Chart is a tool used to help districts plan and implement long range technology goals.
  • 3.
    Data The followingslides will show you data from 2006-2007, 2007-2008, and 2008-2009 school years. Each year we should be improving our rating. Let’s take a look at and see how we are using technology in our school.
  • 4.
    The 4 componentsof STaR Chart Teaching and Learning Educator Preparation Administration and Support Infrastructure
  • 5.
    Key Area Ratings6 to 8 = Early Technology 9 to 14 = Developing Technology 15 to 20 = Advanced Technology 21 to 24 = Target Technology
  • 6.
  • 7.
    Summary for Teachingand Learning In 2006-2007 our STaR classification was advanced technology. We have dropped to developing technology. This means that our students have a minimal use of technology. We need to integrate technology in all subject areas so that we can expand our students technology foundation.
  • 8.
  • 9.
    Summary of EducatorPreparation We were Developing technology in 2006 2007 and we have not increased or decreased. We must integrate technology into teaching and learning. We need to get familiar with the TEKS and attend professional development so that we are familiar teaching technology to our students.
  • 10.
    Leadership, Administration andInstructional Support
  • 11.
    Summary of Administrationand Support In 2006-2007, we were developing technology and now are advanced technology. We are communicating more through email and collaborating with others through TRIAND. We need to continue to ask our support tech for help and continue online learning.
  • 12.
  • 13.
    Summary of Infrastructurefor Technology In 2006-2007, our STaR chart rating was Target technology and we have dropped to advanced technology. We have fewer working computers and lack speed when logging onto the internet. We lack funds to provide new technology and are not allowing our students time on the computers. We need to have students share computers and work together so that they are learning valuable technology skills.
  • 14.
    Further Information aboutSTaR Chart http://starchart.esc12.net/