Downloaded 3,223 times
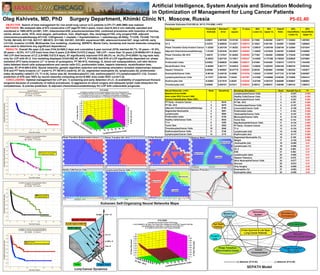

This study analyzes the management optimization for non-small lung cancer patients through data from 672 cases over 1985-2016, revealing a 5-year survival rate of 69.7% and a significant dependence on various clinical factors. Key findings highlight the importance of early detection, experienced surgical teams, and comprehensive treatment approaches, including adjuvant therapies. The research concludes with a call for improved management strategies tailored to patient prognosis.


