Download as PDF, PPTX
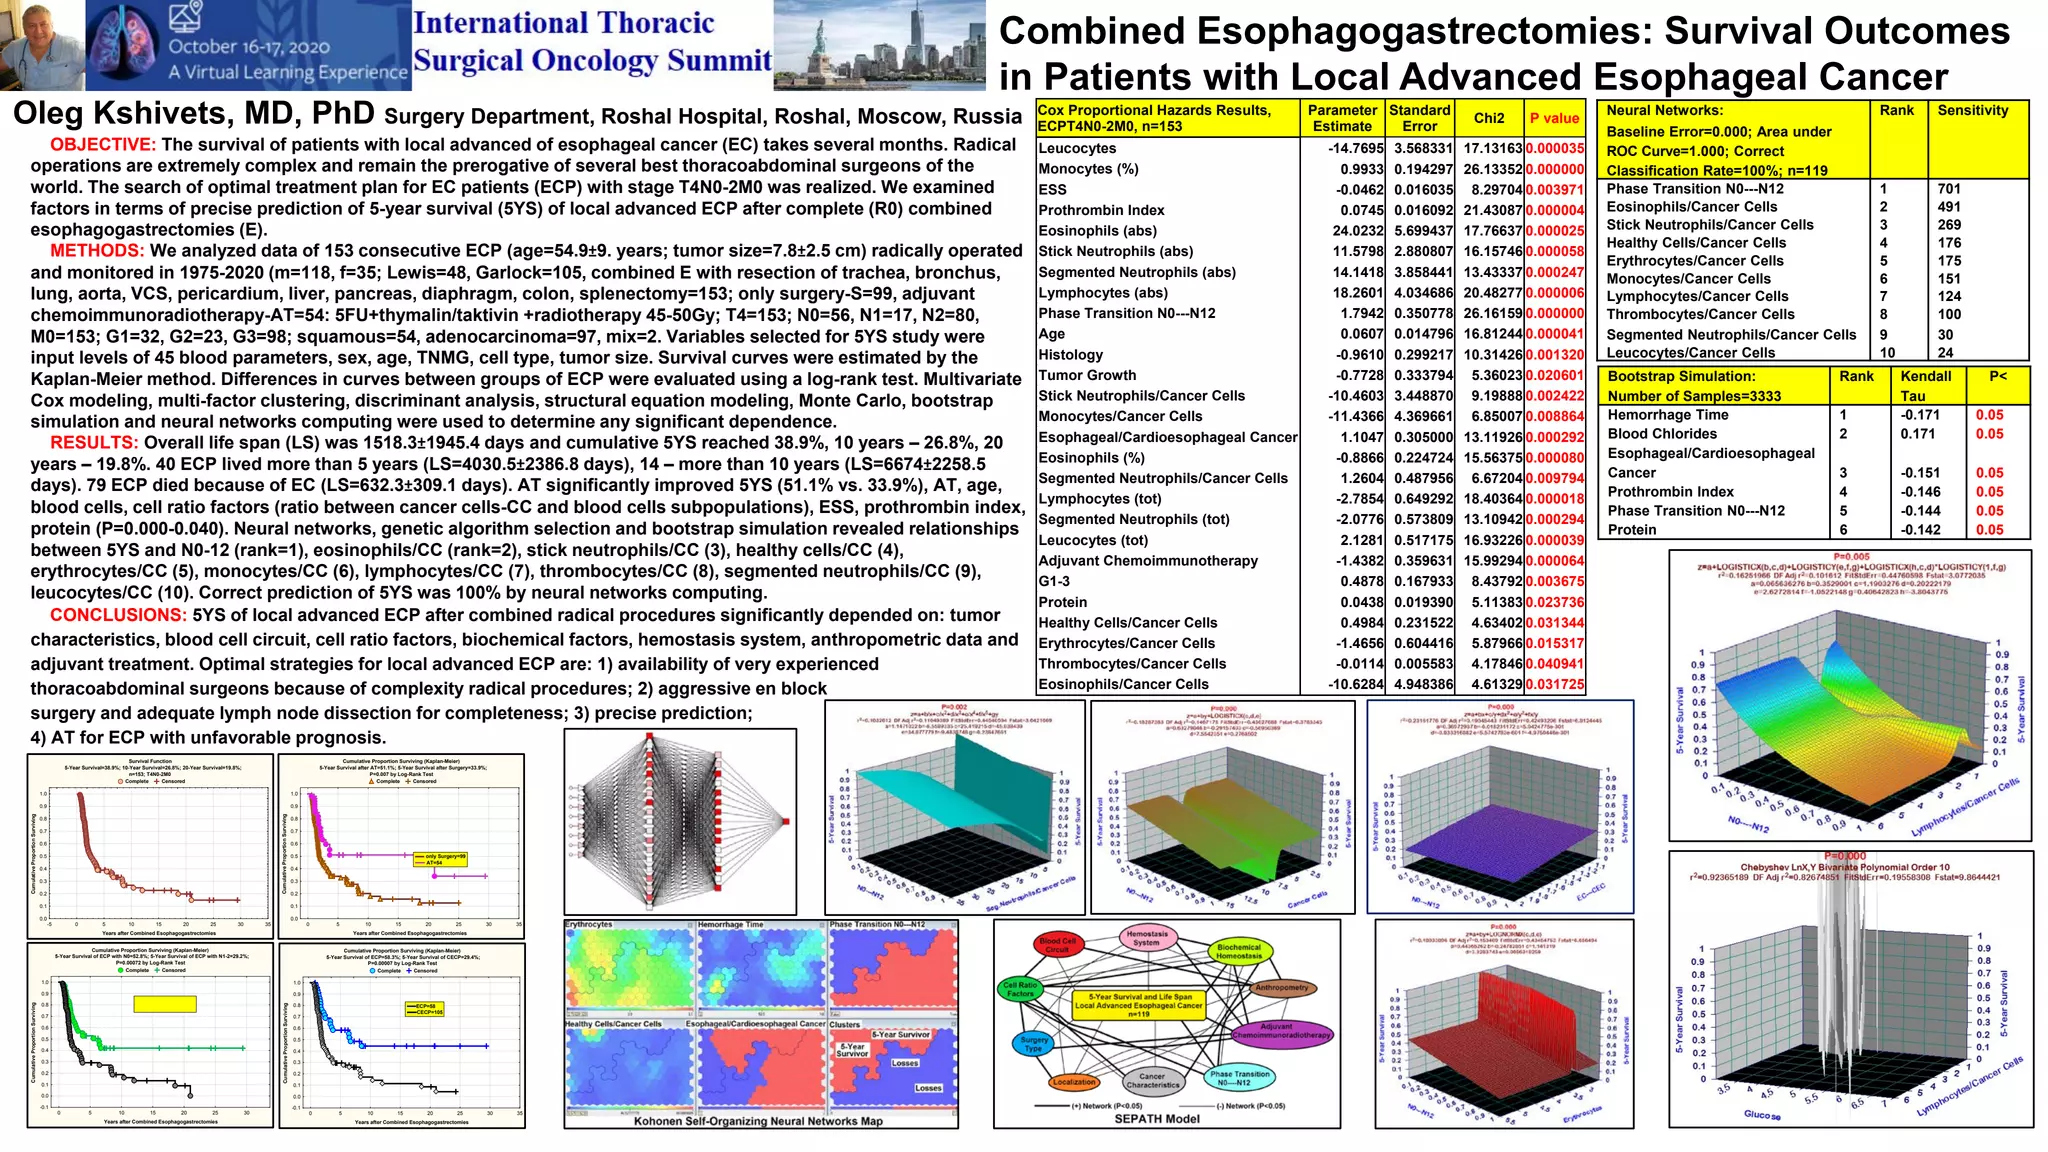

This study analyzes survival outcomes in patients with local advanced esophageal cancer (EC) who underwent radical combined esophagogastrectomies. The 5-year survival rate was found to be 38.9%, significantly influenced by tumor characteristics, blood cell parameters, and adjuvant treatments. Neural network models predicted survival with 100% accuracy, emphasizing the need for experienced surgical teams and complete lymph node dissection for better outcomes.


